
Personal Finance
Click the play button below to hear Andrew Ruhland’s “3 Key Investment Themes” from his presentation at the 2013 World Outlook Financial Conference.
Click here to find out more about Andrew Ruhland and the team at Integrated Wealth Management

If there’s one single, indispensable key to successful investing, it’s to go with the flow.
That’s my distillation of well-worn market mantras that you’re probably familiar with.
Trade the market you are given, not the one you want;
You can do all the homework and analysis you want – and be right – and yet still lose money. That happens when you own stocks you love, but the market isn’t loving any stocks. It can happen when you try to pick bottoms, and you get in before the market heads a lot lower.
And while you won’t lose any money by not being in the market, you’re not going to make any money in it either.
That brings us to today. We’ve had a furious up-move in the market since March 2009. We’re scratching at new all-time highs, and global markets are dancing to the same tune.
But the world hasn’t changed since last May – or the May before, when markets swooned on fears about Europe, America’s fiscal fiasco, a slowing China, or any of the other dark clouds that, at any time, can rain on the markets.
So, are we going higher? Are we going to get a wicked correction? Is the sun rising or setting?
We don’t know if the market is going higher from here or if it’s headed down. But, we do know that the sun rises and the sun sets… every day.
That’s why, even if you could distill all of the unknowns that you don’t know into a plan of action, the only sensible plan is to not guess, but simply to go with the flow.
Going with the flow means following the trend – and not fighting the tape or the Fed. But it’s not just a different way of saying those things.
For me, it’s about looking underneath what’s being talked about. It’s looking at investor psychology by looking at the flow of capital into or out of the market.
I go with the flow of capital. I don’t complicate my money-making endeavors in the market by overanalyzing or hoping. The most important thingfor me is simply being on the right side of which direction capital is flowing.
Capital has been flowing into the market. It doesn’t matter that a lot of that flow is coming from the Fed’s stimulus efforts, it’s still capital flowing in. Don’t complicate things.
If capital starts flowing out of the market, I’m not going to fight that trend – once I recognize that it’s the force of the prevailing psychology. I’ll go with the flow.
And you should, too. Don’t sit on the sidelines if there’s a party going on. Join it.
That’s what’s happening now. That’s what has been happening.
Don’t worry about what you don’t know. Just have an exit plan in place. It’s as simple as having stops – and raising them as your positions become more profitable.
So what if you get stopped out – especially with a profit – and the party gets going again. Get back in, even if that means higher prices than where you got out. Simply tighten up your new stops by placing them just below where the latest good support level is.
And, because it’s widely available, always have downside protection in place. It’s easy enough with ETFs that offer inverse positioning and with instruments like VXX.
I look at the market like the old lotto saying, “You’ve got to be in it to win it.”
Up or down, it doesn’t matter to me… as long as I go with the flow.
![]() [Editor’s Note: Shah Gilani has been “inside” the market for more than 30 years as a Wall Street broker/dealer, a hedge fund manager, a currency manager, and a bond trader. As Shah explains, you can buy a stock and wait. Or you can bank on a transaction and stand to get paid. That’s what Wall Street’s dealmakers do. In this brief video Shah reveals six white-hot deal opportunities you need to know about now. This won’t be around long. Go here now.]
[Editor’s Note: Shah Gilani has been “inside” the market for more than 30 years as a Wall Street broker/dealer, a hedge fund manager, a currency manager, and a bond trader. As Shah explains, you can buy a stock and wait. Or you can bank on a transaction and stand to get paid. That’s what Wall Street’s dealmakers do. In this brief video Shah reveals six white-hot deal opportunities you need to know about now. This won’t be around long. Go here now.]

Back on November 19 we wrote a piece in our “Portfolio Manager’s Journal” that we felt the market was putting in an important low. Several technical indicators we were following at the time suggested that the post U.S. election sell-off had run it’s course. In particular, the NYSE Summation Index was at levels associated with previous market bottoms so the odds were stacking in favor of a significant rally. In hindsight our call was correct with the market trading higher and recording new recovery highs on Friday February 1st.
The rally has lasted more than two months, gaining almost 13% as measured by the performance of the S&P 500 Index. Now that the rally has unfolded as we anticipated we want to provide an update on the near-term outlook.
This week we are at an important juncture in terms of time and price with the odds now in favor of a short-term market top at current levels. We employ several different techniques in our market analysis, providing us with some interesting observations.
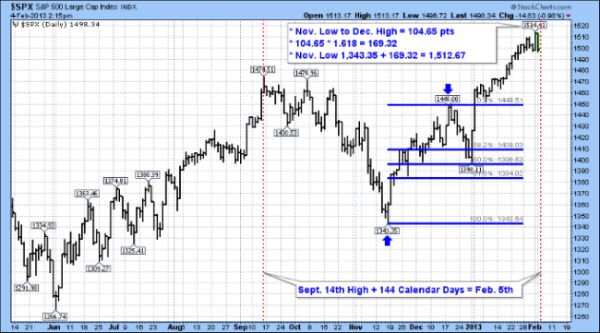
We like to use the Fibonacci number sequence to help us identify support and resistance price levels as well as projecting future time zones where we would be on the lookout for potential trend reversals. If we use the September 14th high and project out 144 calendar days the date for a potential turning point is Tuesday February 5th as indicated by the red dotted vertical dotted line on the chart.
The method for projecting the price target level involves taking the range between the November low and the December high. The range was 104.65 points. Next we multiply this value by the Fibonacci ratio of 1.618 which gives us a value of 169.32. If we then add this value to the November low of 1,343.35 we arrive at a price target of 1,512.67.
On Friday the market recorded an intraday high of 1,514.41 which is less than 2 points above out target!
Therefore with time and price at an important juncture we feel that the current rally is likely over for now and that we should expect a market correction to begin. Some other factors that support a price high is seasonality and sentiment. In post-election years the U.S. market tends to peak in the first week of February and decline into late March. In the past couple of weeks the bullish sentiment numbers indicate above average optimism and the bearish sentiment is also relatively low. From a contrarian perspective we interpret these numbers as another sign of a top.
Our current strategy is to hold off on any more buying until the market declines to an oversold level. We will be reviewing all our individual stock positions to identify stop loss levels in the event that the decline begins to accelerate on the downside.
The next six weeks should be choppy and volatile as those that came late to this rally become nervous and think twice about their recent purchases. We will provide another update when we feel that it’s safe to go back in the water!
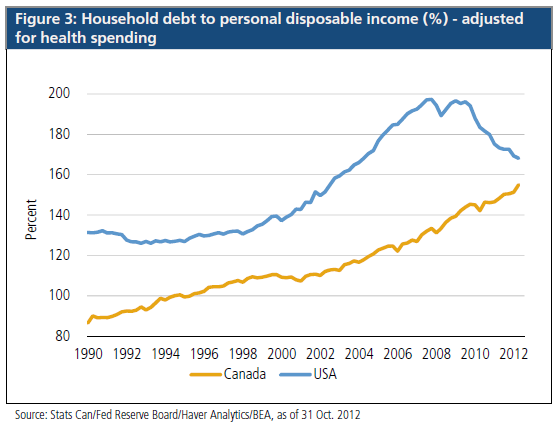
- As Canadian consumers have increased their mortgage debt and bid up housing prices, the potential for a disorderly unwinding of these imbalances rightly concerns the Bank of Canada.
- PIMCO believes that the bank’s next policy move will be to raise interest rates, but with the traditional aim of fighting inflation rather than reducing home prices and consumer debt.
- We expect the Bank of Canada to continue tightening mortgage credit and using moral suasion to damp the housing boom and discourage consumers from taking on more debt.
What is the correct policy response to a prospective asset bubble? This question has been the focus of considerable academic research, especially since the financial crisis of 2008. Recent communication from the Bank of Canada (BoC) suggests it is considering hiking policy rates in response to the recent surge in household debt and home prices. If it does, this could represent a decisive change in its inflation-targeting strategy for monetary policy. At a minimum, it would get the attention of public policymakers worldwide owing to Bank of Canada Governor Mark Carney’s position as chair of the G20 Financial Stability Board (FSB).
……much more & 6 Charts HERE
 A quick message from Michael Campbell

-
I know Mike is a very solid investor and respect his opinions very much. So if he says pay attention to this or that - I will.
~ Dale G.
-
I've started managing my own investments so view Michael's site as a one-stop shop from which to get information and perspectives.
~ Dave E.
-
Michael offers easy reading, honest, common sense information that anyone can use in a practical manner.
~ der_al.
-
A sane voice in a scrambled investment world.
~ Ed R.
Inside Edge Pro Contributors

Greg Weldon

Josef Schachter

Tyler Bollhorn

Ryan Irvine

Paul Beattie

Martin Straith

Patrick Ceresna

Mark Leibovit

James Thorne

Victor Adair