

Back on November 19 we wrote a piece in our “Portfolio Manager’s Journal” that we felt the market was putting in an important low. Several technical indicators we were following at the time suggested that the post U.S. election sell-off had run it’s course. In particular, the NYSE Summation Index was at levels associated with previous market bottoms so the odds were stacking in favor of a significant rally. In hindsight our call was correct with the market trading higher and recording new recovery highs on Friday February 1st.
The rally has lasted more than two months, gaining almost 13% as measured by the performance of the S&P 500 Index. Now that the rally has unfolded as we anticipated we want to provide an update on the near-term outlook.
This week we are at an important juncture in terms of time and price with the odds now in favor of a short-term market top at current levels. We employ several different techniques in our market analysis, providing us with some interesting observations.
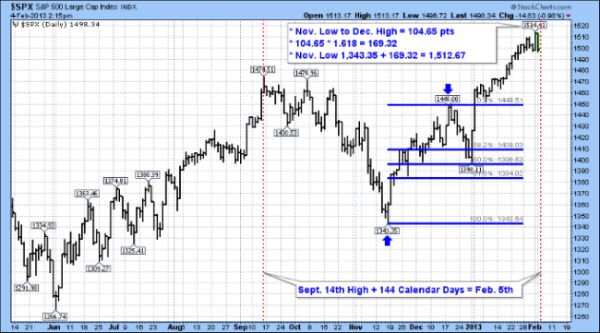
We like to use the Fibonacci number sequence to help us identify support and resistance price levels as well as projecting future time zones where we would be on the lookout for potential trend reversals. If we use the September 14th high and project out 144 calendar days the date for a potential turning point is Tuesday February 5th as indicated by the red dotted vertical dotted line on the chart.
The method for projecting the price target level involves taking the range between the November low and the December high. The range was 104.65 points. Next we multiply this value by the Fibonacci ratio of 1.618 which gives us a value of 169.32. If we then add this value to the November low of 1,343.35 we arrive at a price target of 1,512.67.
On Friday the market recorded an intraday high of 1,514.41 which is less than 2 points above out target!
Therefore with time and price at an important juncture we feel that the current rally is likely over for now and that we should expect a market correction to begin. Some other factors that support a price high is seasonality and sentiment. In post-election years the U.S. market tends to peak in the first week of February and decline into late March. In the past couple of weeks the bullish sentiment numbers indicate above average optimism and the bearish sentiment is also relatively low. From a contrarian perspective we interpret these numbers as another sign of a top.
Our current strategy is to hold off on any more buying until the market declines to an oversold level. We will be reviewing all our individual stock positions to identify stop loss levels in the event that the decline begins to accelerate on the downside.
The next six weeks should be choppy and volatile as those that came late to this rally become nervous and think twice about their recent purchases. We will provide another update when we feel that it’s safe to go back in the water!


