
Personal Finance
As the markets once again approach historic highs—the overly exuberant tone, extreme complacency and weakness in the economic data, bring to mind Bob Farrell’s 10 investment rules as applied to today’s Stock Market and sentiment Charts. These rules illuminate today’s markets and should be a staple for any long term successful investor. These rules are often quoted yet rarely heeded—just as they are now. Bob Farrell is a Wall Street veteran with over 50 years of experience in crafting his investing rules. Farrell obtained his masters degree from Columbia Business School and started as a technical analyst at Merrill Lynch in 1957. Even though Farrell studied fundamental analysis under Gramm and Dodd, he turned to technical analysis after realizing there was more to stock prices than balance sheets and income statements. Farrell became a pioneer in sentiment studies and market psychology. His 10 rules on investing stem from personal experience with dull markets, bull markets, bear markets, crashes and bubbles. In short, Farrell has seen it all and lived to tell about it.
The 10 Rules Of Investing
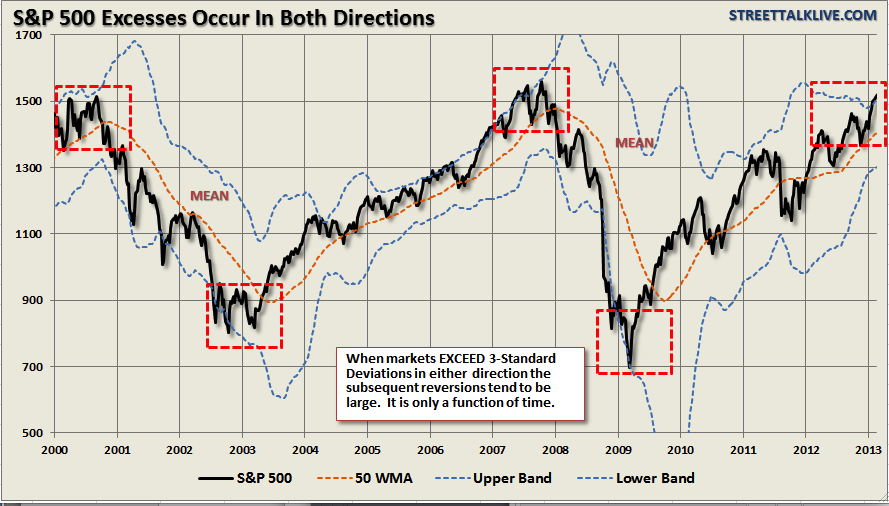
1. Excesses in one direction will lead to an opposite excess in the other direction.
Markets that overshoot on the upside will also overshoot on the downside, kind of like a pendulum. The further it swings to one side, the further it rebounds to the other side. This is the extension of Rule #1 as it applies to longer term market cycles (cyclical markets).
While the chart above showed prices behave on a short term basis – on a longer term basis markets also respond to Newton’s 3rd law of motion: “For every action there is an equal and opposite reaction.” The first chart shows that cyclical markets reach extremes when more than 3-standard deviations above the 50-week moving average. For the first time since the lows of the market in 2009 this has now occurred. Notice that these excesses ARE NEVER worked off by just going sideways.
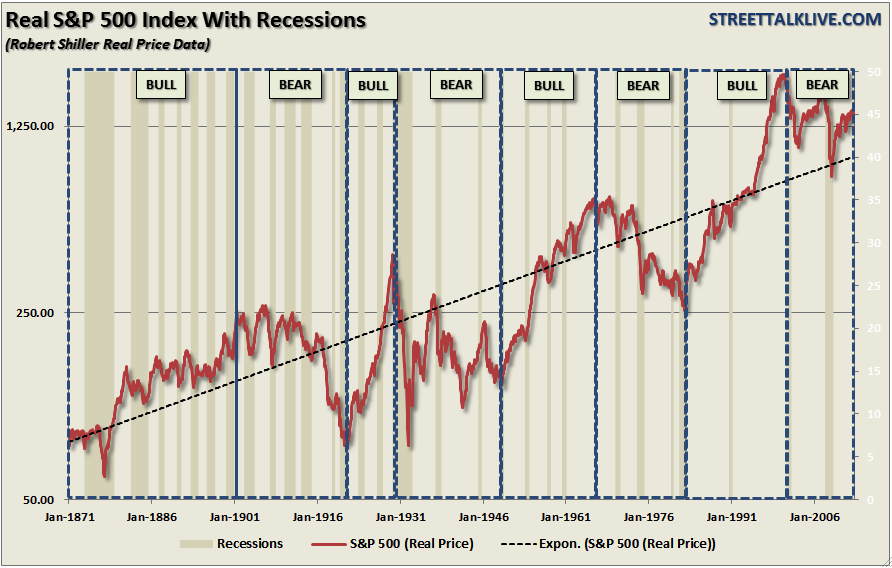
The second chart shows the price reversions of the S&P 500 on a long term basis and adjusted for inflation. Notice that when prices have historically reached extremes – the reversion in price is just as extreme. It is clear that the current reversion in the stock market is still underway from the 2000 peak.
2. Markets tend to return to the mean (average price) over time.
Like a rubber band that has been stretched too far – it must be relaxed in order to be stretched again. This is exactly the same for stock prices which are anchored to their moving averages. Trends that get overextended in one direction, or another, always return to their long-term average. Even during a strong uptrend or strong downtrend, prices often move back (revert) to a long-term moving average. The chart below shows the S&P 500 with a 52-week simple moving average.
Via Lance Roberts of Street Talk Live blog
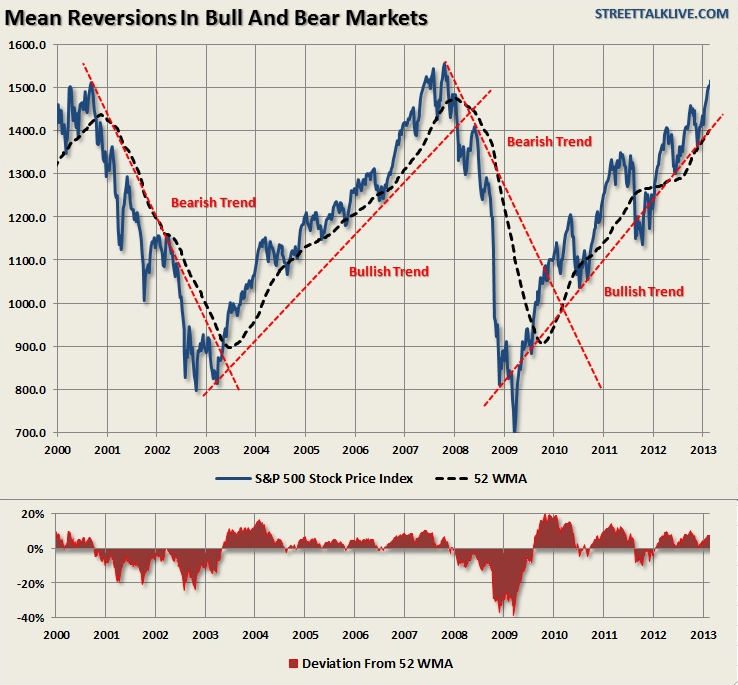
The bottom chart shows the percentage deviation of the current price of the market from the 52-week moving average. During bullish trending markets there are regular reversions to the mean which create buying opportunities. However, what is often not stated is that in order to take advantage of such buying opportunities profits should have been taken out of portfolios as deviations from the mean reached historical extremes. Conversely, in bearish trending markets, such reversions from extreme deviations should be used to sell stocks, raise cash and reduce portfolio risk rather than “panic sell” at market bottoms.
The dashed RED lines denote when the markets changed trends from positive to negative. This is the very essence of portfolio “risk” management.
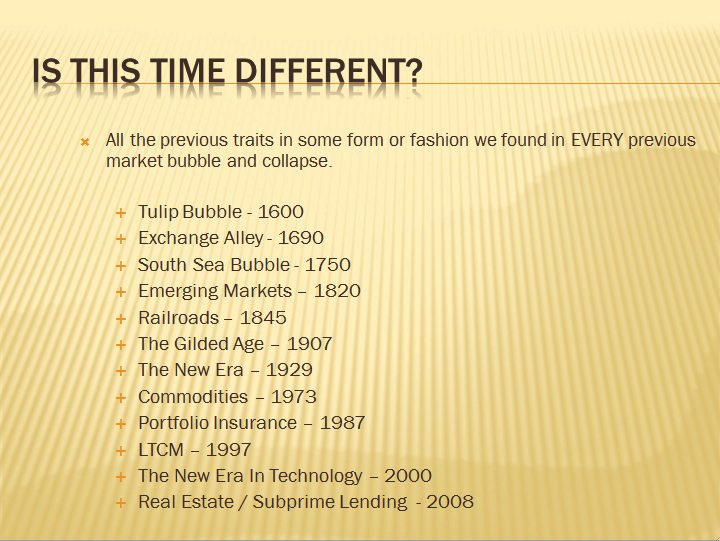
3. There are no new eras – excesses are never permanent.
There will always be some “new thing” that elicits speculative interest. These “new things”throughout history, like the “Siren’s Song,” has led many investor to their demise. In fact, over the last 500 years we have seen speculative bubbles involving everything from Tulip Bulbs to Railways, Real Estate to Technology, Emerging Markets (5 times) to Automobiles and Commodities. It is always starts the same and ends with the utterings of “This time it is different”
[The chart below is from my March 2008 seminar discussing that the next recessionary bear market was about to occur.]
As legendary investor Jesse Livermore once stated:
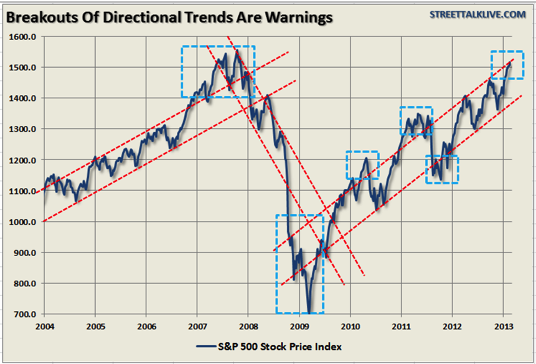
4. Exponential rapidly rising or falling markets usually go further than you think, but they do not correct by going sideways
The reality is that excesses, such as we are seeing in the market now, can indeed go much further than logic would dictate. However, these excesses, as stated above, are never worked off simply by trading sideways. Corrections are always just as brutal as the advances were exhilarating. As the chart below shows when the markets broke out of their directional trends – the corrections came soon thereafter.
5. The public buys the most at the top and the least at the bottom.
The average individual investor is most bullish at market tops and most bearish at market bottoms. This is due to investor’s emotional biases of “greed” when markets are rising and “fear” when markets are falling. Logic would dictate that the best time to invest is after a massive selloff – unfortunately this is exactly the opposite of what investors do.
The chart below shows the flow of money into equity based mutual funds.

6. Fear and greed are stronger than long-term resolve.
As stated in Rule $5 it is emotions that cloud your decisions and affect your long-term plan.
The composite index of bullish sentiment (an average of AAII and Investor’s Intelligence surveys) shows that “greed” is beginning to reach levels where markets have generally reached intermediate term peaks.
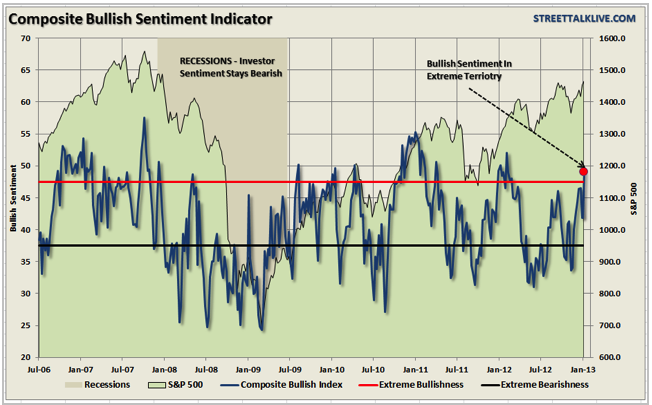
In the words of Warren Buffett:

Currently, those “people” are getting extremely greedy.
7. Markets are strongest when they are broad and weakest when they narrow to a handful of blue-chip names.
Breadth is important. A rally on narrow breadth indicates limited participation and the chances of failure are above average. The market cannot continue to rally with just a few large-caps (generals) leading the way. Small and mid-caps (troops) must also be on board to give the rally credibility. A rally that “lifts all boats” indicates far-reaching strength and increases the chances of further gains.
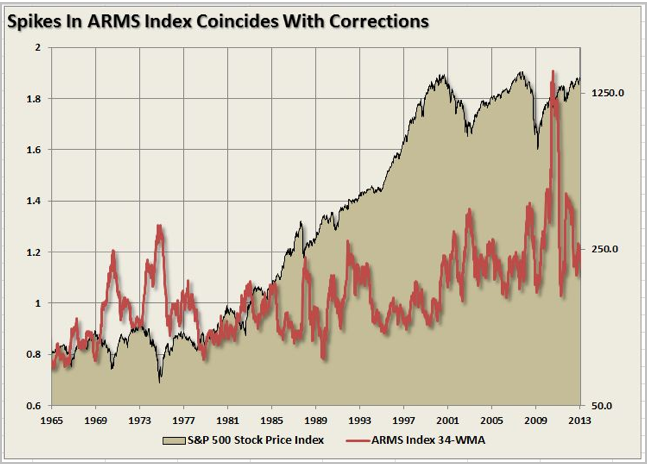
The chart above shows the ARMS Index which is a volume-based indicator that determines market strength and breadth by analyzing the relationship between advancing and declining issues and their respective volume. It is normally used as a short term trading measure of market strength. However, for longer term periods the chart shows a weekly index smoothed with a 34-week average. Spikes in the index has generally coincided with near-term market peaks.
8. Bear markets have three stages – sharp down, reflexive rebound and a drawn-out fundamental downtrend
Bear markets often start with a sharp and swift decline. After this decline, there is an oversold bounce that retraces a portion of that decline. The longer term decline then continues, at a slower and more grinding pace, as the fundamentals deteriorate. Dow Theory suggests that bear markets consists of three down legs with reflexive rebounds in between.
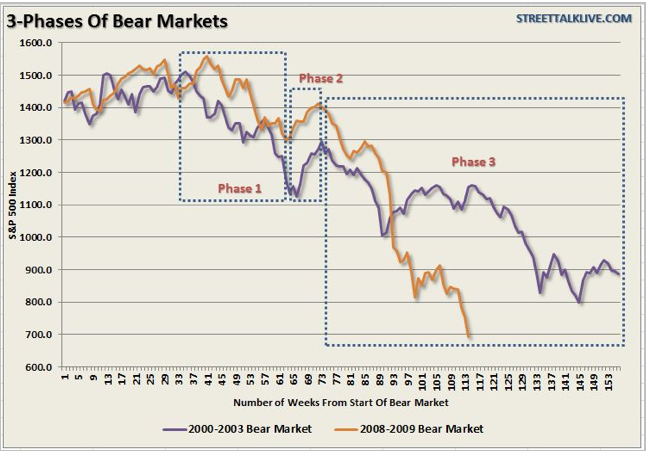
The chart above shows the stages of the last two primary cyclical bear markets. There were plenty of opportunities to sell into counter-trend rallies during the decline and reduce risk exposure.
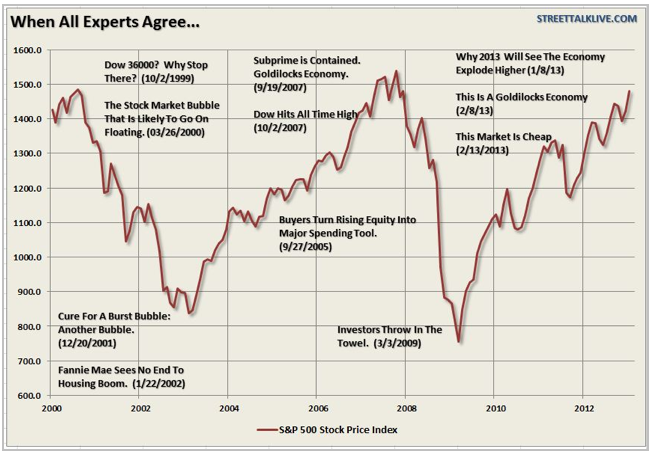
9. When all the experts and forecasts agree – something else is going to happen.
This rule fits within Bob Farrell’s contrarian nature. As Sam Stovall, the investment strategist for Standard & Poor’s once stated:

The point here is that as a contrarian investor, and along with several of the points already made within Farrell’s rule set, excesses are built by everyone being on the same side of the trade. Ultimately, when the shift in sentiment occurs – the reversion is exacerbated by the stampede going in the opposite direction
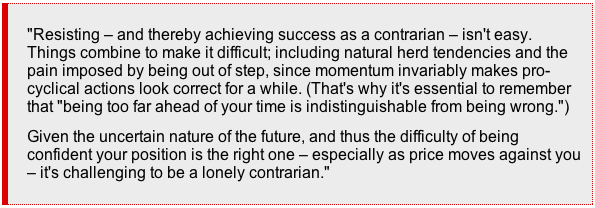
Being a contrarian can be quite difficult at times as bullishness abounds. However, it is also the secret to limiting losses and achieving long term investment success. As Howard Marks once stated:
10. Bull markets are more fun than bear markets
As stated above in Rule #5 – investors are primarily driven by emotions. As the overall markets rise – up to 90% of any individual stock’s price movement is dictated by the overall direction of the market hence the saying “a rising tide lifts all boats.”
Psychologically, as the markets rise, investors begin to believe that they are “smart”because their portfolio is going up. In reality, it is primarily more a function of “luck” rather than “intelligence” that is driving their portfolio.
Investors behave much the same way as individuals who addicted to gambling. When they are winning they believe that their success is based on their skill. However, when they began to lose, they keep gambling thinking the next “hand” will be the one that gets them back on track. Eventually – they leave the table broke.
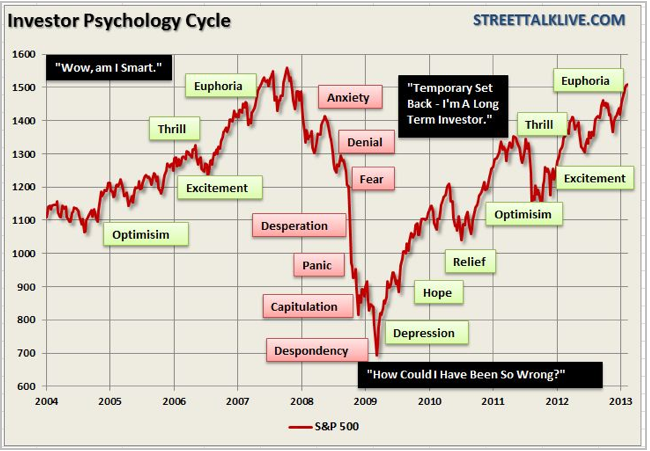
It is true that bull markets are more fun than bear markets. Bull markets elicit euphoria and feelings of psychological superiority. Bear markets bring fear, panic and depression.
What is interesting is that no matter how many times we continually repeat these “cycles” – as emotional human beings we always “hope” that somehow this “time will be different.”Unfortunately, it never is and this time won’t be either. The only questions are: when will the next bear market begin and will you be prepared for it?
Conclusions
Like all rules on Wall Street, Bob Farrell’s rules are not meant has hard and fast rules. There are always exceptions to every rule and while history never repeats exactly it does often “rhyme” very closely.
Nevertheless, these rules will benefit investors by helping them to look beyond the emotions and the headlines. Being aware of sentiment can prevent selling near the bottom and buying near the top, which often goes against our instincts.
Regardless of how many times I discuss these issues, quote successful investors, or warn of the dangers – the response from both individuals and investment professionals is always the same.

No you’re not. Yes, they do.
Individuals are long term investors only as long as the markets are rising. Despite endless warnings, repeated suggestions and outright recommendations – getting investors to sell, take profits and manage your portfolio risks is nearly a lost cause as long as the markets are rising. Unfortunately, by the time the fear, desperation or panic stages are reached it is far too late to act and I will only be able to say that I warned you.
About Lance Roberts (get a Free Membership HERE)
Finally, financial news that makes sense. Lance Roberts, the host of “StreetTalkLive”, has a unique ability to bring the complex world of economics, investing and personal financial wealth building to you in simple, easy and informative ways but also makes it entertaining to listen to at the same time. Lance brings fundamental, technical and economic perspectives, combined with a unique focus, to the day’s news helping listeners understand how it impacts their money.
After having been in the investing world for more than 25 years from private banking and investment management to private and venture capital; Lance has pretty much “been there and done that” at one point or another. His common sense approach has appealed to audiences for over a decade and continues to grow each and every week.
Making money is not hard. Learning how to keep it has been the trick. Lance’s teachings are fairly basic. Conservation of principal, a disciplined approach and living on less than you make and carrying little or no debt is the only way to build wealth. His advice is more of the “chicken soup” variety as there is no magic “black box” to build wealth – just time, hard work and sacrifice.
Lance is also the Chief Editor of the X-Report, a weekly subscriber based-newsletter that is distributed nationwide. The newsletter covers economic, political and market topics as they relate to the management portfolios. A daily financial blog, audio and video’s also keep members informed of the day’s events and how it impacts your money.
Lance’s investment strategies and knowledge have been featured on Fox 26, CNBC, Fox Business News and Fox News. He has been quoted by a litany of publications from the Wall Street Journal, Reuters, The Washington Post all the way to TheStreet.com as well as on several of the nation’s biggest financial blogs such as the Pragmatic Capitalist, Zero Hedge and Seeking Alpha.
After all it is “All About You And Your Money”

In this special edition of Outside the Box, World Money Analyst contributor Ankur Shah digs in his heels to help us all stay uphill from the slow-motion, jumbled landslide of bond yields and equity returns. Putting some solid analysis under our feet, he leads us onward and upward, dodging dislodged corporate-earnings boulders, relaying warnings shouted back by Head Sherpa Bill Gross, guiding us up the narrow but rock-solid ridge of dividend yields – and what’s that we see glimmering up there, through the swirling mists; can it be this mountain really is capped with gold? To the summit, then!
In all seriousness, Ankur gives us a somewhat technical analysis of the potential for future stock-market returns. This makes a great companion piece to the work Ed Easterling and I did a few weeks back on secular bear markets. In short, the data are not consistent with the beginning of a new secular bull market. Returns are likely to be muted over the next few years.
And how long can total corporate profits continue to stay at all-time highs in terms of GDP? That factor has always been mean-reverting. For a secular bull market to begin from here, we would have to see that percentage go yet higher in what is a low-growth world. Stranger things have happened, but do you want to bet against gravity, and without some way (like a new growth engine) to counteract it?
Ankur and the rest of the World Money Analyst team surefootedly tackle the challenges of investing in uncertain times. Their mandate is to deliver the view from the summit, expanding your vision beyond the US to encompass the entire planet. If you like the piece below, I recommend you check outWorld Money Analyst. Its global perspective will broaden your investing horizons to take in a whole new world of intelligent, risk-sensitive opportunities.
John Mauldin, Editor
Outside the Box
JohnMauldin@2000wave.com
Scrambling for Returns
Success in investing, as with life, sometimes boils down to timing. When I graduated from college in the late ‘90s, I actually had an offer to join PIMCO, which at the time was a relatively small, fixed-income manager tucked away in Newport Beach, California. I remember visiting their headquarters building, with its sweeping view of the Pacific Ocean. I could only imagine Bill Gross at his desk, gazing at the blue expanse and pondering the fate of interest rates across the developed world.
Despite my reverence for Mr. Gross, I chose a different career path, due to my youthful ignorance. I thought to myself, Why would anyone want to be a fixed-income investor when the “real” money is in equities? As we now know, I inadvertently ended up missing the tail-end of the ongoing bull market in US treasuries and caught the brunt of the secular bear market in equities that began in 2000.
We can see from the chart below that yields on US treasuries are at generational lows. As yield declines, the price of bonds rises. Given the unprecedented level of yields on US treasuries, we are, in my view, close to the end of the secular bull market in government bonds.
As Martin Pring highlighted in his book Investing in the Second Lost Decade:
At the culmination of the 1982-2000 secular bull market in stocks the Fidelity Magellan Fund (a stock fund) was the largest mutual fund in the world. In 2012, the largest mutual fund in the world is the PIMCO Total Return Fund – a bond fund!
It’s no surprise that PIMCO Total Return is the world’s largest fund, given that the secular bull market in government debt began in 1981. The question that remains for investors is, with yields so low for US treasuries, what is the upside in terms of prices, from current levels? After all, interest rates are zero-bound at the end of the day. Even Gross himself recently Tweeted, “Gross: Makin’ money with money gettin’ harder every day. When yields approach zero, all financial assets are squeezed.” If the “Bond King” is having trouble finding a decent return, what can we mere mortals hope to achieve?
If fixed-income can’t provide the inflation-adjusted returns that retirement-bound investors so desperately seek, then equities might be the key. Unfortunately, Gross doesn’t see much hope for equities, either. He recently stirred up a bit of controversy in the normally staid world of asset management with his claim that the “cult of equity” was dying, in his August, 2012 Investment Outlook. I actually agree with his original premise that by the end of the current secular bear market in equities, investors will be completely turned off from equities as an asset class. Investors are in for a rough ride, and will earn far less in the current decade than the historical 6.6% annual real return achieved over the past 100 years.
Gross’s argument had two main pillars:
1. Since 1912, equities have provided a real return of 6.6%, surpassing real GDP growth of 3.5% over the same timeframe. Essentially, he’s arguing that if stocks continue to appreciate at a faster rate than GDP, then stockholders will eventually own a disproportionate share of total wealth. Thus, expected real returns to shareholders can’t outstrip GDP growth indefinitely.
2. As a percentage of GDP, wages are near an all-time low, concurrent with corporate profits near an all-time high. Corporate profit margins will eventually mean revert.
I agree with Gross that equity investors are facing sub-par returns going forward, but I disagree with the first pillar of his argument. To explain my view, let’s start with the basics. Total annual return is calculated as follows:
Total Stock Return = [(P1 – P0) + D] / P0
P0 = Initial price
P1 = Ending price (period 1)
D = Dividends
Essentially, your total return is determined by two components – price appreciation and dividends – in any given year. Using data graciously provided for free and updated on a regular basis by Robert Shiller (http://www.econ.yale.edu/~shiller/data.htm), I calculated that annualized real returns from equities have been 6.27% since 1871 (the earliest data available). Although I use a longer timeframe than Gross, my calculation of real returns is in the same ballpark.
The key point is that over that timeframe dividends have accounted for 70% of the total annualized real return to investors. Price appreciation added the other 30%.
Price appreciation is ultimately driven by a combination of earnings growth and multiple expansion. Gross is correct when he states that earnings growth is constrained by GDP growth. Additionally, we assume that price multiples will mean revert, which has been the case historically.
Dividends, which are typically spent and not perpetually reinvested, are the main reason that equity investors have achieved real returns well above the rate of GDP growth. If investors had reinvested their dividends, we would expect that over time real returns to equity holders would have diminished as an increasing amount of capital chased after limited profit-making opportunities. Thus, there is nothing inherently illogical about real equity returns outstripping real GDP growth, if we take into consideration that dividends are usually spent and not reinvested.
The second point that Gross raises is correct. We can see in the chart below that corporate profits (after tax) as a percentage of GDP have reached an all-time high. Conversely, wages as a percentage of GDP have consistently declined since the 1970s. Gross makes the point that the division of GDP between capital, labor, and government can vary over time and greatly advantage one constituency over another. It’s clear that since the end of the 2008 recession, the corporate sector has been the winner.
However, as fund manager John Hussman has consistently stated, corporate profit margins are mean reverting and current profitability levels are unsustainable. If you agree that margins in the corporate sector have peaked, it’s unlikely that the stock market can sustain rising price multiples.
Analysts who view current valuations as cheap on a forward operating earnings basis are making a huge assumption that current profit margins are sustainable. However, analysts who take a normalized earnings approach to valuation will inevitably come to the opposite conclusion. As Hussman observed in a weekly market comment:
“Profit margins are also highly cyclical over time. The wide margins at present are partly the result of deficit spending amounting to more than 8% of GDP – where government transfer payments are still holding up nearly 20% of total consumer spending, and partly the result of foreign labor outsourcing (directly, and also indirectly through imported intermediate goods) which has held down wage and salary payouts. Indeed, the ratio of corporate profits to GDP is now close to 70% above its long-term norm.”
In addition to the potential for declining margins, valuations as measured by the cyclically adjusted P/E ratio (CAPE) are still stretched. Earnings – the denominator in the CAPE ratio – are calculated by taking an average of the past 10 years. By using an average, we normalize for changes in profitability that occur due to the business cycle. Unfortunately, the CAPE ratio doesn’t tell you where the market will head in the next quarter or year, but is an exceptionally useful tool when calculating prospective returns over a long timeframe, such as a decade.
We’re nowhere near the peak levels achieved during the technology boom, but current levels still exceed the historical average of 16.5x, shown in the next chart.
The chart also shows that the market was briefly cheap on a normalized basis in March 2009. Despite the protestations of some analysts, we are not in a new secular bull market for equities. Secular bull markets begin when the CAPE ratio is in the single digits.
What type of return from US equities can we expect going forward, given the current CAPE reading of 21.1x? We can calculate prospective long-term annual total return on the S&P 500 by utilizing the following formula derived by John Hussman:
Long Term Total Return = (1 + g)(Future PE / Current PE)^(1/T) – 1 + dividend yield (Current PE/Future PE + 1) / 2
g = Prospective growth rate of earnings
The equation simply forecasts the two components of total return that, as I noted earlier, are price appreciation and dividend yield. Using the data provided by Shiller, I calculated a long-term historical nominal earnings growth rate of 3.8%. Then, using the current 2.8% S&P dividend yield, I calculated prospective nominal returns for various future CAPE ratios, shown in the next table.
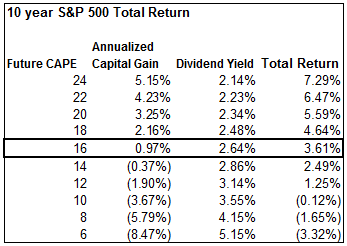 We can see from the table that if the CAPE ratio reverted to slightly below its historical mean of 16.5x, it would result in an annualized prospective return on the S&P 500 of 3.61% over the next ten years. And if the market were to de-rate down to a single-digit CAPE ratio, investors could expect negative returns, based on current valuation levels.
Keep in mind that total return is calculated in nominal terms. So, depending on your inflation expectations, real returns over the next 10 years will be nowhere near historical levels unless earnings can grow well above historical averages or investors are willing to re-rate the market from already-lofty valuations. I have no doubt that prospective returns will eventually improve. Unfortunately, that will entail a significantly lower level on the S&P 500.
Even Bill Gross himself warned about the current valuation levels of stocks and bonds when he tweeted the following back in October: “Gross: Stock and bond managers today must be alchemists: turn lead into gold. NOT likely. Too much lead (bubbled assets).”
With both US treasuries and equities offering poor future returns, where can an investor find adequate inflation-adjusted returns?
With the announcement of QE4, the likelihood of significant inflation surfacing in the back-half of the decade has definitely increased. The best options for investors, in my view, are quality domestic and international equities with decent dividend yields, and precious metals. I may have missed the equity bubble of the late ‘90s and the current bond bubble, but the precious metals bubble is just getting started. I don’t plan on missing this one.
 Ankur Shah is the founder of the Value Investing India Report, a leading independent, value-oriented journal of the Indian financial markets. Ankur has more than eight years of equity research experience covering emerging markets, with a focus on Southeast Asia. He has worked as both a buy-side investment analyst for a global long/short equity hedge fund and as a sell-side analyst for an emerging-markets investment bank. Ankur is a graduate of Harvard Business School. You can learn more about his latest views on global markets at Value Investing India Report, or follow him on Twitter.
 Daily turmoil on a global scale is giving business leaders and investors plenty of reasons to stay hunkered down as they confront huge challenges in the here and now. Spreading sovereign debt woes, volatile markets, unstable currencies, political gridlock and stalled growth plague the big developed economies. Meanwhile, China, India and other rapidly emerging economies are flexing their strength as they adjust to the phenomenal growth that has been the biggest economic story of the past two decades.
In the conventional view, the current turbulence portends deep, enduring structural shifts that will set the business agenda for the foreseeable future. We fully expect macroeconomic shocks over the coming decade, with discontinuities that will shape the options companies have to adapt and grow.
Yet behind the dire headlines and day-to-day frictions of the marketplace, eight trillion-dollar macro trends are at work in the global economy. The pursuit by businesses and governments of the macro trends’ growth potential will touch many corners of the globe.
Europe, Japan and the US certainly face an extended period of economic turbulence and slow growth, particularly in the first half of the decade. But as we will see, half of the macro trends affect both emerging and advanced economies. Thus, while we embrace the exciting opportunities in emerging markets, we also see opportunities where many commentators see none right now—in the home markets of many of the world’s leading businesses.
….read it all HERE

Lately we’ve been writing about the negative correlation between the equity market and the precious metals market. This phenomenon has been in place since summer 2011 and has re emerged in the past few months. Since November 23, the S&P 500 is up 8% while the gold shares are down 14%, Silver has lost 11% and Gold 7%. For those who have studied history this should not come as a total surprise. From 1972 to 1977 and November 2000 to July 2002, precious metals and the equity market trended in opposite directions. We’ve postulated that precious metals and the mining shares won’t begin a new bull phase until the cyclical bull market in US equities ends. We don’t expect that to happen immediately but there are some important signals beneath the surface (with the safe-havens) that we should direct our attention to.
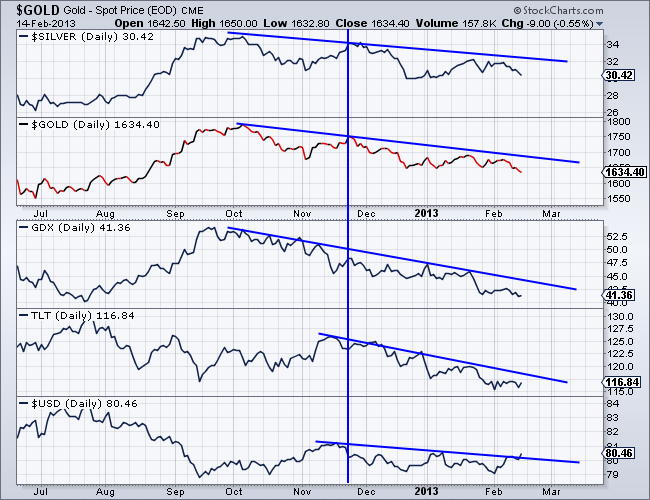
First, let’s take a look at the recent activity in a number of markets. From top to bottom we plot Silver, Gold, GDX, TLT and the US Dollar. The first three markets have been in a downtrend since the end of September. Meanwhile, TLT and the buck began their downtrends in the middle of November. It appears that these markets have been tightly connected since the end of November. That is the bigger picture. The short-term term picture shows the US$ potentially breaking out and bonds not breaking to a new low.
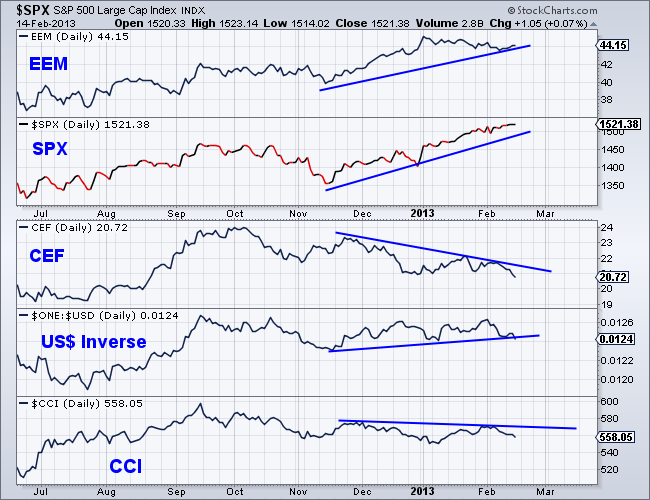
Meanwhile, we should take note of the action in some other markets since late November. Both emerging markets (EEM) and the S&P 500 have advanced, but EEM is slowing down. Commodities failed to make a new high even as the US$ made a marginal low. As we can see, the inverse of the buck is threatening to breakdown and realign with commodities and CEF, a fund which is half Gold and half Silver. The rally since November is now seeing a negative divergence as emerging markets have not made a new high and the US Dollar could be breaking out.
The bottom line is the action in precious metals, commodities and the US$ is signaling a warning for the equity market. The bond market needs to confirm this warning and if it does it could be the catalyst for a sell-off in equities. Keep in mind, the S&P 500 is approaching strong long-term resistance while in a state of euphoric sentiment. If you don’t believe that, check the recent sentiment surveys and ignore those who don’t provide hard data. By the way, public opinion on bonds (fromsentimentrader.com), is only 14% bulls! Sounds like we should sell bonds and buy stocks, right?
Meanwhile, the precious metals appear likely to test major support in the coming days and weeks. There will be some more pain but things are setting up perfectly for the next cyclical bull market. Gold is positioning itself contrary to risk-on assets. It has detached from the stock market and that is a good thing. There will likely be a transition period as precious metals find a bottom and the equity market reaches its peak. For now, look to buy precious metals if they reach an extreme oversold condition next week. As for the gold stocks, if you’d be interested in professional guidance in uncovering the producers and explorers poised for big gains then we invite you to learn more about our service.
Good Luck!
Jordan Roy-Byrne, CMT
Jordan@TheDailyGold.com
 Almost 90 Years Old & The Godfather of Newsletter Writers, Richard Russell writes:
“The central banks of the world are on a mission to keep the world economy going. A great bull market started in 1980. It ended in 2007, a period of 27 years. As such, it was, in duration, the longest bull market in US history. A bear market started in October 2007.”
“Bear markets tend to last from one-half to one-third as long as the preceding bull market. On that basis, the bear market that started in 2007 might be expected to continue for at least nine years (one-third of 27) or until 2016. However, the Central banks, and certainly President Obama, have attempted to halt the bear market and thus continue the prosperity we have enjoyed ever since World War II.
As proof of the Fed’s success, I would expect both the D-J Transportation and Industrial Averages to advance to new highs, thereby signaling that the tide had reversed to bullish (a bull market). According to classic Dow Theory, the primary trend of the market cannot be manipulated. Further, according to classic Dow Theory, the movements of one Average, unconfirmed by the other Average, are useless as guides to direction, and are more than likely to prove deceptive.
Sundry Observations — From what I see, Americans are still spending and partying as if nothing has changed. Here in Southern California, the restaurants are full, and this is especially true of the breakfast places (in my opinion, the height of free-spending is going to a restaurant for an expensive breakfast when you could have had an inexpensive breakfast at home).
.….read more & view 2 charts HERE
Ed Note: 2 Fabulous Articles by the 89 year Old Russell:
Russell began publishing Dow Theory Letters in 1958, and he has been writing the Letters ever since (never once having skipped a Letter). Dow Theory Letters is the oldest service continuously written by one person in the business.
Russell gained wide recognition via a series of over 30 Dow Theory and technical articles that he wrote for Barron’s during the late-’50s through the ’90s. Through Barron’s and via word of mouth, he gained a wide following. Russell was the first (in 1960) to recommend gold stocks. He called the top of the 1949-’66 bull market. And almost to the day he called the bottom of the great 1972-’74 bear market, and the beginning of the great bull market which started in December 1974.
The Letters, published every three weeks, cover the US stock market, foreign markets, bonds, precious metals, commodities, economics –plus Russell’s widely-followed comments and observations and stock market philosophy.
In 1989 Russell took over Julian Snyder’s well-known advisory service, “International Moneyline”, a service which Mr. Synder ran from Switzerland. Then, in 1998 Russell took over the Zweig Forecast from famed market analyst, Martin Zweig. Russell has written articles and been quoted in such publications as Bloomberg magazine, Barron’s, Time, Newsweek, Money Magazine, the Wall Street Journal, the New York Times, Reuters, and others. Subscribers to Dow Theory Letters number over 12,000, hailing from all 50 states and dozens of overseas counties.
A native New Yorker (born in 1924) Russell has lived through depressions and booms, through good times and bad, through war and peace. He was educated at Rutgers and received his BA at NYU. Russell flew as a combat bombardier on B-25 Mitchell Bombers with the 12th Air Force during World War II.
One of the favorite features of the Letter is Russell’s daily Primary Trend Index (PTI), which is a proprietary index which has been included in the Letters since 1971. The PTI has been an amazingly accurate and useful guide to the trend of the market, and it often actually differs with Russell’s opinions. But Russell always defers to his PTI. Says Russell, “The PTI is a lot smarter than I am. It’s a great ego-deflator, as far as I’m concerned, and I’ve learned never to fight it.”
Letters are published and mailed every three weeks. We offer a TRIAL (two consecutive up-to-date issues) for $1.00 (same price that was originally charged in 1958). Trials, please one time only. Mail your $1.00 check to: Dow Theory Letters, PO Box 1759, La Jolla, CA 92038 (annual cost of a subscription is $300, tax deductible if ordered through your business).
IMPORTANT: As an added plus for subscribers, the latest Primary Trend Index (PTI) figure for the day will be posted on our web site — posting will take place a few hours after the close of the market. Also included will be Russell’s comments and observations on the day’s action along with critical market data. Each subscriber will be issued a private user name and password for entrance to the members area of the website.
Investors Intelligence is the organization that monitors almost ALL market letters and then releases their widely-followed “percentage of bullish or bearish advisory services.” This is what Investors Intelligence says about Richard Russell’s Dow Theory Letters: “Richard Russell is by far the most interesting writer of all the services we get.” Feb. 19, 1999.
Below are two of the most widely read articles published by Dow Theory Letters over the past 40 years. Request for these pieces have been received from dozens of organizations. Click on the titles to read the articles.

-
I know Mike is a very solid investor and respect his opinions very much. So if he says pay attention to this or that - I will.
~ Dale G.
-
I've started managing my own investments so view Michael's site as a one-stop shop from which to get information and perspectives.
~ Dave E.
-
Michael offers easy reading, honest, common sense information that anyone can use in a practical manner.
~ der_al.
-
A sane voice in a scrambled investment world.
~ Ed R.
Inside Edge Pro Contributors

Greg Weldon

Josef Schachter

Tyler Bollhorn

Ryan Irvine

Paul Beattie

Martin Straith

Patrick Ceresna

Mark Leibovit

James Thorne

Victor Adair