
Personal Finance
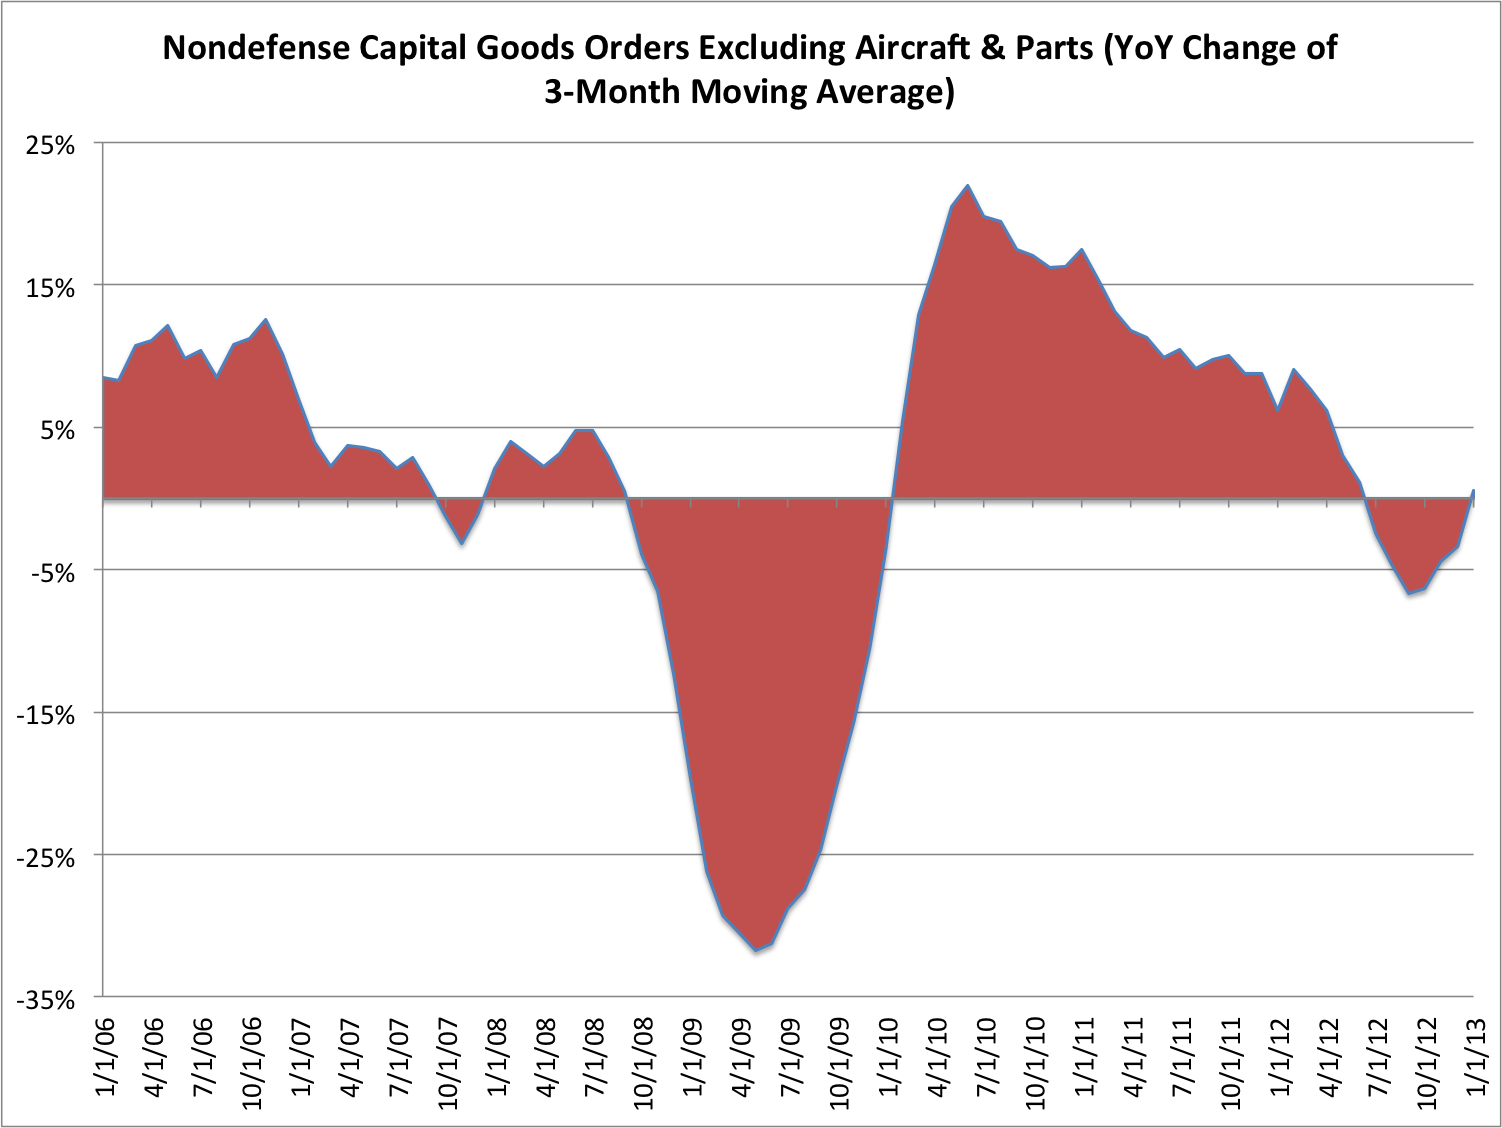
David Rosenberg’s has changed his mind! The economist with Gluskin Sheff’s recession indicator has gone positve and Rosenberg thinks that this Core Capex indicator (the three-month moving average of nondefense capital goods) surged and that is the best indicator that business is finally spending.
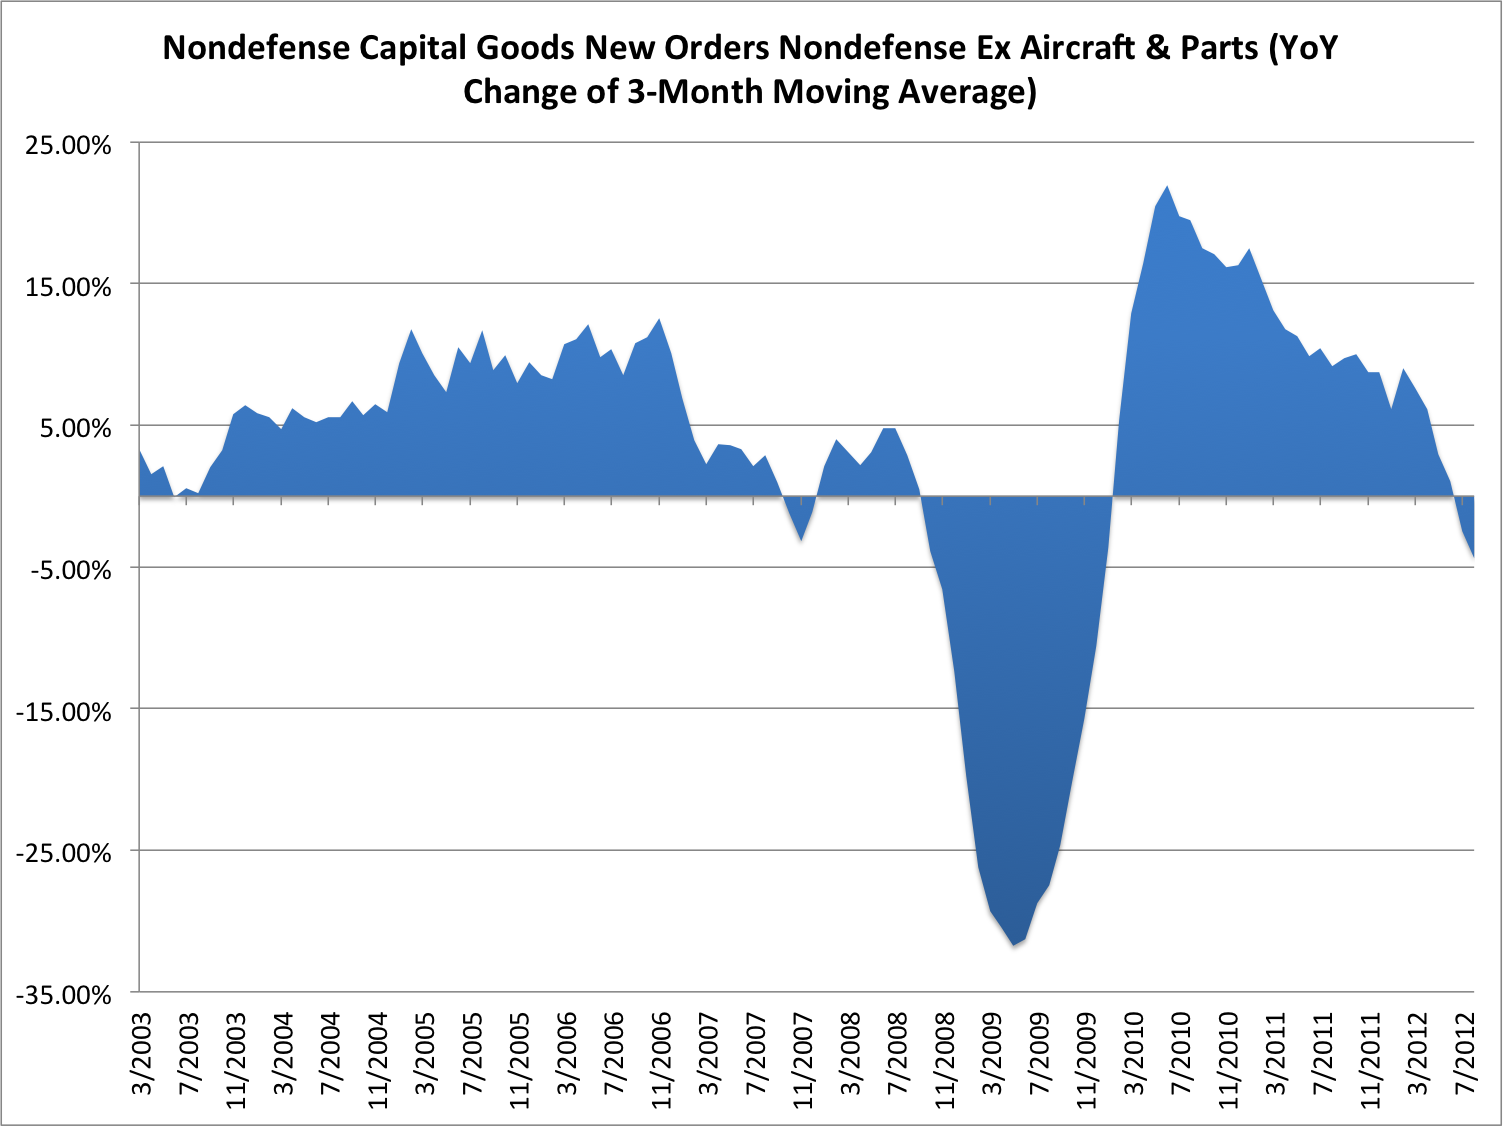
This change in the Core Capes differs significantly (trend is your friend/) from the one he posted back in October 2012 when he wrote the artice: “Here’s Your Big Red Flag That We Could Be Heading For Recession”. Chart below is from that article & there is an article below the chart- Ed
With these changes afoot David has now written an article today:
Why cash is your least safe bet
“There’s an old saying that may be glib to some but is critical nonetheless, and it is that every bull market needs a wall of worry to climb.
So when we go back to where we were exactly a year ago, there were all sorts of risks on the worry list. Was Greece going to leave the euro area, or even Germany for that matter? Well, we know the answer to that.”
“This then brings me to my very last point, which is what I think was a critical inflection point when the Fed said in its December post-meeting press release that it will not budge from its 0% policy rate until the U.S. unemployment rate drops to 6.5%. It is currently around 8%.”
…..much more HERE
David Rosenberg is chief economist and strategist at Gluskin Sheff + Associates Inc. and one of FP Magazine’s 25 Most Influential People in Canada.

A cooling trend that has hovered over the real estate market for more than a year as the Teranet-National Bank index of Canadian housing prices continues to show.
….read more HERE
IMF says Canada’s housing market still overvalued, warns more intervention may be needed
“Our analysis suggests an overvaluation in real terms of about 10% at a national level, although with significant variations across provinces,” said Roberto Cardarelli, IMF mission chief for Canada, in comments provided as a complement to the technical report.
….read more HERE
Home costs take slightly smaller bite of household budget, but Vancouver still least affordable market
A new report says the cost of home ownership in most major Canadian markets was down slightly in the last three months of 2012 but notes that pressure on household budgets remains somewhat above the historical average.
“Home ownership costs came down for a second consecutive quarter as a share of household income thanks primarily to small declines in mortgage rates and home prices in several markets across the country,” the RBC report says.
…..read more HERE
Interest Rates & Mortgage Rates at Lows
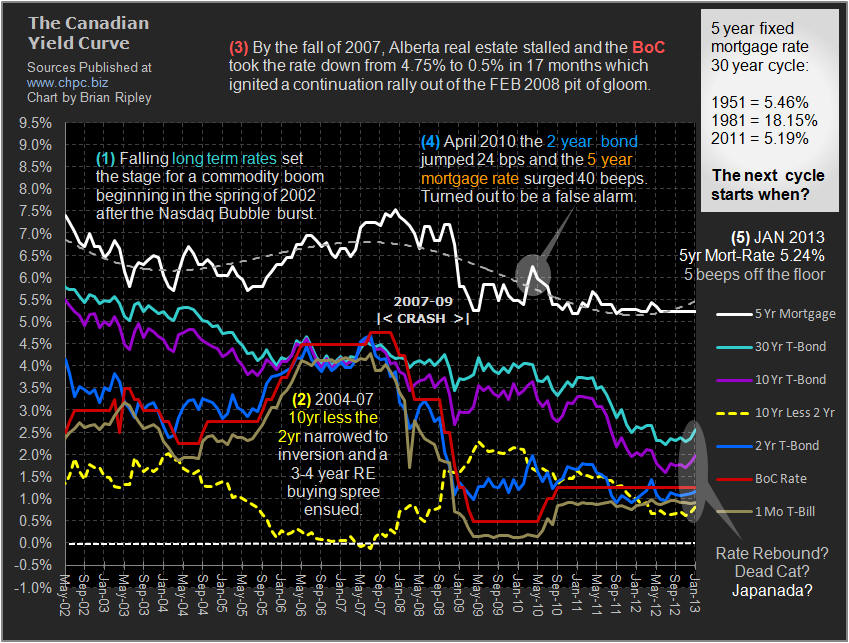
The chart above shows that in Janaury 2013 the spread between the Bank of Canada rate and the residential 5 year fixed mortgage remained unchanged as banks advertised the 5 year fixed mortgage rate at 5.24% and the BoC held its rate at 1.25% continuing to fix the cost of money and distorting market prices. The December CPI print remained at 0.8% so the short real rate also remained at 0.5%. Penny pinching ‘conservative‘ Canadian martyrs have been watching their savings evaporate while their fearless brethren have been all in for the big capital gain real estate flip. The Government policy of urging Canadians to borrow at low rates and spend at high cost (rather than promoting skill acquisition to become productive) has been a tax on savers and a short sighted policy; globally everyone is doing it, and it is not ending well. Look at Ireland, Spain and California (the list goes on). “ZIRP” could be the new normal and there is really no rush or panic to take on debt when asset prices are falling and rates remain boot suppressed. Notice how the TSX RE Index is correlating with the spread between the BoC and the 5 Year retail mortgage rate. If the spread between the BoC Rate and the 5 yr Mort-Rate widens as it did from April 2007 to Dec 2008, will the TSX Real Estate Index drop? Tension is mounting in the coiled spring as “real” rates continue to rise.
…..11 more Read Estate Charts HERE

 Registered retirement savings plans (RRSPs) are one of the most popular investment vehicles for Canadians. Contributing to an RRSP is one way to reduce the amount you owe at tax time.
March 1, 2013, is the last day you can contribute to an RRSP for the 2012 tax year.
The amount you can contribute to your RRSPs each year without tax implications is determined by your RRSP deduction limit, or contribution room, which can be found on your 2011 notice of assessment.
The Tax-Free Savings Account (TFSA) allows Canadians, age 18 and over, to set money aside tax-free throughout their lifetime. Each calendar year, you can contribute up to the TFSA dollar limit for the year, plus any unused TFSA contribution room from the previous year, and the amount you withdrew the year before.
The annual TFSA dollar limit for 2013 is $5,500.
All income earned and withdrawals from a TFSA are generally tax-free. Plus, having a TFSA does not impact federal benefits and credits. It’s a great way to save for short and long-term goals.
Avoid the Annual Mistake!
Every year around this time, our phones begin to ring off the hook. With RRSP deadlines and new TFSA room, investors become fixated on the investment industry for a few months. This is a mistake.
Don’t get me wrong. It’s great to be in demand and busy. And for the average investor, we are pleased with the level of engagement we see at this time of year. But the mistake is trying to cram a year or more worth of investment decisions into a week or even a day around RRSP/TFSA season.
Contributions are made and securities are purchased all within a rushed day or so. Then the investor exhales and goes back to the regular routine with the occasional gander at the portfolio through the remainder of the year. Use this strategy at your peril!
By all means, make the appropriate contributions to your RRSP if its suits your investment situation. We are big supporters of TFSAs and encourage investors to pair a self-directed TFSA with our annual research service to build their own Small-Cap Portfolio. What we do not advise are contributions followed by immediate buys to create an “instant portfolio.”
Why? We advocate creating an 8-12 stock portfolio with profitable, growing, and value priced small-cap stocks for the growth area of your portfolio. In this context, there are two major problems with investors who myopically focus on RRSP season.
Number one is that creating a portfolio at one set time immediately locks you into to that point in a market cycle. If it is near a top and a meaningful correction follows, it can take years to recover. Number two is that, quite frankly, it is difficult in most markets to find 10 great stocks to buy at any given time.
It’s all about quality over quantity and often investing success is as much about the stocks you don’t buy as it is about the ones you do. We encourage Canadians to consult with their financial advisors and make the appropriate contribution decisions this month. But remember that those funds do not all have to be deployed the day, week, or month after you make those contributions.
Be patient and create the small-cap growth area of your portfolio over one to three years and review and rebalance over that time. Given the fact that at 18.86 and 17.09 times earnings respectively, the S&P/TSX Composite Index and the S&P 500 are trading above historical P/E multiples, it is likely time to leave some powder dry to employ in the event of a pullback during 2013.
KeyStone’s Latest Reports Section
An interesting/funny/historical manner just how much tax you actually pay, once you factor in Direct Taxes, Indirect Taxes, excises, tarrifs, duties, business compliance costs, failed Green schemes, industry subsidies, carbon taxes, gas taxes, liquor taxes, provincial taxes, municipal taxes, property taxes, recycling taxes, CCP, Employment Insurance deductions, Government permits, fishing licenses………. and there is so much more -Ed

The World Economic Forum (WEF), during its Davos jaunt, created an intriguing set of 50 ‘global risks’. Of course these are from the perspective of the elitest of the elite but with more than 1000 respondents, the results seem all-encompassing. The global risk that respondents rated most likely to manifest over the next 10 years is severe income disparity, while the risk rated as having the highest impact if it were to manifest is major systemic financial failure. There are also two risks appearing in the top five of both impact and likelihood – chronic fiscal imbalances and water supply crisis. The report covers five key categories of ‘risk’ – which we will be posting on in the next few days – Economic, Environmental, Societal, Geopolitical, and Technological. In this first post we expose the 50 risks by magnitude and probability, how they have evolved over the past few years, and the importance of their inter-connectivity.
Click image for very large chart. The most ‘worrying’ risks are up and to the right (higher probability and high impact)… Chronic Fiscal Imbalances tops the chart along with Sever Income Disparity.
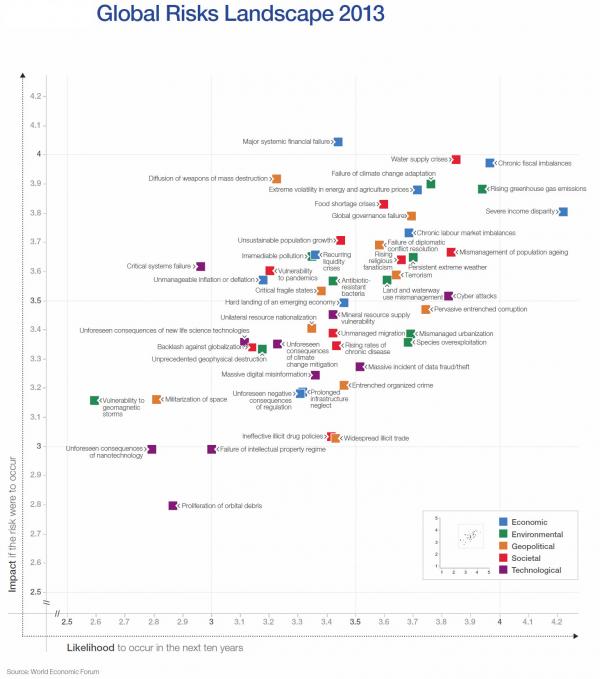
Ed Note: This article introduces 3 Risk Cases & 4 Charts, like this one posted above, which can be enlarged. Just go HERE to read and view the entire report.

-
I know Mike is a very solid investor and respect his opinions very much. So if he says pay attention to this or that - I will.
~ Dale G.
-
I've started managing my own investments so view Michael's site as a one-stop shop from which to get information and perspectives.
~ Dave E.
-
Michael offers easy reading, honest, common sense information that anyone can use in a practical manner.
~ der_al.
-
A sane voice in a scrambled investment world.
~ Ed R.
Inside Edge Pro Contributors

Greg Weldon

Josef Schachter

Tyler Bollhorn

Ryan Irvine

Paul Beattie

Martin Straith

Patrick Ceresna

Mark Leibovit

James Thorne

Victor Adair