
Personal Finance
 Thomas Jefferson was opposed to a “national debt.” He thought it was immoral that one generation should spend on credit, forcing the next generation to pay the bill.
Jefferson knew what a burden debt could be — especially when it is debt for spending he didn’t enjoy himself. He had inherited debts from his father-in-law. You’ve heard of “something for nothing”? On the flip side is a second condition as disagreeable as the first is pleasant: nothing for something.
“Nothing for something” describes the financial situation of America’s youth. If things go according to plan, they will pay a large portion of their incomes (if they have incomes) to pay for social welfare “benefits” that they will never enjoy themselves.
Professor Laurence Kotlikoff of Boston University puts the total of U.S. government debt and unfunded pension and healthcare liabilities at $222 trillion. The biggest part of that money will be spent on the baby boomer generation… as it heads into retirement homes, nursing homes and hospitals. This is such a huge sum that it cannot be paid. But the burden of trying to pay it (and not succeeding) will fall heavily on younger generations.
Large debts also retard growth. This is the conclusion of professors Rogoff and Reinhart inThis Time It’s Different — their study of 800 years of financial folly. Much of current output must be used to pay for past consumption.
That is part of the reason that today’s growth rates are only about half of those in the 1960s and 1970s. Low growth means fewer new job opportunities. Those that do become available are generally at lower salaries. The real growth that doesn’t happen leads to the real jobs that will not be created and to the real careers your children and grandchildren may never have.
High debt levels also mean higher taxes. Taxes tend to be levied on earnings, not on pensions and healthcare consumption. You will see later in this week’s Outlook an estimate for how high taxes on young people would have to go (if it were possible) to finance this debt: about 80%.
Today, I take up the cause of our children and grandchildren. In the modern vernacular: They’re screwed.
Our job — and the job of the family offices we run — is to unscrew them. First, by trying to understand how the system works. And second, by setting up parallel or alternative systems of our own that help them protect themselves.
Nothing for Something
Let’s begin with the big picture. The economies of the U.S. and other modern, developed social welfare nations are based on several conceits and delusions.
Serious observers keep saying that if we continue doing what we’re doing bad things will happen “sooner or later.” We never know when sooner or later will get here. But it’s a fair bet that it will come during our children’s and grandchildren’s lives.
Remember Herb Stein’s law: Things we all know can’t last forever will come to a halt sometime. Most likely, it will be during the working careers of our children and grandchildren.
For example, the credit expansion that began after World War II had to end sooner or later. For the private sector, it ended in 2007. It almost ended, too, for many governments — such as Japan, Greece, Spain, California and others.
But large nations with their own printing presses are still going at it — with public debt-to-GDP ratios reaching up over 200% already. (If you included the aforementioned unfunded pension and health obligations, the ratio for the U.S. is already at nearly 1,400% and growing 20 times faster.)
The system of indirectly funding deficits through money printing (QE), while holding interest rates at the zero bound, will also have to end sooner or later. More alarmingly, the current system of fiat money is one for the record books. None has ever lasted this long. But it, too, will go away sooner or later.
So too will the system of intergenerational wealth transfers to fund health and retirement benefits. This system, developed in the 19th century, and brought into wide service in the 20th, was an illusion from the get-go.
In a stable society, the contributors — in the aggregate — can never get out of the system what they put in. Bureaucratically managed programs are too wasteful and beset by too much fraud. And it doesn’t really make sense for people to go along with a system where they get less out of it than they put in.
Nevertheless, there was — and still is — wide support for these programs. Why? Because people still expect to get “something for nothing” — or at least more than they put in. That has been the experience of the last 100 years.
Citizens were able to get more than they put in because the following generation was always bigger and richer — until now. Now, in the U.S., Japan and most of Europe, birthrates are so low that the native-born population is falling. And, for the first time in U.S. history, the next generation may actually be poorer than we are.
In other words, our children and grandchildren are getting a bum deal in more ways than one.
The short version of this story is simple: Old people vote. Politicians found they could be bribed. Promise them something they couldn’t get by honest labor — someone else’s money — and you are a shoo-in for elective office.
Year after year, the promises got to be more and more costly. How high have the promises gone? The median retiree has a total of about $120,000 in net savings. But he’ll consume about $275,000 worth of healthcare services before he finally adjourns. Who will pay the difference? Who bears the burden of this unfunded liability?
The Social Security Fund — which was the source of the phony “surpluses” of the Clinton era — is now in deficit. This year, it will pay out about $100 billion more than it takes in. That’s $100 billion more to retirees than working people contribute in Social Security tax payments. And the baby boomers have only just begun to retire!
Old people vote for higher Social Security payments. They vote for more healthcare. They vote for pills, wheelchair access and senior discounts. They vote for spending in the here and now… and a few brief tomorrows. As to the long term, it can take care of itself…
Editor’s note: I’ll share with you Part II of this report tomorrow. And here’s that link again, if you are interested in hearing more from Dad about preserving and growing family wealth.

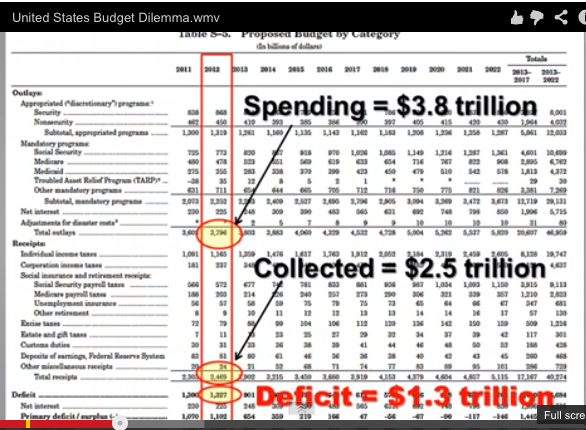
What a simple explanation of the absolute financial dilemma America is enduring and will endure. This is a non-partisan video produced by an accountant, Hal Mason, retired after 27 years with IBM. He looks at the budget, its revenues and expenses, and very simply illustrates the problem.
This guy does it in a couple minutes. It is very important that every Canadian to understand that “when” the US sinks out of sight just as the Titanic did…..Canada and Canadians will sufer massive consequences. d
Click on the video below to quickly (5:37) & efficiently gain the scope of the problem:
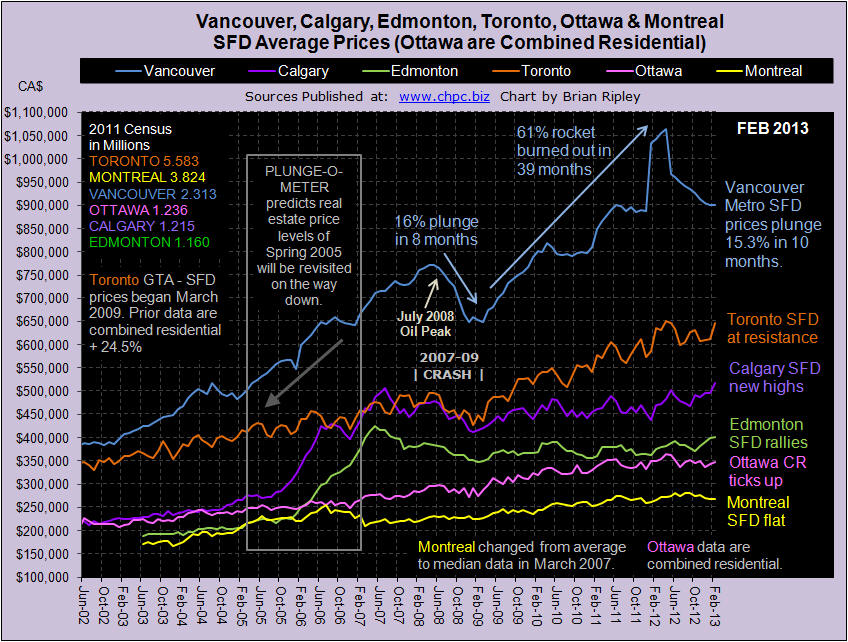
At the turn of the year I gave the trophy to Alberta as the best place to get a paycheck, and to Calgary as the best comeback in real estate. Two months later after peaking 68 months ago (June 2007), Calgary average SFD prices have broken out with a new record high price backed up by townhouse prices also busting out to new highs.
The momentum chart has Calgary SFD prices heading towards Extreme Enthusiasm territory with a Y/Y price increase at 10.3%. I have now set up a separate chart to track Calgary SFD, Townhouse and Condo average prices.
Summary of Housing Price Changes for Major Canadian Cities February 2013
Calgary and Toronto pushed average townhouse prices to new highs and SFDs in Calgary reached a new peak price not seen since June 2007.
VANCOUVER average single family detached prices in February 2013 stopped falling for the first time in ten months and ticked up 0.1% M/M but are 13.6% down Y/Y and remain 15.3% (or $163,300) below their peak set back in April 2012. This compares to the 2007-09 crash of 15.4% and a loss of $163,800 (Vancouver Chart). At the “low end” buyers stepped in and townhouse and condo apartments ticked up 1.2% and 06% M/M. Combined residential sales zoomed 33% M/M, but are down nearly 30% Y/Y even with the supply of listings down 13.2% Y/Y (Scorecard).
Now that you have the February data, where do you think Vancouver SFD prices will be one year hence? VOTE HERE.
CALGARY average detached house prices in February 2013 busted out to new highs as did townhouse prices. I have added a new dedicated Calgary Chart to track this market. Combined residential sales are up 39.1% M/M and only down 1.2% Y/Y (Scorecard). On themomentum chart, SFD prices are gushing up towards extreme enthusiasm well off the flat line of a year ago.
The sentiment in Calgary is the least bearish of the 3 markets polled; almost as many readers think prices will remain where they are as readers who think they will drop 20%. What’s your opinion? VOTE HERE.
EDMONTON average detached house prices in February 2013 also rallied with Calgary and added another 0.3% M/M gain (Canada Chart). Combined residential prices were up 4.3% M/M with average condo prices zooming 7.3% M/M. Combined residential sales and inventory were both up double digits M/M but are also both down double digits Y/Y (Scorecard). The record high SFD prices of May 2007 are now only 5.9% away on this latest surge (Plunge-O-Meter).
TORONTO average detached house prices for the GTA in February 2013 zoomed 5.8% M/M while townhouse prices broke out to a new record high (Toronto Housing Chart). SFD prices are now only 0.4% below their April 2012 peak and the only thing holding back new highs is a growing inventory (Scorecard) and slumping momentum. The gap between Vancouver and Toronto housing prices (Vancouver vs Toronto) is narrowing.
Polled sentiment continues to suggest that prices will be down another 20% in 12 months. What do you think? VOTE HERE.
OTTAWA average detached house prices are not available, instead the chart on this site reflects Ottawa’s average combined residential prices. OREB’s report is sparse and opaque and the CMHC, records for Ottawa inventory remain one month lagging. In February 2013 Ottawa combined residential prices ticked up only 1.3% M/M on a 51.8% M/M sales surge, but sales are still down 9.4% Y/Y (Scorecard). It’s been 10 months since prices peaked in Ottawa and they remain 4.8% below the highs (Plunge-O-Meter).
MONTREAL median (not average) detached house prices in January 2013 (I WILL POST FEBRUARY DATA WHEN I GET IT; MONTREAL IS USUALLY LATE) dropped another 1.1% M/M and remain at the lower end of the price range 4.3% below the all time high price set in June 2012 (Canada Chart). Prices are floating on sales resistance (Scorecard) with combined residential sales 14.9% below last year. In the 2011 Census, Montreal added 6.4% more dwelling units while only adding 5.2% more people. There is no shortage of housing, but there is a shortage of earnings; the Province of Quebec ranks 6th in Canada’s 10 provinces for earnings.
….much more below:
13 Charts on housing and related markets
Plunge-O-Meter and Canadian Earnings
Demographia and Census data.

We’ve all heard of the usual ways people try to save or generate more money to pay off their debts: cutting out the daily latte, brown-bagging lunch, getting a weekend job, or starting a side business selling clothing, toys, or beauty products.
But some people go to extremes to find ways to accelerate their debt payments and get rid of the IOUs once and for all.
We asked credit counselors across the country to share some of the more dramatic approaches their clients have used to get out of debt.
 Become an eBay black belt. While many people sell items on eBay, not all of them are as resourceful as one client who went to the Consumer Credit Counseling Services of Central Oklahoma in Bethany, Okla., and was put on a debt management plan to pay off about $30,000 in debt over four years.
The woman began to send in extra money — on a frequent basis — to pay off her debt. Turns out she was earning that extra money through eBay.
“She told me that she found a way to inexpensively buy basic items like cookware and underwear, and was able to sell them on eBay to people who lived in really rural, remote areas,” says Cristy Cash, director of counseling with CCCS of Central Oklahoma. “She said most of her clients had P.O. boxes in places like Alaska and Canada. She was doing so well that she paid off her debt in full in two years instead of four.”
….other 4 HERE

Warren Buffet’s Compounded Annual Gain from 1965-2012 is 19.7%, a figure that makes his annual letter to Berkshire Hathaway Shareholders compelling reading for the investment community. His letter begins below:
To the Shareholders of Berkshire Hathaway Inc.:
In 2012, Berkshire achieved a total gain for its shareholders of $24.1 billion. We used $1.3 billion of that to repurchase our stock, which left us with an increase in net worth of $22.8 billion for the year. The per-share book value of both our Class A and Class B stock increased by 14.4%. Over the last 48 years (that is, since present management took over), book value has grown from $19 to $114,214, a rate of 19.7% compounded annually.*
A number of good things happened at Berkshire last year, but let’s first get the bad news out of the way.
Š When the partnership I ran took control of Berkshire in 1965, I could never have dreamed that a year in which we had a gain of $24.1 billion would be subpar, in terms of the comparison we present on the facing page.
But subpar it was. For the ninth time in 48 years, Berkshire’s percentage increase in book value was less than the S&P’s percentage gain (a calculation that includes dividends as well as price appreciation). In eight of those nine years, it should be noted, the S&P had a gain of 15% or more. We do better when the wind is in our face.
…..read the whole letter HERE

-
I know Mike is a very solid investor and respect his opinions very much. So if he says pay attention to this or that - I will.
~ Dale G.
-
I've started managing my own investments so view Michael's site as a one-stop shop from which to get information and perspectives.
~ Dave E.
-
Michael offers easy reading, honest, common sense information that anyone can use in a practical manner.
~ der_al.
-
A sane voice in a scrambled investment world.
~ Ed R.
Inside Edge Pro Contributors

Greg Weldon

Josef Schachter

Tyler Bollhorn

Ryan Irvine

Paul Beattie

Martin Straith

Patrick Ceresna

Mark Leibovit

James Thorne

Victor Adair