

At the turn of the year I gave the trophy to Alberta as the best place to get a paycheck, and to Calgary as the best comeback in real estate. Two months later after peaking 68 months ago (June 2007), Calgary average SFD prices have broken out with a new record high price backed up by townhouse prices also busting out to new highs.
The momentum chart has Calgary SFD prices heading towards Extreme Enthusiasm territory with a Y/Y price increase at 10.3%. I have now set up a separate chart to track Calgary SFD, Townhouse and Condo average prices.
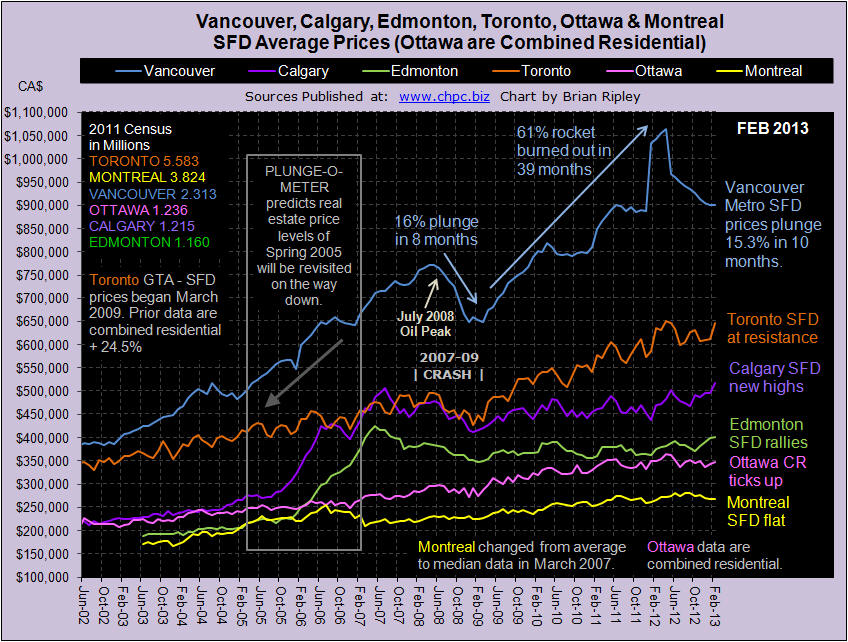
Summary of Housing Price Changes for Major Canadian Cities February 2013
Calgary and Toronto pushed average townhouse prices to new highs and SFDs in Calgary reached a new peak price not seen since June 2007.
VANCOUVER average single family detached prices in February 2013 stopped falling for the first time in ten months and ticked up 0.1% M/M but are 13.6% down Y/Y and remain 15.3% (or $163,300) below their peak set back in April 2012. This compares to the 2007-09 crash of 15.4% and a loss of $163,800 (Vancouver Chart). At the “low end” buyers stepped in and townhouse and condo apartments ticked up 1.2% and 06% M/M. Combined residential sales zoomed 33% M/M, but are down nearly 30% Y/Y even with the supply of listings down 13.2% Y/Y (Scorecard).
Now that you have the February data, where do you think Vancouver SFD prices will be one year hence? VOTE HERE.
CALGARY average detached house prices in February 2013 busted out to new highs as did townhouse prices. I have added a new dedicated Calgary Chart to track this market. Combined residential sales are up 39.1% M/M and only down 1.2% Y/Y (Scorecard). On themomentum chart, SFD prices are gushing up towards extreme enthusiasm well off the flat line of a year ago.
The sentiment in Calgary is the least bearish of the 3 markets polled; almost as many readers think prices will remain where they are as readers who think they will drop 20%. What’s your opinion? VOTE HERE.
EDMONTON average detached house prices in February 2013 also rallied with Calgary and added another 0.3% M/M gain (Canada Chart). Combined residential prices were up 4.3% M/M with average condo prices zooming 7.3% M/M. Combined residential sales and inventory were both up double digits M/M but are also both down double digits Y/Y (Scorecard). The record high SFD prices of May 2007 are now only 5.9% away on this latest surge (Plunge-O-Meter).
TORONTO average detached house prices for the GTA in February 2013 zoomed 5.8% M/M while townhouse prices broke out to a new record high (Toronto Housing Chart). SFD prices are now only 0.4% below their April 2012 peak and the only thing holding back new highs is a growing inventory (Scorecard) and slumping momentum. The gap between Vancouver and Toronto housing prices (Vancouver vs Toronto) is narrowing.
Polled sentiment continues to suggest that prices will be down another 20% in 12 months. What do you think? VOTE HERE.
OTTAWA average detached house prices are not available, instead the chart on this site reflects Ottawa’s average combined residential prices. OREB’s report is sparse and opaque and the CMHC, records for Ottawa inventory remain one month lagging. In February 2013 Ottawa combined residential prices ticked up only 1.3% M/M on a 51.8% M/M sales surge, but sales are still down 9.4% Y/Y (Scorecard). It’s been 10 months since prices peaked in Ottawa and they remain 4.8% below the highs (Plunge-O-Meter).
MONTREAL median (not average) detached house prices in January 2013 (I WILL POST FEBRUARY DATA WHEN I GET IT; MONTREAL IS USUALLY LATE) dropped another 1.1% M/M and remain at the lower end of the price range 4.3% below the all time high price set in June 2012 (Canada Chart). Prices are floating on sales resistance (Scorecard) with combined residential sales 14.9% below last year. In the 2011 Census, Montreal added 6.4% more dwelling units while only adding 5.2% more people. There is no shortage of housing, but there is a shortage of earnings; the Province of Quebec ranks 6th in Canada’s 10 provinces for earnings.
….much more below:
13 Charts on housing and related markets
Plunge-O-Meter and Canadian Earnings
Demographia and Census data.


