

Vancouver, Calgary and Toronto Detached Housing Priced in Gold:
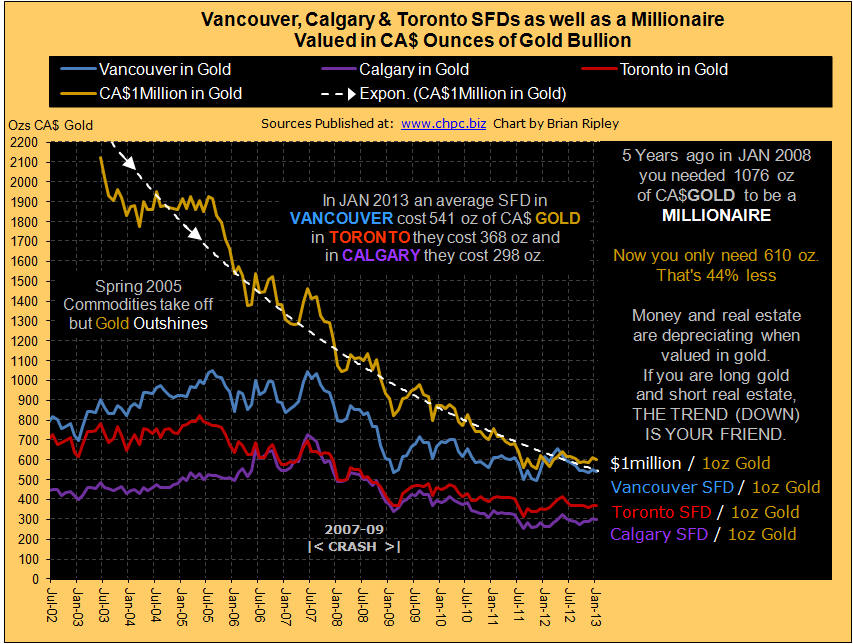
The chart above shows Vancouver, Calgary and Toronto detached housing priced in ounces of gold valued in CA$. Gold mining share prices rise as the “real price” of gold rises eg: the Gold/Commodities Ratio because the commodity cost (fuel, materials, equipment) is falling against the nominal price. See the Homestake Mining Chart from 1924 to 1935. Bullion attracts investment when credit markets contract because of its classic use as a hedge against currency depreciation and its ability to act as money.
The Millionaire Metric allows you to see what your dollar is worth and the (declining) amount of gold you need to be a millionaire. In January 2013 the spot price of gold continued trending in the middle of a channel base that has been established since last summer. It requires 44% less gold now to be a millionaire than 5 years ago. See also the GOLD/CRB ratio here.
Ratios of Gold, Commodities and TSX Real Estate – The Real Price
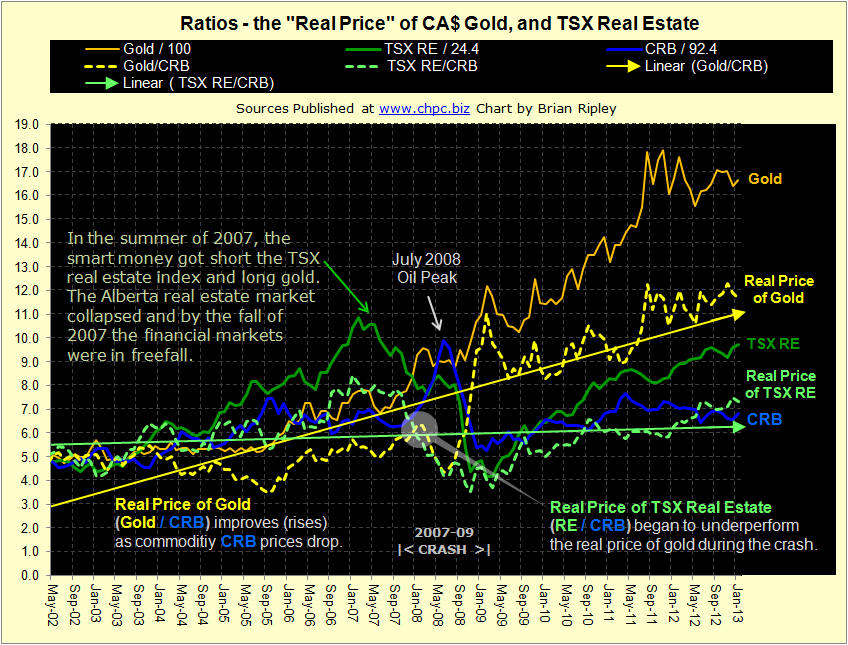
The chart above shows the “Real” price of gold (Gold/CRB) and the real price of real estate (RE/CRB). Gold miner’s profitability depends on the nominal price of gold and the cost of getting the metal out of the ground. When the cost (fuel, and industrial materials) goes down, the real price rises even in the absence of a nominal price rise. Housing is a bundled commodity (lumber, steel, copper, materials, fuel to get to the site) and the TSX-RE/CRB ratio (green dotted line) plunged with the spike in oil prices in 2008 as did the real price of gold (dotted yellow line). But by the end of the 2007-09 crash the real price of gold zoomed with the BoC ZIRP policy and the real price of TSX real estate rallied but on a much more subdued trend; gold has been outperforming since. As of January 2013 gold continues to trade sideways since the summer of 2011 but above its 6 year trend line. The CRB has been drifting down since the secondary April 2011 high and failed retest of the $147/barrel oil spike of July 2008. A falling CRB is excellent for gold miners and ultimately good for long term house buyers as the replacement value for real estate falls with the CRB. The TSX RE Index rally has been offset with an uptick in the CRB which has moved the real price (TSX-RE/CRB) down creating a near by double top test of the 2006-2007 highs. Stay tuned.
….for 10 more Real Estate Charts go HERE


