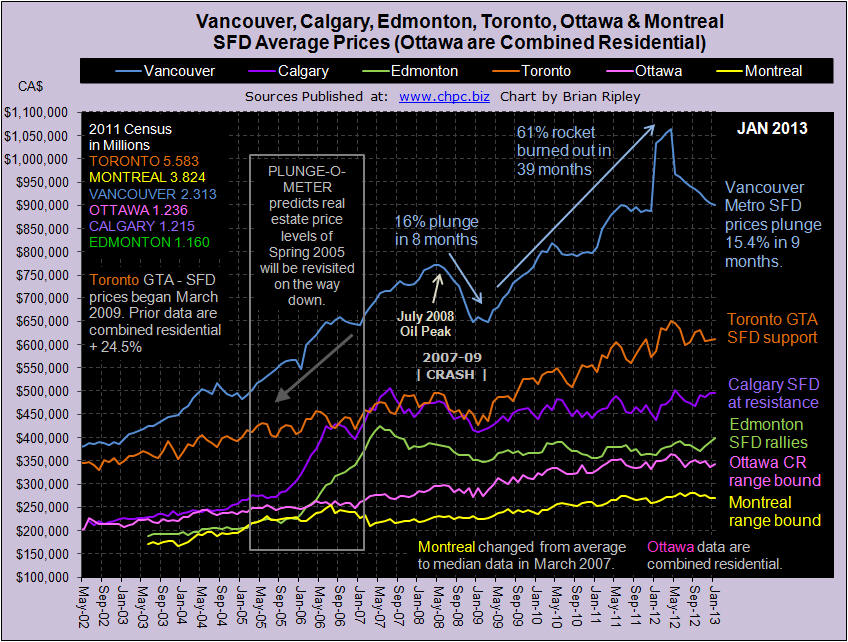
The chart above shows the average detached housing prices for Vancouver, Calgary, Edmonton, Toronto, Ottawa* and Montréal* In January 2013, Vancouver prices ticked down, Toronto prices ticked up and Alberta prices were mixed with condo prices heading south. Even in the most bullish Canadian markets of Calgary and Edmonton, condo prices dropped 7.9% M/M and 4% M/M (Scorecard). Meanwhile in Vancouver and Toronto, condo prices continued descending off their peaks down 12.4% and 8.8% from the highs.
Sales rebounded after the December Bi-Polar festivities were out of the way and inventory gushed back onto the market. Hopefully Realtors persuaded their Vendors to reduce prices on all the re-listings otherwise it’s doubtful that the sales momentum will lift all boats (Momentum Chart).
Sales rebounded after the December Bi-Polar festivities were out of the way and inventory gushed back onto the market. Hopefully Realtors persuaded their Vendors to reduce prices on all the re-listings otherwise it’s doubtful that the sales momentum will lift all boats (Momentum Chart).
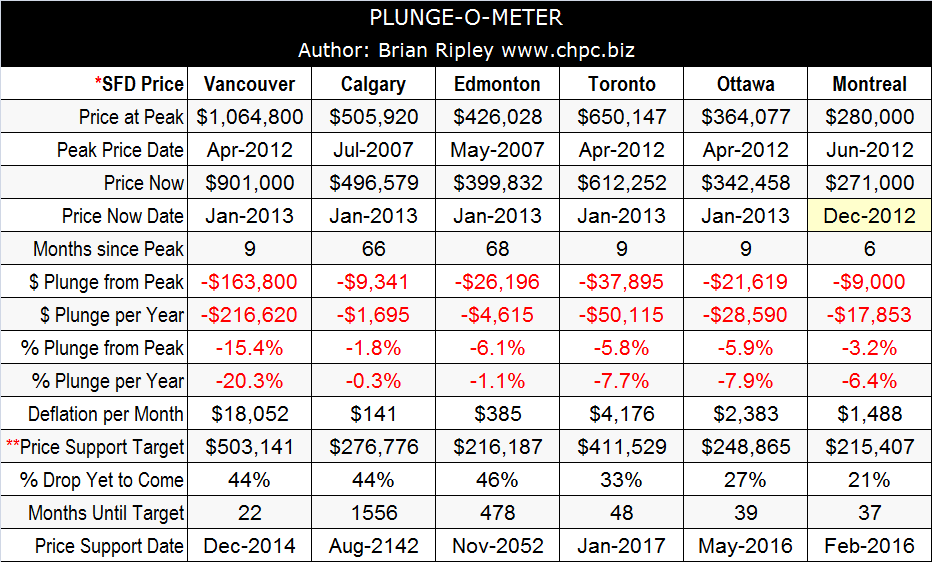
The counter trend rally going on in Alberta is being stoked by thin supply (Scorecard) and fantastic Earnings; and Calgary has almost made it back up to its peak SFD price from 66 months ago (Plunge-O-Meter). Readers on this site who have voted (Sentiment Polling) are saying that 12 months out, Calgary may be able to defend its pricing model from the bears who are clearly sharpening their claws in Toronto and Vancouver. (*Ottawa are combined residential; Montreal are median not average).