
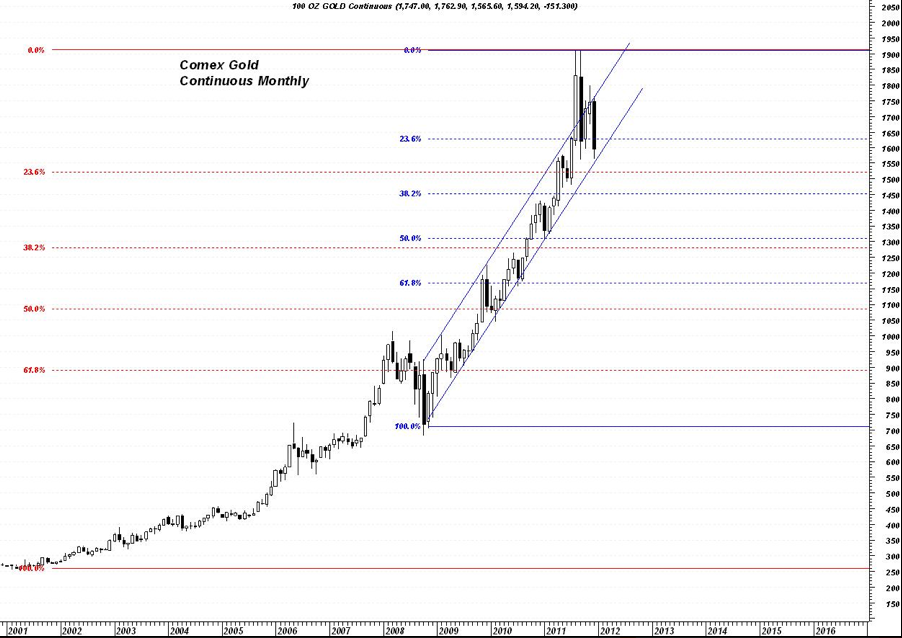
Gold & Precious Metals
A Wall Street pro named James Rickards recently released his first book,Currency Wars: The Making of the Next Global Crisis, and it’s creating a buzz. Euro Pacific Precious Metals’ CEO Peter Schiff often talks about competitive devaluation of currencies as the main driver behind our gold and silver investments. Recently, Peter sat down with James to get his perspective on what’s behind these currency wars, and find out what he recommends investors do to preserve their wealth through this tumultuous time.
—–
Peter Schiff: You portray recent monetary history as a series of currency wars – the first being 1921-1936, the second being 1967-1987, and the third going on right now. This seems accurate to me. In fact, my father got involved in economics because he saw the fallout of what you would call Currency War II, back in the ’60s. What differentiates each of these wars, and what is most significant about the current one?
James Rickards: Currency wars are characterized by successive competitive devaluations by major economies of their currencies against the currencies of their trading partners in an effort to steal growth from those trading partners.
While all currency wars have this much in common, they can occur in dissimilar economic climates and can take different paths. Currency War I (1921-1936) was dominated by a deflationary dynamic, while Currency War II (1967-1987) was dominated by inflation. Also, CWI ended in the disaster of World War II, while CWII was brought in for a soft landing, after a very bumpy ride, with the Plaza Accords of 1985 and the Louvre Accords of 1987.
What the first two currency wars had in common, apart from the devaluations, was the destruction of wealth resulting from an absence of price stability or an economic anchor.
Interestingly, Currency War III, which began in 2010, is really a tug-of-war between the natural deflation coming from the depression that began in 2007 and policy-induced inflation coming from Fed easing. The deflationary and inflationary vectors are fighting each other to a standstill for the time being, but the situation is highly unstable and will “tip” into one or the other sooner rather than later. Inflation bordering on hyperinflation seems like the more likely outcome at the moment because of the Fed’s attitude of “whatever it takes” in terms of money-printing; however, deflation cannot be ruled out if the Fed throws in the towel in the face of political opposition.
Peter: You and I agree that the dollar is on the road to ruin, and we both have made some drastic forecasts about what the government might do in the face of the dollar collapse. How might this scenario play out in your view?
James: The dollar is not necessarily on the road to ruin, but that outcome does seem highly likely at the moment. There is still time to pull back from the brink, but it requires a specific set of policies: breaking up big banks, banning derivatives, raising interest rates to make the US a magnet for capital, cutting government spending, eliminating capital gains and corporate income taxes, going to a personal flat tax, and reducing regulation on job-creating businesses. However, the likelihood of these policies being put in place seems remote – so the dollar collapse scenario must be considered.
Few Americans are aware of the International Economic Emergency Powers Act (IEEPA)… it gives any US president dictatorial powers to freeze accounts, seize assets, nationalize banks, and take other radical steps to fight economic collapse in the name of national security. Given these powers, one could see a set of actions including seizure of the 6,000 tons of foreign gold stored at the Federal Reserve Bank of New York which, when combined with Washington’s existing hoard of 8,000 tons, would leave the US as a gold superpower in a position to dictate the shape of the international monetary system going forward, as it did at Bretton Woods in 1944.
Peter: You write in your book that it’s possible that President Obama may call for a return to a pseudo-gold standard. That seems far-fetched to me. Why would a bunch of pro-inflation Keynesians in Washington voluntarily restrict their ability to print new money? Wouldn’t such a program require the government to default on its bonds?
James: My forecast does not pertain specifically to President Obama, but to any president faced with economic catastrophe. I agree that a typically Keynesian administration will not go to the gold standard easily or willingly. I only suggest that they may have no choice but to go to a gold standard in the face of a complete collapse of confidence in the dollar. It would be a gold standard of last resort, at a much higher price – perhaps $7,000 per ounce or higher.
This is similar to what President Roosevelt did in 1933 when he outlawed private gold ownership but then proceeded to increase the price 75% in the middle of the worst sustained period of deflation in U.S. history.
Peter: You also write that you were asked by the Department of Defense to teach them to attack other countries using monetary policy. Do you believe there has a been an deliberate attempt to rack up as much public debt as possible – from the Chinese, in particular – and then strategically default through inflation?
James: I do not believe there has been a deliberate plot to rack up debt for the strategic purpose of default; however, something like that has resulted anyway.
Conventional wisdom is that China has the US over a barrel because it holds more than $2 trillion of US dollar-denominated debt, which it could dump at any time. In fact, the US has China over a barrel because it can freeze Chinese accounts in the face of any attempted dumping and substantially devalue the worth of the money we owe the Chinese. The Chinese themselves have been slow to realize this. In hindsight, their greatest blunder will turn out to be trusting the US to maintain the value of its currency.
Peter: In your book, you lay out four possible results from the present currency war. Please briefly describe these and which one do you feel is most likely and why.
James: Yes, I lay out four scenarios, which I call “The Four Horsemen of the Dollar Apocalypse.”
The first case is a world of multiple reserve currencies with the dollar being just one among several. This is the preferred solution of academics. I call it the “Kumbaya Solution” because it assumes all of the currencies will get along fine with each other. In fact, however, instead of one central bank behaving badly, we will have many.
The second case is world money in the form of Special Drawing Rights (SDRs). This is the preferred solution of global elites. The foundation for this has already been laid and the plumbing is already in place. The International Monetary Fund (IMF) would have its own printing press under the unaccountable control of the G20. This would reduce the dollar to the role of a local currency, as all important international transfers would be denominated in SDRs.
The third case is a return to the gold standard. This would have to be done at a much higher price to avoid the deflationary blunder of the 1920s, when nations returned to gold at an old parity that could not be sustained without massive deflation due to all of the money-printing in the meantime. I suggest a price of $7,000 per ounce for the new parity.
My final case is chaos and a resort to emergency economic powers. I consider this the most likely because of a combination of denial, delay, and wishful thinking on the part of the monetary elites.
Peter: What do you see as Washington’s end-game for the present currency war? What is their best-case scenario?
James: Washington’s best-case scenario is that banks gradually heal by making leveraged profits on the spreads between low-cost deposits and safe government bonds. These profits are then a cushion to absorb losses on bad assets and, eventually, the system becomes healthy again and can start the lending-and-spending game over again.
I view this as unlikely because the debts are so great, the time needed so long, and the deflationary forces so strong that the banks will not recover before the needed money-printing drives the system over a cliff – through a loss of confidence in the dollar and other paper currencies.
Peter: I don’t think this scenario is likely either, but say it were… would it be healthy for the American economy to have to carry all these zombie banks that depend on subsidies for survival? Wouldn’t it be better to just let the toxic assets and toxic banks flush out of the system?
James: I agree completely. There’s a model for this in the 1919-1920 depression, when the US government actually ran a balanced budget and the private sector was left to clean up the mess. The depression was over in 18 months and the US then set out on one of its strongest decades of growth ever. Today, in contrast, we have the government intervening everywhere, with the result that we should expect the current depression to last for years – possibly a decade.
Peter: How long do you think Currency War III will last?
James: History shows that Currency War I lasted 15 years and Currency War II lasted 20 years. There is no reason to believe that Currency War III will be brief. It’s difficult to say, but it should last 5 years at least, possibly much longer.
Peter: From my perspective, what is unique about a currency war is that the object is to inflict damage on yourself, and the country often described as the winner is actually the biggest loser, because they’ve devalued their currency the most. Which currency do you think will come out of this war the strongest?
James: I expect Europe and the euro will emerge the strongest after this currency war by doing the most to maintain the value of its currency while focusing on economic fundamentals, rather than quick fixes through devaluation. This is because the US and China are both currency manipulators out to reduce the value of their currencies. In the zero-sum world of currency wars, if the dollar and yuan are both down or flat, the euro must be going up. This is why the euro has not acted in accord with market expectations of its collapse.
The other reason the euro is strong and getting stronger is because it is backed by 10,000 tons of gold – even more than the US This is a source of strength for the euro.
Peter: You and I both connect the Fed’s dollar-printing with the recent revolutions in the Middle East. This is because our inflation is being exported overseas and driving up prices for food and fuel in third-world countries. What do you think will happen domestically when all this inflation comes home to roost?
James: The Fed will allow the inflation to grow in the US because it is the only way out of the non-payable debt.
Initially, American investors will be happy because the inflation will be accompanied by rising stock prices. However, over time, the capital-destroying nature of inflation will become apparent – and markets will collapse. This will look like a replay of the 1970s.
Peter: How long do you think China’s elites will put up with the Fed’s inflationary agenda before they start dumping their US dollar assets?
James: The Chinese will never “dump” assets because this could cause the US to freeze their accounts. However, the Chinese will shorten the maturity structure of those assets to reduce volatility, diversify assets by reallocating new reserves towards euro and yen, increase their gold holdings, and engage in direct investment in hard assets such as mines, farmland, railroads, etc. All of these developments are happening now and the tempo will increase in future.
Peter: In your view, what is the best way for investors to protect themselves from this crisis?
James: My recommended portfolio is 20% gold, 5% silver, 20% undeveloped land in prime locations with development potential, 15% fine art, and 40% cash. The cash is not a long-term position but does give an investor short-term wealth preservation and optionality to pivot into other asset classes when there is greater visibility.
[Editor’s note: Opinions expressed are the interviewee’s own and do not represent investment advice from Peter Schiff or Euro Pacific Precious Metals.]
Peter: What, if any, silver lining do you see for us in the future?
James: I continue to have faith in the democratic process and the wisdom of the American people. Through elections, we might be able to change leadership and implement new policies before it’s too late.
Failing that, the worst outcomes are all but unavoidable.
—–
We would like to thank James for speaking to us about this topic and educating the public about the dangers of currency wars. We at Euro Pacific Precious Metals believe they represent the greatest threat to investors’ financial wellbeing today.
While James and Peter may disagree on some key points, we think he has accurately diagnosed the mentality that may drive the US to a dollar collapse. Unless the US decides to quit the currency wars, investors will continue to be pushed into precious metals and other hard assets. And, as James illustrates, declaring a truce is easier said than done.
James G. Rickards is Senior Managing Director at Tangent Capital Partners LLC, a merchant bank based in New York City, and is Senior Managing Director for Market Intelligence at Omnis, Inc., a technical, professional and scientific consulting firm located in McLean, VA.
Peter Schiff is CEO of Euro Pacific Precious Metals, a gold and silver dealer selling reputable, well-known bullion coins and bars at competitive prices. To learn more, please visit www.europacmetals.com or call (888) GOLD-160.
For the latest gold market news and analysis, sign up for Peter Schiff’s Gold Report, a monthly newsletter featuring original contributions from Peter Schiff, Casey Research, and other leading experts in the gold market. Click here to learn more.

Energy is of huge importance for the growth of the economy. The demand is steadily growing and the political change away from nuclear power to renewable energy slows the supply growth of energy. I screened stocks from the investment theme by the best growth over the past 10 years. I decided to select only stocks with a double-digit sales growth and a dividend yield of more than three percent. Fourteen stocks fulfilled my criteria. The highest growth was realized by Penn Virginia Resource Partners (PVR) who had a yearly growth of 40.3 percent. One company has a yield of more than 50 percent.
Here are my favorite stocks:
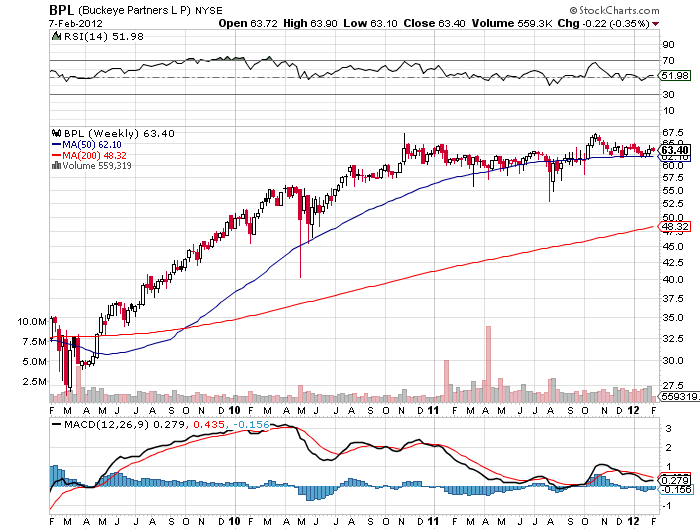
1. Buckeye Partners (BPL) has a market capitalization of $5.89 billion. The company employs 859 people, generates revenues of $3,151.27 million and has a net income of $43.08 million. The firm’s earnings before interest, taxes, depreciation and amortization (EBITDA) amounts to $338.70 million. Because of these figures, the EBITDA margin is 10.75 percent (operating margin 8.87 percent and the net profit margin finally 1.37 percent).
The total debt representing 50.51 percent of the company’s assets and the total debt in relation to the equity amounts to 129.65 percent. Due to the financial situation, a return on equity of 5.27 percent was realized. Twelve trailing months earnings per share reached a value of $0.80. Last fiscal year, the company paid $3.82 in form of dividends to shareholders.
Here are the price ratios of the company: The P/E ratio is 79.04, Price/Sales 1.88 and Price/Book ratio 3.26. Dividend Yield: 6.44 percent. The beta ratio is 0.26.
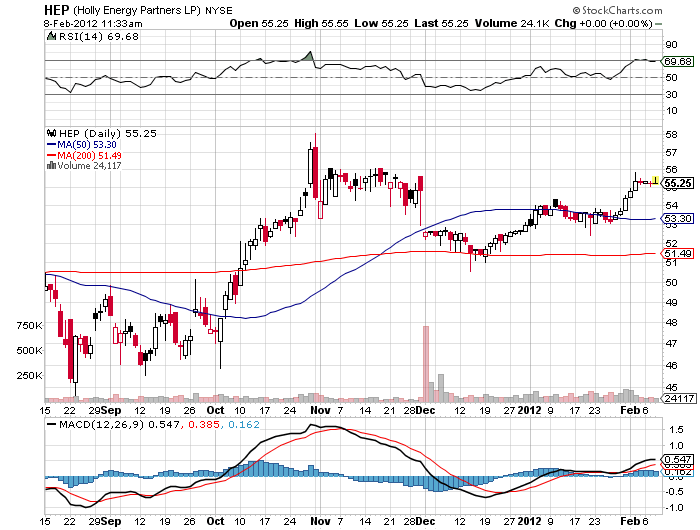
2. Holly Energy Partners (HEP) has a market capitalization of $1.22 billion. The company employs 148 people, generates revenues of $182.10 million and has a net income of $58.87 million. The firm’s earnings before interest, taxes, depreciation and amortization (EBITDA) amounts to $121.35 million. Because of these figures, the EBITDA margin is 66.64 percent (operating margin 49.84 percent and the net profit margin finally 32.33 percent).
The total debt representing 76.43 percent of the company’s assets and the total debt in relation to the equity amounts to 449.52 percent. Due to the financial situation, a return on equity of 17.33 percent was realized. Twelve trailing months earnings per share reached a value of $2.47. Last fiscal year, the company paid $3.32 in form of dividends to shareholders.
Here are the price ratios of the company: The P/E ratio is 22.39, Price/Sales 8.30 and Price/Book ratio 4.86. Dividend Yield: 6.41 percent. The beta ratio is 0.65.
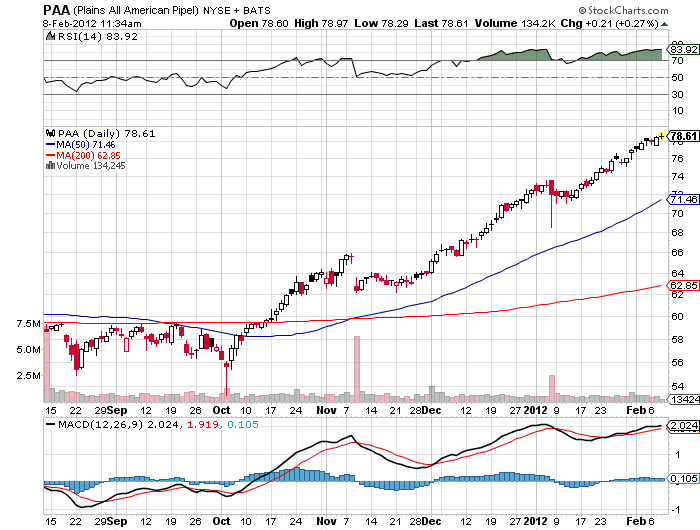
3. Plains All American Pipelines (PAA) has a market capitalization of $11.65 billion. The company employs 3,500 people, generates revenues of $25,893.00 million and has a net income of $514.00 million. The firm’s earnings before interest, taxes, depreciation and amortization (EBITDA) amounts to $1,016.00 million. Because of these figures, the EBITDA margin is 3.92 percent (operating margin 2.96 percent and the net profit margin finally 1.99 percent).
The total debt representing 43.47 percent of the company’s assets and the total debt in relation to the equity amounts to 137.19 percent. Due to the financial situation, a return on equity of 8.01 percent was realized. Twelve trailing months earnings per share reached a value of $4.18. Last fiscal year, the company paid $3.76 in form of dividends to shareholders.
Here are the price ratios of the company: The P/E ratio is 18.64, Price/Sales 0.47 and Price/Book ratio 2.60. Dividend Yield: 5.25 percent. The beta ratio is 0.50.
Take a closer look at the full table of energy stocks with fastest growth and big dividends. The average price to earnings ratio (P/E ratio) amounts to 20.95. The dividend yield has a value of 9.02 percent. Price to book ratio is 2.70 and price to sales ratio 2.88. The operating margin amounts to 26.35 percent.
Related stock ticker symbols:
ARLP, BPT, BPL, HEP, MMP, MMLP, PGH, PVR, PTR, PBR, PAA, RES, TGS, YZC

The Federal Reserve recently announced important policy changes after its Federal Open Market Committee (FOMC) meeting. Here are the three most important takeaways, in its own words:
1.The Committee decided today to keep the target range for the federal funds rate at 0 to 1/4 percent and currently anticipates that economic conditions – including low rates of resource utilization and a subdued outlook for inflation over the medium run – are likely to warrant exceptionally low levels for the federal funds rate at least through late 2014.
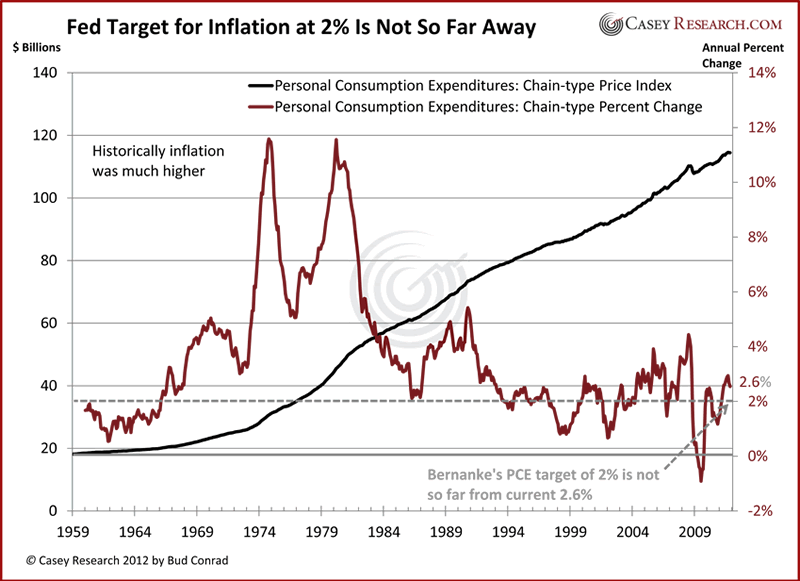
2.The Committee judges that inflation at the rate of 2 percent, as measured by the annual change in the price index for personal consumption expenditures, is most consistent over the longer run with the Federal Reserve’s statutory mandate. In the most recent projections, FOMC participants’ estimates of the longer-run normal rate of unemployment had a central tendency of 5.2 percent to 6.0 percent.
3.The Fed released FOMC participants’ target federal funds rate for the next few years.
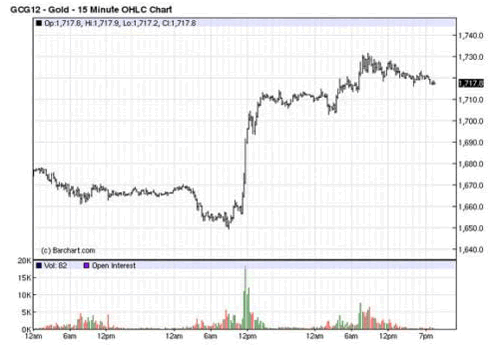
The first item is the most important as it was not expected – and it had an immediate effect on markets. As seen in the chart below, gold spiked higher on the surprise news of extending the zero-rate policy through 2014.
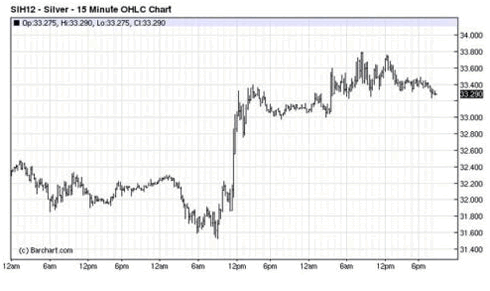
The news prompted a similar jump in silver services:
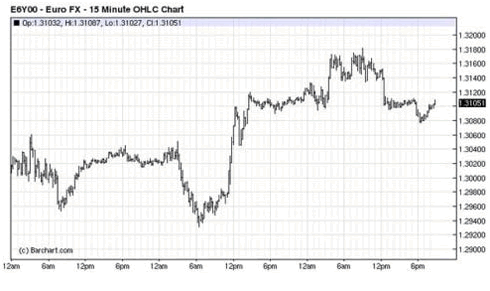
Keeping rates low requires the Fed to print new money to buy Treasuries, so the dollar weakened against the euro, although the reaction wasn’t as big as in those in the gold and silver markets. This is partially due to the fact that the ECB is on its own campaign of printing money.
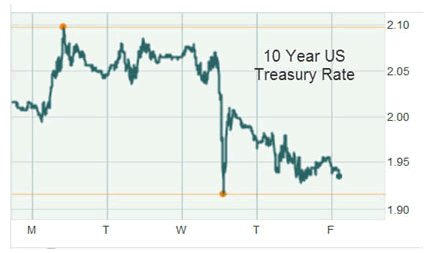
The promise to keep short-term rates low for a longer period also caused longer-term rates to fall slightly, as seen in the 10-year Treasury rate chart below, which fell from about 2.05% to 1.95 %, a relatively modest decline.
What Does This Say about the Fed’s Policy?
The most important action of the three was to extend the zero Fed funds rate to the end of 2014. This is a form of easing that could affect more rates than just short-term rates. Furthermore, there is a debate as to whether the action was the result of the Fed’s concern about the economy slipping back into recession. Or, this could also be a bullish sign for the economy and stock market, as the guaranteed low rates could increase investment to improve our economy. Zero rates drive investors to take on risks – such as buying stocks – to gain higher returns. As a result, this induces more investment toward riskier parts of the market, which might otherwise be underfunded. Though the Fed aims to stimulate the economy, we’re more likely to see a slip back into recession rather than see an effective Fed stimulus improving the economy.
The press conference suggested that quantitative easing (QE) remains on the table. As a result, new targeted asset purchases by the Fed are likely in our future. These additional purchases with newly printed money could become inflationary. That is why gold shot higher and the dollar weakened in the short term.
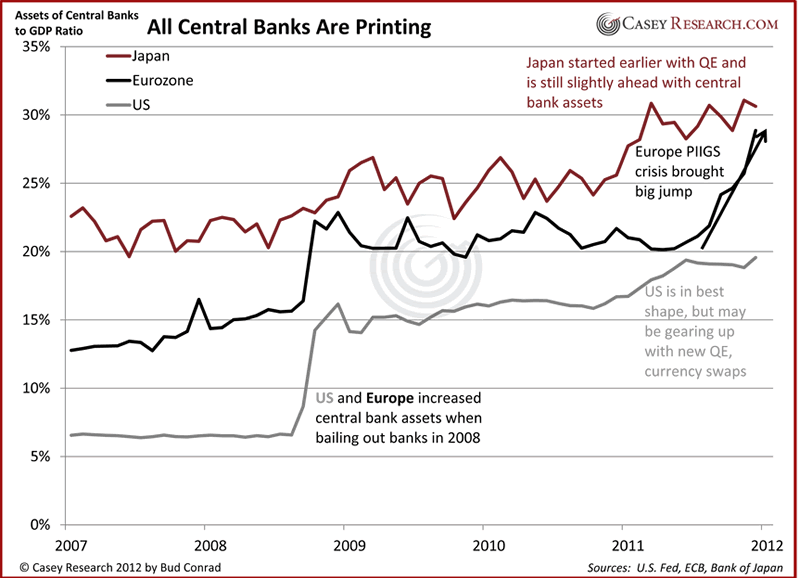
Both the Fed and the ECB have decidedly less-hawkish members and leadership than just last year. Both have now moved toward more money printing to keep rates low. The chart of central bank balance sheet as a ratio to GDP shows that the central banks of the world are clearly “printing”:
Longer-Term Implications
The problem with printing money and promising to do so for years ahead of time is that the negative consequences of inflation only happen after a delay. As a result, it’s difficult to know if a policy has gone too far until years down the road at times. Unfortunately, if confidence in the dollar is lost, the consequences cannot be easily reversed. One problem for the Fed itself is that it holds long-term securities that will lose value if rates rise. The federal government faces an even more serious problem when interest rates rise, as higher rates on its debt mean greater interest payments to service. Due to this federal-government debt burden, the Fed has an incentive to keep rates low, even if the long-term result is higher inflation. However, for now the Fed’s statement suggests it sees inflation as “subdued,” so it’s putting those concerns aside for now.
Along with the promise of low rates, the Fed for the first time gave an inflation target of 2%, as measured by Personal Consumption Expenditures. The actual and target inflation show that the Fed is currently not under major pressure from missing its target… not yet.
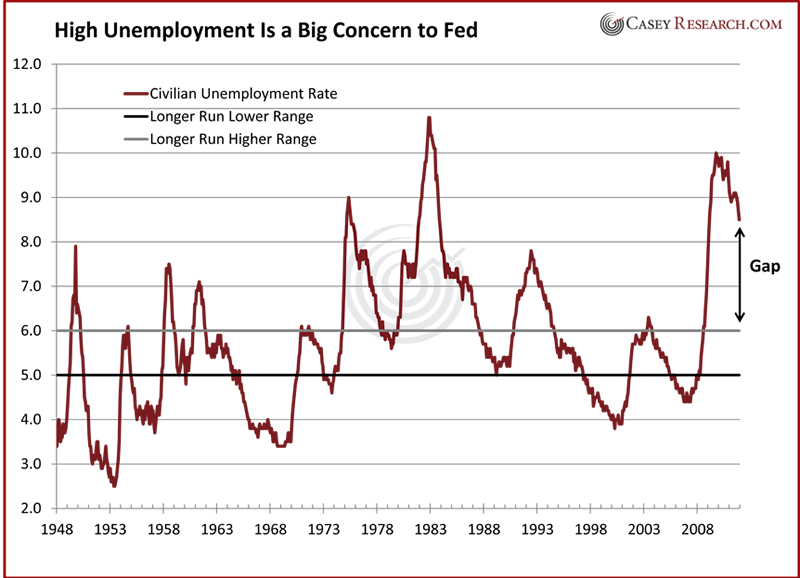
The Fed has not even tried to set a target for the unemployment rate, which is only expected to edge below 8% by 2013. The Fed says that that the longer-run unemployment range is 5% to 6%. The big difference from the current level of 8.5% indicates that the Fed faces a greater challenge with unemployment than inflation now.
My conclusion from the Fed’s actions is that it doesn’t care as much about its inflation target as it does about improving the unemployment rate. Thus, it will err on the side of letting inflation rise, if it would improve unemployment. But holding rates too low too long fueled the housing bubble. Repeating the same game will have consequences of malinvestment in the form of new bubbles in the economy. The Fed hopes to restore employment before the negative consequences of loose monetary policy show up.
The Fed provided the accompanying chart of the Fed funds rates expected by the seventeen members of the FOMC. Each dot indicates the value (rounded to the nearest quarter-percent) of an individual participant’s judgment of the appropriate level of the target Federal funds rate at the end of the specified calendar year. Over the long run, the Fed expects the funds rate to rise to around 4.25%. Eleven of the members indicate that the rate will rise before 2015. Only six expect the rate to stay close to zero through 2014.
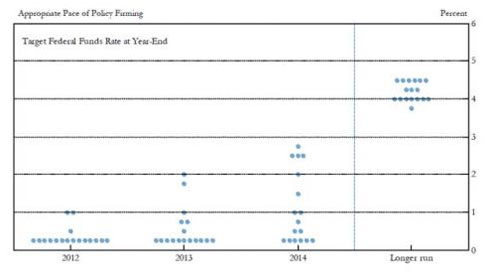
The above chart should not be taken very seriously, as Fed predictions have been notoriously inaccurate. Furthermore, it’s likely that rates will rise before 2014 as a result of market forces pushing them upward due to mistrust of the currency – measured by rising gold and commodity prices.
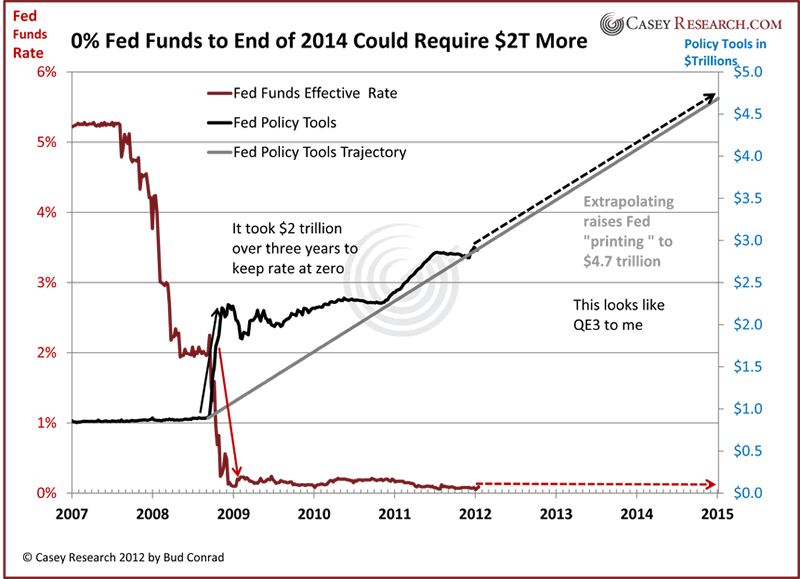
The Federal Reserve balance sheet expanded dramatically as the credit crisis became acute in 2008. The Policy Tools (shown below in black) grew by $2 trillion with the QE1 purchase of mortgage-backed securities and the QE2 purchase of long-term Treasuries. This was an unprecedented effort to support those markets, provide liquidity, and drive rates down to zero. A simple extrapolation of similar expansion policies to the end of 2014 suggests that the Fed may require an additional $2 trillion to extend its goals. The problem is that such action would surely weaken the dollar and drive gold much higher. If confidence is lost, rates could rise even as the Fed continues to print and buy securities. The Fed says that it will change its policy if conditions warrant. I think they will be forced to stop this policy well before 2014 is over. Nonetheless, in the meantime, they will plant the seeds of rising prices with ultralow rates.
The gold price is driven by Fed policies and its bias toward printing money rather than defending the dollar’s purchasing power. This Fed bias was again reconfirmed by this announcement. With all the Fed’s renewed vigor toward keeping rates low longer, we can once again reconfirm the ongoing downward slide for the dollar. As a result, gold remains the best investment against the damaging government deficits and central bank policies around the world.
While the dollar may look good compared to the other fiat contestants on the global money stage, the United States’ debt situation is untenable – and various factors could bring it to its knees faster than anyone expects. Don’t let it burn you: learn how to protect yourself and your assets.]
© 2012 Copyright Casey Research – All Rights Reserved
Disclaimer: The above is a matter of opinion provided for general information purposes only and is not intended as investment advice. Information and analysis above are derived from sources and utilising methods believed to be reliable, but we cannot accept responsibility for any losses you may incur as a result of this analysis. Individuals should consult with their personal financial advisors.

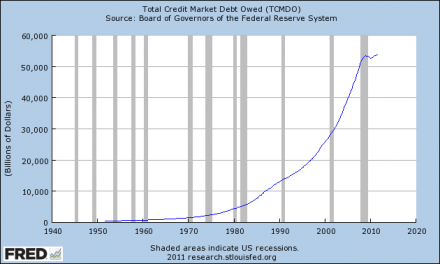
The people out there that believe that the U.S. economy is experiencing a permanent recovery and that very bright days are ahead for us should have their heads examined. Unfortunately, what we are going through right now is simply just a period of “hopetimism” between two financial crashes. Things may seem relatively stable right now, but it won’t last long. The truth is that the financial crisis of 2008 was just a warm up act for the economic horror show that is coming. Nothing really got fixed after the crash of 2008. We are living in the biggest debt bubble in the history of the world, and it has gotten even bigger since then. The “too big to fail” banks are larger now than they have ever been. Americans continue to run up credit card balances like there is no tomorrow. Tens of thousands of manufacturing facilities and millions of jobs continue to leave the country. We continue to consume far more than we produce and we continue to become poorer as a nation. None of the problems that caused the crisis of 2008 have been solved and we are even weaker financially than we were back then. So why in the world are so many people so optimistic about the economy right now? The Next Next Financial Crisis Will Be Devastating To The Economy
Just take a look at the chart posted below. It shows the growth of total debt in the United States. During the financial crisis of 2008 there was a little “hiccup”, but the truth is that not much deleveraging really took place at all. And since the recession “ended”, total credit market debt has gone on to even greater heights….

Famed investor Jim Rogers has already said he wouldn’t buy Facebook when the social networking giant has its IPO later this week. “No, that kind of stock I don’t buy. They are usually very, very expensive. A lot of people like to buy expensive stocks like that, but I do not,” said Rogers to CNBC yesterday.
However, that Rogers seems bearish on the internet company shouldn’t necessarily drive one away from Facebook. Rogers is bearish on…well, just about everything in America these days.
“It has been demonstrated many, many times before that sellers are usually smarter than the buyers, and they usually know when the best time to sell is, and Facebook is doing it,” he said. Rogers also stated his general opposition to the high prices in the Tech sector, saying ”I am interested in technology in some shape or form, but I can’t imagine buying any of them. They are a bit hot these days and they have been for two or three months, so that is why I am short. I don’t buy high-priced stocks.”
….read more HERE


-
I know Mike is a very solid investor and respect his opinions very much. So if he says pay attention to this or that - I will.
~ Dale G.
-
I've started managing my own investments so view Michael's site as a one-stop shop from which to get information and perspectives.
~ Dave E.
-
Michael offers easy reading, honest, common sense information that anyone can use in a practical manner.
~ der_al.
-
A sane voice in a scrambled investment world.
~ Ed R.
Inside Edge Pro Contributors

Greg Weldon

Josef Schachter

Tyler Bollhorn

Ryan Irvine

Paul Beattie

Martin Straith

Patrick Ceresna

Mark Leibovit

James Thorne

Victor Adair