
Currency
Gold took a knockdown punch at the start of Round 1when I suggested gold could be bottoming soon. Gold proceeded to fall another 8% in the days following those comments.
But gold got up off the matt and started swinging.
Gold is now trading above the $1,290 level where it stood last time I wrote about it. From June 28 to July 23 gold rallied more than 11%. The last eight sessions have seen a consolidation that’s hovering along gold’s 50-day moving average:
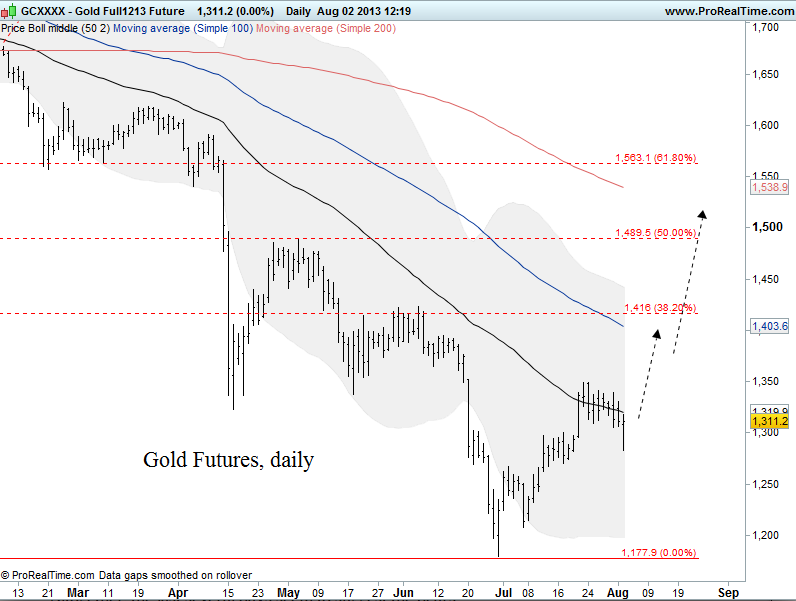
Today, immediately following the mediocre July US Nonfarm Payrolls report, gold dropped along with the US dollar. Gold, however, unlike the US dollar, has recovered those losses.
Altogether, the last several days seem to suggest the bears are having trouble pushing gold much lower. In looking at the positioning in the futures market, commercials are beginning to rebuild their net short position (hedging) while speculators are beginning to rebuild their net long position. That suggests an uptrend could be in the making:
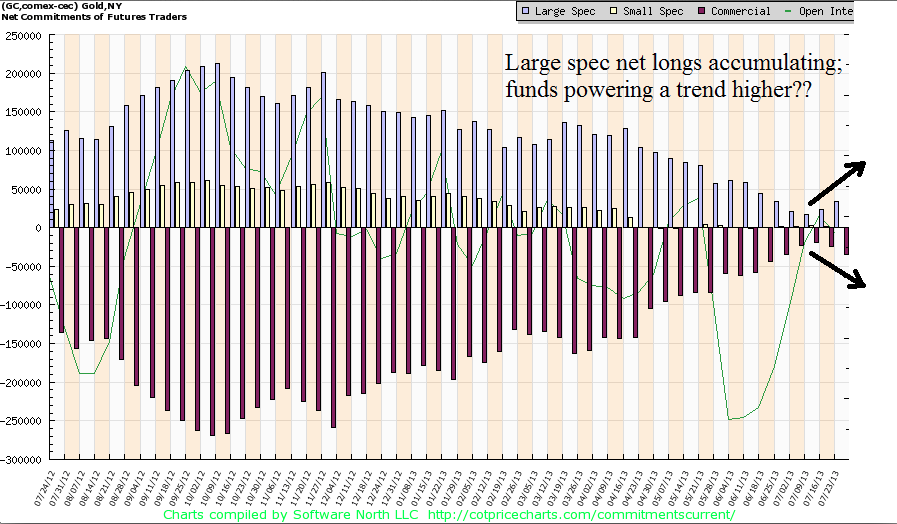
More to that point, I was forwarded these comments from a friend who receives some technical and sentiment analysis on the futures markets. Regarding gold:
GOLD: The current fund trend is down, but funds have bought $4.1b over two weeks. This is bullish because buying interest from trend-following funds powers uptrends. Another bullish factor is the extreme reading in the three trend cycles, which reveal a grossly oversold condition.

TRANSITION
-
We are getting there on the big Rounded Top for Global Equities and the equivalent bottom for the Precious Metals Sector.
-
Lower-grade bonds are well over the Top and facing a Jagged Cliff.
-
Depending upon the character of the trading day, central bankers seem to be
jousting at windmills or hoisting petards.
-
In April we noted that the potential reversal in the credit markets in May from bullish to bearish would “pre-empt” the big decision by the Fed to end the bond buying spree. Bad news.
-
The hit to global credit markets was fast and hard. The rise in yields was natural, but the Fed had to be seen as “in charge” so Bernanke mumbled something about “tapering”.
-
The initial bond panic exhausted itself and a week into the rebound Bernanke hinted that the taper was a possibility, but at some other time.
-
Good news.
-
Bernanke’s prepared remarks for the “testimonial” thing included that “The Fed is
buying $85 billion a month.” Questionable news.
-
As with “austerity, “tapering” will not be voluntary policy.
STOCKS
This page has considered that the rebound out of the mini-panic in lower-grade bonds would run through July. This has accomplished a new high for the S&P, but the negative divergence on RSI Momentum is now a caution.
Help from the rebounding junk-bond market is effectively over. It seems to have reached its best yesterday and is working on an Outside Reversal today.
The next drop spells “history” for the lower-grade bond market–around the world.
Showing great enthusiasm, banks (BKX) continued their rally and have clocked 78.15 on the Weekly RSI. This is the highest RSI since the halcyon days of 1997. Financials have been hot.
Not so hot were the base metal miners (SPTMN) that became very oversold in late June. Enough to prompt a rally and the index has stair-stepped from 662 to 744. It can continue through August.
Overall, stock market action has been working on the end of a four-year bull market. Continue to sell the rallies.
PRECIOUS METALS
Gold has bottomed relative to a number of important items. The following chart shows gold relative to the stock market and lists the condition of other significant comparisons.
The importance is that the gold sector is completing a bear market in real terms as orthodox investment sectors are completing a secular bull market, also in real terms.
The bear since 2011 has virtually taken out the inflation bulls. That was the old paradigm.
The bottom in Precious Metals has been a difficult process and we have been buying the bad days.
Gold stocks can continue the revival through August when they could briefly become vulnerable to the re-discovery of liquidity problems.
After that, we are looking forward to a cyclical bull market, in real terms, that could run for a couple of years.
This will be the new paradigm, last seen in the 1930s.
Gold Stocks Beginning To Outperform The S&P

This was one of the items that would confirm the end of the bear market in Precious Metals
-
The action became remarkably oversold
-
This indicator has reversed.
-
Others that are in a similar reversal:
o Gold Stocks/Gold (Tested reversal)
o Gold/Crude ( A week behind)
o Gold/Base Metals ( Almost there)
o Gold/Grains ( Made the turn)
o Gold/CRB (Basing)
BOB HOYE, INSTITUTIONAL ADVISORS
E-MAIL bobhoye@institutionaladvisors.com
WEBSITE: www.institutionaladvisors.com


After the Federal Reserve ramped up Quantitative Easing (money-printing) to $85 billion back in December, the lack of impact that this has had on U.S. employment is surprisingly limited.
Obviously QE should be beneficial to improving employment, but I think the financial press is beginning to lose sight of the sheer magnitude of QE and the lack of results.
$85 billion a month is about $4 billion for every trading day. Or, about $1 billion during every hour and a half of trading. And, this is still not enough to fix sluggish employment.
In July, the U.S. created 162,000 net new jobs. In historical recoveries, this number is normally around 300,000 a month, and that is without QE, and with normal interest rates in place!
Instead of re-examining the effectiveness of QE, it is more likely that the Federal Reserve will maintain QE in the face of anemic jobs growth. Or, even ramp it up higher.
Eventually a good portion of QE will represent a pure “monetization” of the U.S. Federal debt (much of the money created by QE will never be withdrawn from the economy). This puts the long-term value of the U.S. dollar at risk and continues to increase the potential for commodities denominated in U.S. dollars – gold, oil, etc.
The opinions expressed in this report are the opinions of the author and readers should not assume they reflect the opinions or recommendations of Richardson GMP Limited or its affiliates. Assumptions, opinions and estimates constitute the author’s judgment as of the date of this material and are subject to change without notice. We do not warrant the completeness or accuracy of this material, and it should not be relied upon as such. Before acting on any recommendation, you should consider whether it is suitable for your particular circumstances and, if necessary, seek professional advice. Past performance is not indicative of future results.
Richardson GMP Limited, Member Canadian Investor Protection Fund.
Richardson is a trade-mark of James Richardson & Sons, Limited. GMP is a registered trade-mark of GMP Securities L.P. Both used under license by Richardson GMP Limited.

 Cometh the hour, cometh the man.
Or the woman…
The White House is casting about for a new Fed chairman. Three candidates have their mouths open, hoping to snag the hook: Janet Yellen, Larry Summers and Don Kohn.
Herewith, we propose an alternative… in just a moment.
First, we note that the Dow got a nice boost yesterday. It rose 128 points to a new nominal high. Gold sold off a little. As near as we can tell, stocks are still going up along with Fed additions to the monetary base (which keep long-term Treasury yields artificially low).
In other words, the Fed is blowing another bubble. With a Dow of nearly 16,000 in a $16 trillion economy, the math is tantalizing. The Fed inflates the money supply by $85 billion a month. If all of this inflation were exactly mirrored in the stock market, we should see the Dow go up 85 points… which is about what we’re seeing… or more!
A year ago, the Dow was only 13,000. Now it is over 15,000. There seems to be a multiplier effect at work; dollar for dollar, the Dow has gained capitalization about twice as fast as the monetary base.
The Diplomat
But let us return to the hour… and to the man.
The hour is the time when Ben Bernanke must shuffle off to some post where he will do less damage. The man is the person (man or woman) who will take his place in the padded chair.
As to Yellen, Summers and Kohn, we would reject them all. Clearly, none has any idea what is coming his way or he wouldn’t want the job. But this is a minority opinion. So let’s keep an open mind and examine each of these fish separately.
Janet Yellen has three things going for her. According to Alan Blinder’s recent piece in The Wall Street Journal, she (1) is a woman, 2) is a good diplomat and (3) has been around the Fed since 1990 and nothing bad has happened.
We offer a trio of replies. (1) There are roughly 120 million adult women in the US; womanhood is not a qualification for the job. (2) Diplomacy is irrelevant. (3) Having been around since 1990 is a disqualifier. Yellen was at the Fed as US total debt rose from about 230% of GDP to over 350%. If she had had her wits about her, she would have realized that the Fed was enabling a huge credit bubble that would one day burst. Yellen should be passed over.
The Insider
This third argument also disqualifies Don Kohn, a Fed insider for the last 40 years. The Washington Post describes Kohn as “the consummate Fed veteran” and Alan Greenspan’s “right-hand man.”
Well, that pretty much eliminates him. When Alan Greenspan took over as Fed chairman, the US had a statutory debt limit of $2.8 trillion. Today, there is $16.8 trillion of US government debt – much of it accumulated during the 19 years while Alan Greenspan was in the chairman’s seat, with Don Kohn on his right side.
When Greenspan took his post at the Fed a total of about $250 billion of US debt was in foreign hands; today it is $5.6 trillion. Greenspan, with Kohn as his sidekick, blew up the debt that later blew up the US economy.
Then, after Greenspan left the Fed in 2006, Kohn kept at it. From The Washington Post: “He was Bernanke’s No. 2 during the financial crisis.” As his oft-repeated public comments make clear, Greenspan had no idea what was going on. Evidently, neither did Kohn.
The Washington Post also says he has “credentials as a crisis manager.” But the Fed reacted to the crisis like a crowd in a nightclub fire: It panicked.
Instead of allowing a credit crisis to smoke out the weakest debtors, it rushed in to save them all – offering them all more debt on better terms. Bankers who had made the biggest errors were left unpunished. Instead, they were rewarded with lower, Fed-guaranteed borrowing rates.
“You boys got yourself into a little trouble,” said the Fed cop on the beat. “But here’s a new Corvette… and a bottle of Jim Beam. Go have a good time.”
The Genius
As to Larry Summers, what can we say that isn’t already public record? That he blew up Harvard’s endowment is well documented. That he is “brilliant” is also beyond dispute. But that is the problem. Even Summers believes it.
“Brilliance” is defined in a description of Summers that also appears in The Washington Post:
You can bring him up to speed on anything in 15 minutes. And if you can be interesting enough to keep his attention for half an hour, he will start throwing out hypotheses and what-ifs and suggesting connections you would never have thought of.
The brilliant man has a brain that spots “connections.” These lead to “hypotheses” – visions of the future as it might be. As he becomes more brilliant, even God himself is dazzled. But in contrast to the deity, Summers is at an existential disadvantage: He has no idea what will happen next.
The wise man has an advantage over the brilliant man. Socrates himself pointed it out. Brilliant men think they know something. Socrates knew his limitations. He knew he know nothing.
Larry Summers is no Socrates…
More to come… including our surprising nomination for the top post at the Fed!
Regards,
![]()
Bill
Market Insight:
Turning Japanese?
From the desk of Chris Hunter
Whoever the next Fed chairman is, he will have his work cut out for him.
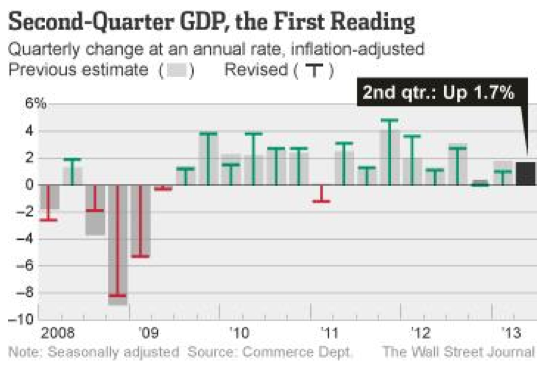
Second-quarter US GDP growth came in at just 1.7%. Stall speed, in other words. The only reason this is considered an improvement over the first quarter is that first-quarter growth was revised down to 1.1% from 1.8%.
The Fed is doing its best to compensate for the slowdown through the voodoo of monetary policy. But over the last five years, the US economy grew just 0.7%. That’s less than the 0.8% expansion Japan’s economy saw during its deflationary lost decades.
Take a look at this chart, which uses data from the Economic Cycles Research Institute.
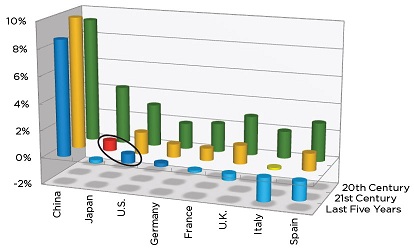
You’re looking at average yearly GDP growth for China, Japan, the US, Germany, France, Britain, Italy and Spain over three distinct periods – from 1Q 1980 to 1Q 2001 (green bars on chart), 1Q 2001 to 1Q 2013 (yellow) and 1Q 2008 to 1Q 2013 (blue). For Japan, the ECRI divided the periods to 2Q 1992, the lost decades (red) and the last five years.
As you can see, average 20th-century growth for the six major developed economies was significantly higher than in the first 13 years of the 21st century. And bar Italy and Spain, it as also significantly higher then it has been over the last five years (when central banks around the world were “stimulating” in unison).
Most disturbing is the obvious parallel between growth during Japan’s lost decades (circled red bar) and growth in the US (circled blue bar) in the last five years.
Over the last five years, the US grew just 0.7% – less than the 0.8% expansion Japan’s economy saw during its deflationary lost decades.
A bet on stocks now is largely a bet that central banks can overcome this structural slowdown with monetary intervention. But there is no evidence, so far, that the Fed has any influence over the real economy.
The track record over the past five years is proof of that…
-
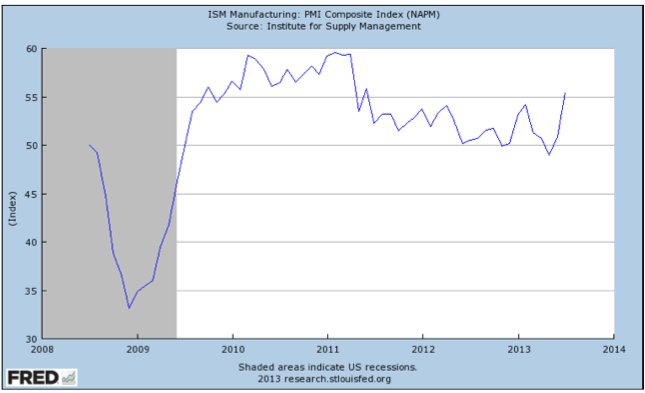
The ISM Manufacturing Index also exceeded estimates, delivering a reading of 55.4 – it’s highest reading since June 2011- indicating growth in the US manufacturing base
-
The overall numbers are good, but not great; today’s release of the non-farm payrolls data should help confirm whether or not the US recovery is set to continue and perhaps accelerate
-
If the economy does “find its legs”, higher interest rates are a given. What to do?
In light of the uncertainties surrounding global growth, the 1.7% Q2 GDP growth reading from the US earlier this week, was a welcome surprise. Estimates for growth were closer to 1.2%, so the upside has many now wondering if the US has turned a corner and better days are ahead.
The ISM Manufacturing Index (shown below), a widely watched gauge of manufacturing activity, topped economist estimates of 53.1 and blew past June’s reading of 50.9. In the report, new orders, production, employment, imports, and export orders all showed strength to varying degrees. Interestingly, delivery times were reportedly up as well – a sign of a clogged (read: increasingly active) supply chain.
I’ve discussed my preference for PMI and similar manufacturing-centric data, and looking at this type of data from not just the US, but other parts of the world – notably the Euro Zone – recently makes appear that manufacturing activity is accelerating.
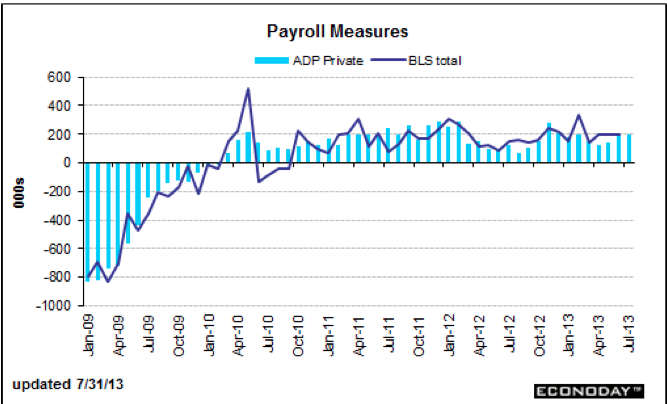
Additionally, the ADP Employment Report, typically a reliable precursor to the nonfarm payroll data, beat expectations of 179,000 new private sector jobs by showing a gain of 200,000. The June number was also revised upwards to show a gain of 198,000 private jobs. It’s important to remember that this report is only an estimate of data coming from 400,000 businesses employing approximately 23,000,000 citizens, so there can be wide variations from month to month when comparing the report to actual nonfarm data. Nevertheless, it has served to be a reliable indicator of what to expect from the “jobs number” and therefore many are expecting a positive surprise from this morning’s announcement.
Have We Turned the Corner?
Unfortunately, no. At least not yet. Though the initial Q2 GDP number came in above estimates, the Q1 number was revised lower to 1.1% (from 1.8%). Looking over the past nine months, the US economy has grown at .9% – hardly enough to get excited about.
The primary culprit appears to be the sting of sequestration, whose automatic spending cuts have clearly made themselves felt. I am not one to argue that government spending is the panacea for growth, but the absence of spending has clearly had an effect on US economic growth. Looking forward, the FT reports:
“On Tuesday, the non-partisan Congressional Budget Office said the sequestration will cost 900,000 jobs and .7% in GDP growth in the next year if it stays in place.”
Two other threats to growth later this year and into 2014 include the need for the US congress to come to terms on a budget for the 2014 fiscal year (in September) and the pending expiration of the debt ceiling – thought to be reckoned with (in November). A delay or outright refusal in resolving these two issues is a clear impediment to sustaining the economic recovery. Give the partisanship on display in the US Congress in recent years, the odds of speedy resolutions to the above issues are long, to say the least.
If the Economy Does Strengthen, Get Ready for Higher Interest Rates
An interesting takeaway from this week’s GDP report was the announcement that the Bureau of Economic Analysis (BEA), responsible for calculating GDP, has revised their data back to 1929. The BEA does this to “better reflect the evolving nature of the US economy.” This makes sense as the US economy grows and evolves to take account for changes in various factors like research and development of technology, for example.
Based on these revisions, there were two primary takeaways. First, GDP in Q1 2013 was revised higher by 3.4% totaling an increase of $551 billion. Essentially, we are wealthier than we were first led to believe – though it may not feel that way! Of course, this is only true if you trust the methodology the BEA uses to calculate GDP. There are several million US citizens out of work who would likely disagree with the BEA’s assessment.
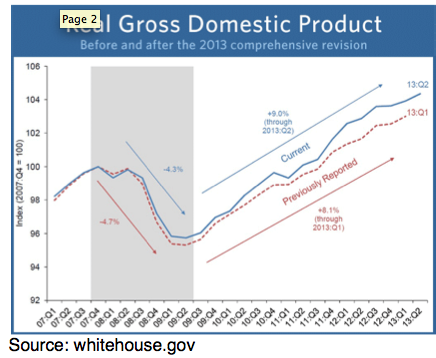
Second, as the chart shows above, the economic contraction during the Great Recession wasn’t as bad as we thought, and the resulting recovery has been stronger than reported. Again, this is likely to spark heated debate – and it should. During the recession, GDP fell by 4.3% versus a 4.7% initial drop and has risen by 9% since versus an 8.1% increase previously calculated.
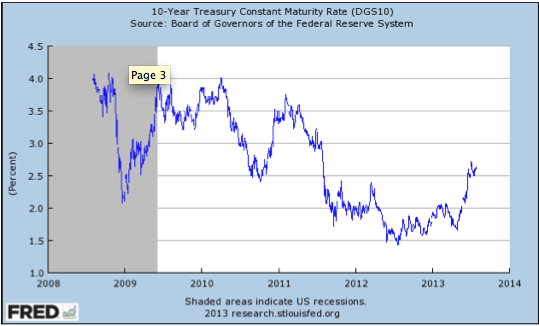
Debates aside, as the economy continues to recover it would appear that higher interest rates, a consequence of economic growth, are in the offing. The current US 10 Year Treasury yields 2.71%, versus 2.48% one month ago and 1.52% one year ago. It seems likely that the increase in yields is due to some degree to economic expansion and less so to Chairman Bernanke’s “taper talk”.
What to Do?
If higher interest rates are in the offing, what strategies should one employ to diversify from interest rate risk? Clearly, hard assets must play a role in your Discovery portfolio in a rising rate environment. Despite the downdraft in precious metals (gold and silver) prices, I still believe they can serve as a reliable and rational hedge against higher rates and the inflationary pressures higher rates imply.
Purchasing physical bullion seems to be preferable, but with the punishment that gold and silver miners have endured in recent months, buying cheap miners who can operate as the lowest cost producers is a prudent way to leverage the possibility of any increase in precious metals prices while hedging against higher interest rates. Billions of dollars in write downs are one indication that share prices may have bottomed and discipline in capital spending and operations can lead shares higher.
In light of this week’s economic data dump, it would appear that we may be at an inflection point, auguring higher interest rates. When the FOMC met earlier this week, the takeaway was that there would be no change in stated policy or rates. Given the economic numbers we’ve witnessed over the past five days, that stated policy may be about to change.
2. Quaterra Resources (QMM AMEX NYSE)
Quaterra (QMM) announced yesterday a $1 million non-dilutive cash infusion from Freeport McMoran (FCX NYSE). This is a long weekend in Canada so perhaps few will see this significant transaction.
Freeport paid Quaterra $1 million for the right to explore Butte. A small monetization but significant in this environment where money is hard to come by. Freeport may now explore the Butte complex and can, hopefully, take it to feasibility with drilling on the property. If so, QMM can take either a 70/30 working interest in the property (QMM 30%) or take a 2% royalty on the property.
We understand this is the third joint venture (JV) between Freeport and Quaterra, the others being the Utah’s South West Tintic and Cave Creek Moly potential in West Texas. Not many Juniors have 3 JVs with a major. Further Goldcorp owns 8% of Quaterra’s shares.
This $1 million non-dilutive contribution is significant to the company’s plans to move forward on its major target which is the Yerington copper property. We expect the company to focus on Yerington.
Terraco Gold’s Todd Hilditch also recently completed a largely non-dilutive $1 million deal. Please see Tuesday’s Morning Note for a description of this transaction by Terraco.
Ed Note: To Join the Mailing List to receive Discovery Investing Morning Notes apply HERE
The material herein is for informational purposes only and is not intended to and does not constitute the rendering of investment advice or the solicitation of an offer to buy securities. The foregoing discussion contains forward-looking statements within the meaning of the Private Securities Litigation Reform Act of 1995 (The Act). In particular when used in the preceding discussion the words “plan,” confident that, believe, scheduled, expect, or intend to, and similar conditional expressions are intended to identify forward-looking statements subject to the safe harbor created by the ACT. Such statements are subject to certain risks and uncertainties and actual results could differ materially from those expressed in any of the forward looking statements. Such risks and uncertainties include, but are not limited to future events and financial performance of the company which are inherently uncertain and actual events and / or results may differ materially. In addition we may review investments that are not registered in the U.S. We cannot attest to nor certify the correctness of any information in this note. Please consult your financial advisor and perform your own due diligence before considering any companies mentioned in this informational bulletin.

-
I know Mike is a very solid investor and respect his opinions very much. So if he says pay attention to this or that - I will.
~ Dale G.
-
I've started managing my own investments so view Michael's site as a one-stop shop from which to get information and perspectives.
~ Dave E.
-
Michael offers easy reading, honest, common sense information that anyone can use in a practical manner.
~ der_al.
-
A sane voice in a scrambled investment world.
~ Ed R.
Inside Edge Pro Contributors

Greg Weldon

Josef Schachter

Tyler Bollhorn

Ryan Irvine

Paul Beattie

Martin Straith

Patrick Ceresna

Mark Leibovit

James Thorne

Victor Adair