
Personal Finance
As far as I’m concerned, the only way to answer the question of which is the better investment between gold and the Dow Jones Industrial Index is to analyse the chart of the Dow expressed in gold. So, let’s do just that using the monthly and weekly charts of the Dow/Gold ratio.
Dow/Gold Monthly Chart
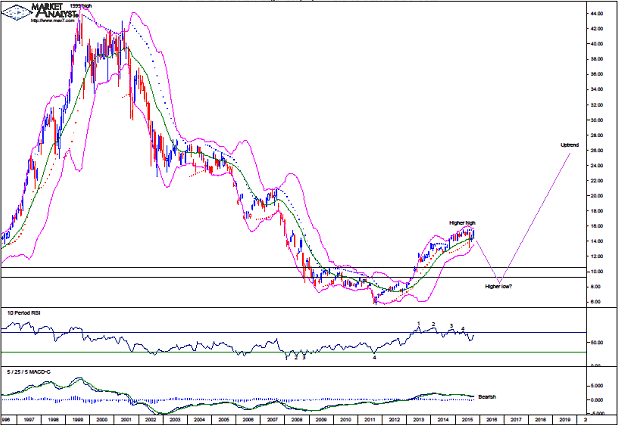
We can see the massive downtrend that was in place since the 1999 high of 43.92 until price bottomed in 2011 at 5.70. That is a solid gold smashing!
Price has been rising steadily for the last four years and has made a higher high after cracking above previous swing high levels which are denoted by the two horizontal lines. Now, all that is needed is for price to come back down and put in a higher low. Then the bull trend can really let loose.
Old tops often act as support in future and I expect price to now head down and test the support from the previous swing highs. I actually think price will nudge a bit below as it gives that support a thorough test.
The 2011 low was accompanied by a quadruple bullish divergence so it was no surprise to see a significant rise in price. However, the recent high at 15.56 was accompanied by a quadruple bearish divergence so perhaps the multi-year leg up is now in need of a break and a significant correction is set to occur.
The MACD indicator is bearish.
The Bollinger Bands show price bouncing back up just above the lower band with price now a touch above the middle band. It is not uncommon to see some toing and froing between the bands during trend changes.
The PSAR indicator has a bearish bias with the dots above price.
Now, this chart of mine only has relevant data going back to the mid 70’s but using data from a much longer time period shows a massive megaphone top pattern. I find these patterns are generally nonsense and are given too much publicity by those with suspect knowledge of the technicals predicting doom and gloom. Price heading up now and cracking to new highs would invalidate the megaphone pattern and that is my expectation.
Let’s move on to the weekly chart.
Dow/Gold Weekly Chart
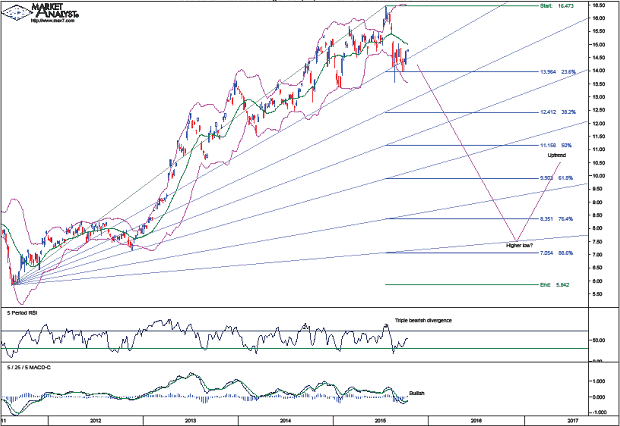
The RSI showed a triple bearish divergence at the recent price high.
The MACD indicator is currently bullish but it doesn’t look overly convincing coming on the back of a solid move down.
The Bollinger Bands show price finding support at the lower band and now being around the middle band. If a significant correction is indeed about to take place then I would expect to see price move back to the lower band and hug it as the downtrend takes hold.
I have added Fibonacci retracement levels of this initial move up. The first correction in a new bull trend often makes a deep retracement and I am targeting the 76.4% level of 8.35 as the minimum with the 88.6% level of 7.05 also a chance. Perhaps somewhere in between.
I have drawn a Fibonacci Fan and I am targeting the low to be around support from the 88.6% angle which looks set to be in between of the aforementioned retracement levels in late 2016 and early 2017.
So, let’s come back to the question of which is the better investment – gold or the Dow? My analysis leads me to believe that, over the next year or so, gold will be a better investment. However, over the longer term, the Dow should prove to be a much better investment by far!


Precious Metals
Precious on, precious off. It is just one darned thing after another.
The September 17th ChartWorks called for gold to rally to 1145 to 1185 window. From the 1110 level the rise made it to 1156 on Thursday. The September 20th review of the COT number conclude not to look for too much endurance on the rally. (The following is part of Pivotal Events that was published for our subscribers September 29, 2015)
Gold stocks (HUI) popped from 101 to 118. As with the August rally, the declining 50- Day ma ended the move. The 104 to 105 level has provided support five times since early August.
While this level may seem like longer-term resistance, gold stocks have been underperforming relative to the bullion price. Stability is needed.
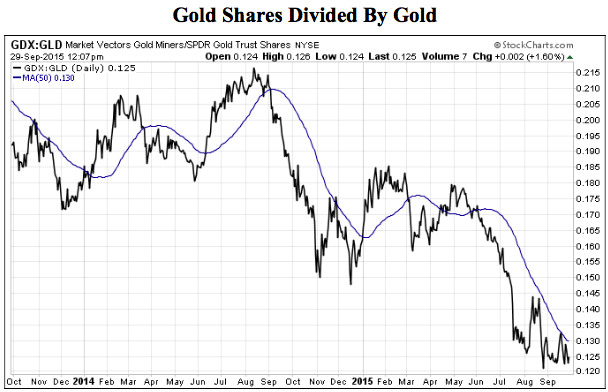
The key low for GDX/GLD index was 120 on August 24th and the bounce was to the 50- Day at 135. Last week’s low was 122 and today it is at 125. This, with the low of 119 in between, seems constructive.
Let’s call it near-term stability. The declining 50-Day ma has been daunting, but it is beginning to flatten. This indicator rising through the moving average would be a positive step.
Another way of looking at it is through the GDX/SPX. This index has plunged from 572 in 2011 to 62 in early August. The rebound high was 82 and the next low was 64 in the middle of September. The last decline found support at the 50-Day and this week’s trade is above the line. The moving average is beginning to flatten, which is constructive.
At 72, rising above 75 would be positive.
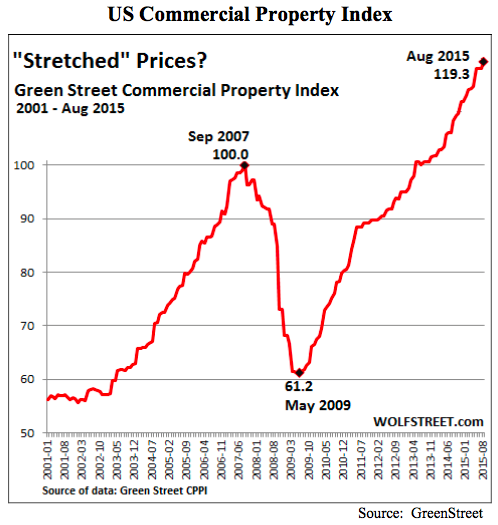
- Commodity bulls have been expecting a “Super Cycle”.
- It seems to have appeared in commercial property.
- How long will it last?
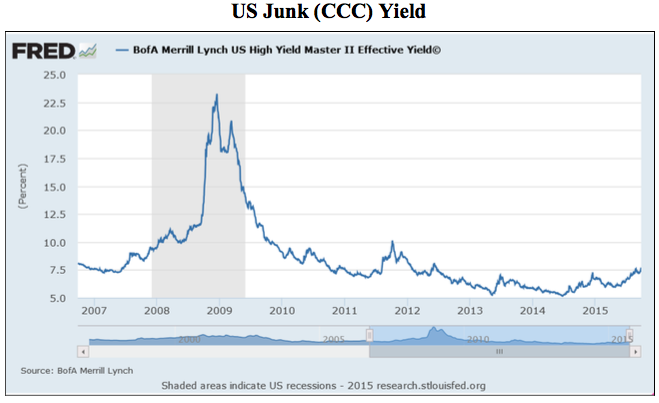
- The simple view is that the trend of rising yields has accomplished the second breakout from a cyclical low.
- This could be equivalent to the second breakout accomplished at 9.22% on November 16, 2007. Some three weeks after the high for the S&P.
- This breakout was set at 7.71% on Friday. It is now at 7.98%.
- The high on the last crisis was 23.26% set on December 15, 2008.
- Rising through the 50-Day moving average has been positive for the sector.
- The index is at 126, the 50-Day is flattening at 130.
- This is constructive, but not yet positive.
Link to September 29, 2015 Bob Hoye interview on TalkDigitalNetwork.com:
http://talkdigitalnetwork.com/2015/10/credit-spreads-becoming-dramatic/
BOB HOYE, INSTITUTIONAL ADVISORS
E-MAIL bhoye.institutionaladvisors@telus.net
WEBSITE: www.institutionaladvisors.com
Listen to the Bob Hoye Podcast every Friday afternoon at TalkDigitalNetwork.com

Strengths
- Platinum was the best performing precious metal, bouncing back 7.95 percent, as palladium took a backseat this week. Traders had speculated that the Volkswagen’s emissions scandal might lead to increased demand for palladium should auto buyers shun diesel powered vehicles in favor of autos powered by gasoline engines that use more palladium in their catalytic converters.
- Gold traders are the most bullish in three weeks on expectations that the Fed will hold off from raising interest rates until next year. The weak employment report last week ignited the recent rally which was buoyed this week by the release of the Fed’s September FOMC meeting notes which had a dovish tone. Gold advanced to a six-week high.
- China may have further increased central bank gold holdings in September, raising them by about 15 metric tons to 1,709 tons, as it seeks to diversify its foreign exchange reserves. China announced increases of about 19 tons for July and 16 tons for August after disclosing on July 17 that holdings had jumped by 57 percent since 2009. China has been reporting the value and tonnage of gold reserves monthly in a shift toward greater transparency as it promotes the global role of the yuan and seeks to join the IMF’s currency basket. Another recent positive aspect has been the signs of strength in the gold market even in the absence of Chinese physical demand with the markets closed there for the 7-day Autumn Golden Week holiday.
Weaknesses
- Despite this week perhaps being a turning point for gold, it rose the least out of all the precious metals. Perhaps the week long holiday in China may have kept some buyers from bidding the market up higher.
- Kinross Gold announced it is under investigation in the U.S. by the SEC and the Department of Justice about improper payments at West African facilities involving allegations that first arose in 2013 and the company was already investigating. The company received subpoenas requesting records of communications and payments to officials and contractors at the miner’s operations in Mauritania and Ghana.
- Cornerstone Macro’s Carter Worth sees gold rising as weakness stopped “almost precisely” at the 50 percent retracement of the rally from $257/oz in 2001 to $1,920 in 2011. For stocks overall, he rejects the idea that the S&P 500 has successfully retested the August low. He said overall equities are under duress and headed lower given 44 percent of stocks in the S&P 500 have undercut their August 24 lows even though the index has not.
Opportunities

- The recent uptrend in gold could mean a positive full-year return by year end. According to Capital Economics, the headwinds for gold could be behind us, pointing to tighter labor markets and perhaps even inflation. Their report notes that inflation should snap back in most economies over the next few months as the big falls in oil prices in late 2014 drop out of the annual comparison. Their 2016 year end forecast is $1,400/oz.
- Klondex provided an update on its Midas exploration drill program with notable intersections of multi-ounce per ton grades. Interestingly, within the results was a non-vein intercept of 115 feet with an average grade of 2.3 g/t. This drilling has revealed a very different style of mineralization south of the Midas bonanza veins that have been mined to date. The new area is highly oxidized and while the grade is lower than at other drill locations, the breadth of the intersection creates the potential for substantial quantities of bulk ore to be mined should there be a surface scenario such as an open pit.
- Comstock Mining reported significant drill intercepts at its Dayton Resource Area. The program, which consisted of 408 holes totaling 30,818 feet of drilling, resulted in several important discoveries, including defining multiple, previously undefined mineralized zones and additional dike-like masses of quartz porphyry. Separately, Integra Gold announced the discovery of new gold bearing zones at Lamaque South, including 22.64 g/t over 2.59 meters at No. 6 vein. This should further pique the interest of Eldorado Gold which recently purchased nearly 15 percent of the company.
Threats
- According to Ruchir Sharma, who helps manage $25 billion as head of emerging markets at Morgan Stanley Investment Management, investors need to brace for a “long winter” with the commodities bear market predicted to last for many years and oil dropping to as low as $35 per barrel. Goldman Sachs has an even dimmer outlook. They said the odds are increasing that oil will slump near $20 because the market is more oversupplied than initially forecast. The investment bank also said prices could stay low for as long as 15 years.
- Gold imports by India, the world’s second-biggest consumer, dropped 52 percent last month after shipments had surged in August. Shipments jumped in August as jewelers stocked up to meet a surge in demand during the festival and wedding season that started this month. The lack of investment demand is a cause for concern given the negative sentiment towards the asset class.
- The Environmental Protection Agency appears to have rushed to judgment when it decided to preemptively block a proposed mine from being built near Alaska’s Bristol Bay, according to a yearlong review of the case by former Defense Secretary William Cohen. Cohen noted that the agency was “not fair” in its decision to rule out gold mining in the region before the developers had even applied for permits to build the mine.
“Is there a cycle — or combination of cycles — that, due to patterns deeply embedded in history, come together in the tenth month more often than mere chance would dictate?
Consider some of the most salient Octobers of the 20th and 21st centuries, and then make up your own mind” – Martin D. Weiss Ph.D
October 1907 — Panic of ’07. A major bond offering by New York City fails … the copper market collapses … Standard Oil is slammed with a massive $29 million fine for antitrust violations … and stocks plunge.
On October 22, Knickerbocker Trust, the second-largest trust company in the United States, is forced to suspend operations, triggering an especially intense wave of fear on Wall Street plus massive cash withdrawals from New York banks.
The U.S. Federal Reserve does not yet exist. But J.P. Morgan steps in to play the role of lender of last resort, injecting liquidity into financial markets by buying up bonds, orchestrating multimillion loans, and preventing a wholesale collapse in the economic system.
 October 1912 — Balkan War, prelude to World War I. Exactly five years later, it’s Europe’s turn to plunge into crisis, leading to the First Balkan War.
The Ottoman Empire has been encouraging Muslim populations of Bosnia to join the Empire and move to districts of northern Macedonia to restore the number of Muslims in the region. Meanwhile, Muslim immigrants join Albanian Muslims in a series of uprisings.
Peter the First of Serbia issues a declaration in support for Serbian and Albanian Christians living under Ottoman rule, declaring that his army will “join the Holy War to free our brethren.” Soon Montenegro, Bulgaria, Serbia and Greece declare war on the Ottomans.
The events foreshadow World War I, ultimately claiming the lives of more than 16 million soldiers and civilians.
October 1918 — influenza pandemic. This is the deadliest month of the deadliest pandemic in history, with a record 195,000 Americans succumbing to influenza in just 31 days. Before it’s all over, 50 to 100 million people are killed and 500 million are infected worldwide.
 October 1922 — fascism in Italy. On October 25, Benito Mussolini celebrates the close of his Fascist Party Congress in Naples. On October 27, he embarks on his historic March of the Blackshirts on Rome. On October 28, he seizes power. And on October 29, he’s named Foreign Minister, Interior Minister and Prime Minister of Italy.
October 1923 — German hyperinflation. Prices in Germany are rising at the most rapid pace of almost any month in history, driving the value of the German mark down to more than four trillion to the dollar. Making matters worse, separatists and communist movements in Germany spread to Bavaria and Saxony.
 October 1929 — Crash of ’29. This month delivers more than just the Black Thursday of October 24, when the Dow loses 11% of its value. It’s also the month of Black Monday (October 28, when the Dow falls 13%) … and of Black Tuesday of October 29 (Dow down 12%) … followed by the deepest bear market in U.S. history.
…..read about the 10 other significant October events during the balance of the 20th Century and into the 21st Century HERE


-
I know Mike is a very solid investor and respect his opinions very much. So if he says pay attention to this or that - I will.
~ Dale G.
-
I've started managing my own investments so view Michael's site as a one-stop shop from which to get information and perspectives.
~ Dave E.
-
Michael offers easy reading, honest, common sense information that anyone can use in a practical manner.
~ der_al.
-
A sane voice in a scrambled investment world.
~ Ed R.
Inside Edge Pro Contributors

Greg Weldon

Josef Schachter

Tyler Bollhorn

Ryan Irvine

Paul Beattie

Martin Straith

Patrick Ceresna

Mark Leibovit

James Thorne

Victor Adair