
Stocks & Equities
 Investors can generally be categorized into different groups based on the strategies they use. At a very high level, the main strategy divide is between fundamental investing and technical investing. Put simply, fundamental investors look at the investment merits of the actual company they are buying, including earnings, growth, assets, debt and industry outlook. Technical investors, on the other hand, often pay no attention to the company, but rather analyze the stock’s chart patterns, price and volume movements.
Within the fundamentalist category there exist further divisions. The two key types of fundamental investment strategies are growth and value. As the name implies, growth investors look to find companies that have high revenue and earnings growth rates which can presumably be sustained over an extended period. This type of investor believes that revenue and earnings growth drive share price appreciation. The criticism of this strategy is that growth investors are often willing to pay obscenely high valuations in order to buy the company’s with the highest growth rates. On the other side of the spectrum are value investors who want to find companies that they can purchase at a bargain on a price-to-earnings or price-to-cash flow basis. This type of investor believes that investment return will either be a function of valuation expansion or through the receipt of free cash flow (likely in the form of dividends) generated by the company. The main criticism here is that value investors may purchase lower quality companies in an effort to obtain what they view as a bargain.
Each of these two strategies has its strengths and its weaknesses. Pure growth investing in particular seems to lure most investors due the appeal of “market confirmation.” Companies with high growth rates tend to go up in price (at least for a while) and a rising share price is often viewed as evidence of a quality investment. In hindsight, of course this is the case as a rising share price does equate to investment return. But the decision to buy or continue to hold a stock depends on what the investor believes the company will do in the future and not what it has done in the past. The main problem with growth investing, as we see it, is that high growth companies often trade at very high multiples to earnings and cash flow (valuations) which reflect an expectation from the market that this growth will continue or even accelerate. Often these expectations are overzealous. There is a saying in the market, “companies that have gone up in price have a tendency to continue to go up in price.”We heard this statement repeated a lot by so called financial professionals, but anyone who actually believes it would have very little credibility with us. We prefer an adapted version, “sometimes companies that have gone up in price continue to go up and sometimes they come crashing down.” The latter happens to even high-quality companies when investor expectations (valuations) get so high that even a slight deviation from the growth trend or setback in the corporate strategy can result in a massive downward revaluation of the stock.
Recent market volatility has provided us with numerous examples of these types of stocks. Let’s take a look at the once beloved Avigilon Corp (AVO). A few years ago this was a highly touted growth stock and at the height of its market success, the company achieved a lofty valuation multiple of over 70 times earnings (price-to-earnings). It was not surprising to us that it was at this point that the company garnered most o f its attention and praise. But very few companies can sustain a growth rate of 200% per year and in spite the fact that Avigilon’s earnings have continued to grow a very solid double digit rate since hitting its peak valuation less than 2 years ago, the stock has since lost over 60% of its value and now trades at about 16 times earnings. This is not a reflection of the market’s apathy towards profitability and earnings growth. It is a revaluation of a company that in spite of continued success with respect to earnings growth has fallen out of favour with the market because it was once so highly overvalued and encountered a setback.
Just in the past few weeks, two very prized Canadian pharmaceutical companies, Valeant Pharmaceuticals (VRX) and Concordia Healthcare (CXR), had their own doses of reality. As of the beginning of September, these giants posted 12 months share gains of 140% and 210%, respectively, and commanded valuations above 30 times earnings. The growth trend appeared to justify the premium multiple, but it didn’t take more than a couple of words of concern over pricing practices from U.S. Presidential Hopeful, Hillary Clinton, to send these stocks falling. In less than 6 weeks, Valeant has dropped 25% and Concordia has dropped 55%. Clearly there are some outside forces at work here and these companies may one day regain their luster. The lesson here is that high valuations often indicate that the market is not factoring in the full risk profile of the company but rather focusing on the best case scenario.
A few others include Patient Home Monitoring (PHM) which lost 70% of its value since April, AutoCanada (ACQ) which lost 65% of its value since hitting its peak a year ago, Sylogist (SYZ) who’s share price has been nearly cut in half in less than a year, and Nobilis Health Corp (NHC) who’s share just declined 27% in a single day, apparently as a result of a negative article on a popular investing site. These are just a few recent examples of some very highly touted, high valuation companies that were re-valued quickly in spite of overall fundamentals and earnings remaining more or less intact. In some cases, these particular companies continue to trade at high valuations. For others, the valuation has become more reasonable and now may be the time to start looking at them as solid investments.
Within fundamental investing, there is a third strategy category that recognizes the strengths of growth and value investing, while also trying to mitigate the weaknesses. This third strategy is called GARP or growth at a reasonable price. Like the growth investor, the GARP practitioner seeks to identify high-quality companies with attractive growth rates. However, unlike the growth investor, the GARP practitioner is still price sensitive while purchasing companies and avoids those stocks with very lofty valuations. Generally speaking, GARP is not as price sensitive as pure value investing and is willing to pay a higher valuation for attractive earnings growth, as long as the valuation lies within a reasonable range.
|
KeyStone’s Latest Reports Section 10/9/2015 |


After weeks of floundering in the mid-$40s per barrel, a new rally for crude oil got underway this week. WTI jumped to $50 per barrel and Brent is now over $53 per barrel. There are several reasons behind the rally, some of which we have touched on before. U.S. oil production is declining, despite confusing weekly data from the EIA that sometimes suggests otherwise. The rig count fell sharply last week, which underpinned the notion that the sector is contracting.
November Crude Oil futures opened the week higher and never looked back. This week’s rally was triggered by a technical chart pattern and fueled by a number of fundamental events.
The conditions for the rally started to build on Friday, October 2. On that day, data was released showing a weekly drop in the number of active U.S. drilling rigs to their lowest level in more than 5 years.
Oil was drifting lower into the release of the rig data from Baker Hughes Inc. A weaker-than-expected U.S. Non-Farm Payrolls report early Friday was the catalyst behind the weakness since it signaled the potential for weaker energy demand, pushing prices lower.
According to Baker Hughes, the active rig count fell by 26 to 614 as of October 2. The total active rig count, which includes natural gas, fell 29 rigs to 809. With the lowest overall rig count since 2002, traders described the “big drop” as “definitely bullish.”
Some energy economists went as far as saying that the low rig count is an indicator of limited capital for drilling this quarter. Another potentially bullish occurrence.
The weaker-than-expected U.S. jobs report was perceived as bearish to oil prices initially. This was because it could lead to a drop in incremental demand growth, leaving the market with flat-demand into mid-2016. However, losses were limited because the U.S. Dollar dropped on the news, leading to speculation that foreign demand would increase.
The market received a boost over the weekend, leading to a strong opening on October 5 after Saudi Arabia cut pricing for November oil sales to Asia and the U.S. as the world’s largest crude oil exporter sought to keep its supply competitive with rival suppliers amid sluggish demand.
Traders reacted positively at the start of the week to the Saudi price cut, the drop in the rig count and speculation that China was preparing to implement additional stimulus. Global equity markets also strengthened along with commodity-linked currencies and severely oversold commodity markets. Demand for risky assets increased, underpinning crude prices.
Russia came into the crude oil picture this past week. Firstly, it started bombing ISIS positions in Syria, helping to put a slight speculative bid under the market. Secondly, it said it would not cut-back from huge crude output levels that have helped drive prices lower. Russia also came out strongly against rumors that it was preparing to join OPEC, with an analyst stating “there is no possibility of Russia cooperating with OPEC to manage supply and there is zero possibility of Russia ever joining OPEC.”
Speculators chose to ignore this last statement as the market rallied early this week after Russia said it was ready to meet with other producers to discuss the market. Russia also set up a separate meeting with Saudi officials at the end of October.
Prices were supported by the news of the Russian meeting with OPEC and Saudi Arabia. While speculators believe these talks may lead to a cut in output, several analysts stated that the geopolitical tension created by Russian cooperation with Syria probably means OPEC will not agree to any production cuts. Nonetheless, speculators liked the news and shorts were worried enough about the possibility of cooperation between the Russians and the Saudis to cut positions.
In summary, traders chose to ignore this week’s potentially bearish U.S. Energy Information Administration’s weekly crude oil inventories report. Instead they decided that Russian willingness to cooperate with OPEC and the weaker U.S. Dollar are reasons enough to speculate on the long side of the market.

Crude oil is currently being supported by a bullish chart pattern on the daily chart and a potentially bullish chart pattern on the weekly.
The daily chart turned bullish during the week-ending October 2 when prices crossed to the bullish side of a long-term downtrending angle. Buy stops were hit and speculative buyers came in to drive the market to the bullish side of the angle near $44.28.
The market accelerated to the upside when the swing top at $47.10 was taken out with conviction. If the upside momentum continues then look for the rally to extend into the next major top at $50.04. This is followed by a major 50% level at $50.69.
The 50% level at $50.69 shows up on both the daily and weekly charts. Trader reaction to this price is likely to determine the direction of the market over the near-term.
Crossing to the bullish side of this level will signal the presence of buyers. This could fuel a rally into $53.56. A failure to overcome $50.69 will indicate the presence of sellers. This could lead to a retracement back to $44.28 over the near-term.
Watch the price action and read the order flow at $50.69 this week, if tested. Trader reaction to this level will tell us whether the bulls or the bears are in control.

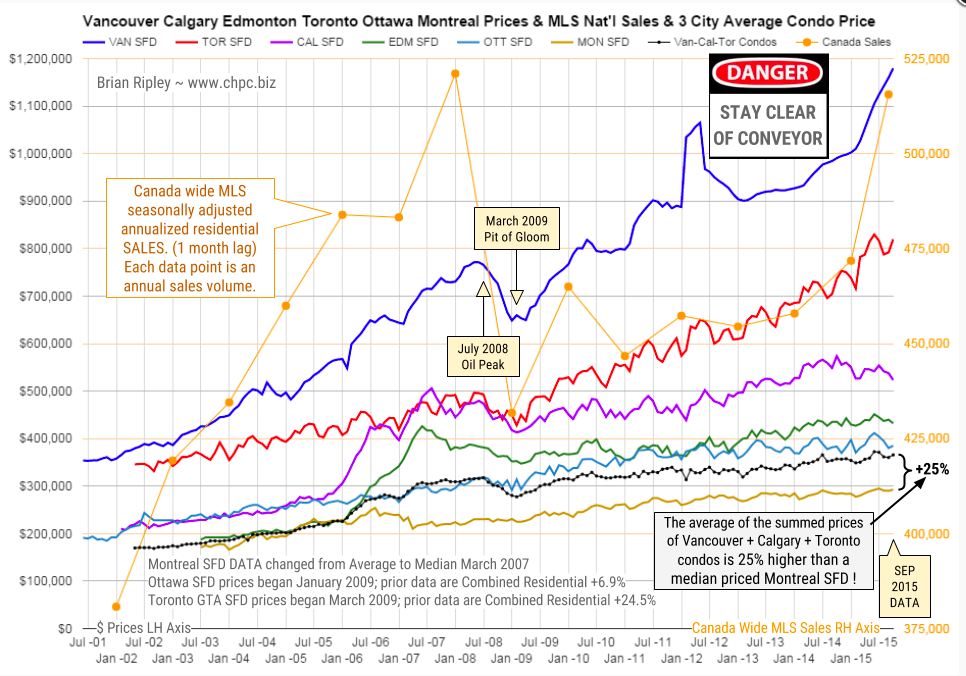
The chart above shows the average detached housing prices for Vancouver, Calgary, Edmonton, Toronto*, Ottawa* and Montréal* (the six Canadian cities with over a million people) as well as the average of the sum of Vancouver, Calgary and Toronto condo (apartment) prices on the left axis. On the right axis is the seasonally adjusted annualized rate (SAAR) of MLS® Residential Sales across Canada (one month lag).
Go HERE for analysis and a larger chart
Go HERE for the the PLUNGE-O-METER, which tracks the dollar and percentage losses from the peak and projects when prices might find support.

 In the Q&A below, Peter Grandich asks Paul about his (that is, Paul’s) conversion from a belief in active security selection to strategic indexing via the index mutual funds of Dimensional Fund Advisors (DFA).
Yes, mutual funds, not ETFs. As you will see in the interview, the pair certainly sing the praises of this “best-kept secret” … CLICK HERE to read the complete article
 Updated with 2015 rates
Canada Pension Plan (CPP) is one of the cornerstones of retirement income planning. Here are the maximum benefits at age 65:
- 2015 – $1,065.00 per month
- 2014 – $1,038.33 per month
- 2013 – $1,012.50 per month
- 2012 – $986.67 per month
- 2011 – $960.00 per month
- 2010 – $934.17 per month
- 2009 – $908.75 per month
Don’t count on the maximum
When planning for retirement, the first piece of advice I give is not to plan on getting the maximum. When you look at the average payout of CPP, it’s just a little over $550 per month, which is a long way from the maximum. In other words, not everyone gets the maximum. At the most basic level, the amount you get from CPP depends on how much you put into CPP.
The best way to figure out how much CPP you qualify for is to get your CPP statement of contributions. Call Service Canada 1-800-277-9914 and ask for a CPP Statement of Contributions. They will provide you with access to your online statement.
How to get the maximum?
Why is it that so many people do not qualify for the maximum amount of CPP? The best way to answer that is to look at how you get the maximum retirement benefit. Eligibility to receive the maximum CPP benefit is based on meeting 2 criteria:
- Contributions – The first criteria is you must contribute into CPP for at least 83% of the time that you are eligible to contribute. Essentially, you are eligible to contribute to CPP from the age of 18 to 65, which is 47 years. 83% of 47 years is 39 years. Thus, the way I like to look at CPP is on a 39-point system. If you did not contribute into CPP for at least 39 years between the ages of 18 to 65, then you won’t get the maximum. If so, then you might get the maximum but there is another consideration.
- Amount of contributions – Every year you work and contribute to CPP between the age of 18 and 65, you add to your benefit. To qualify for the maximum, you must not only contribute to CPP for 39 years but you must also contribute ‘enough’ in each of those years. CPP uses something called the Yearly Maximum Pensionable Earnings (YMPE) to determine whether you contributed enough. Here’s the YMPE figures for the current and past years:
- 2015 – $53,600
- 2014 – $52,500
- 2013 – $51,100
- 2012 – $50,100
- 2011 – $48,300
- 2010 – $47,200
- 2009 – $46,300.
Related article: New CPP Rules are here
The easiest way to figure out your CPP eligibility is simply get your CPP statement of contributions. Once you have that document, it will list all the years you are eligible to contribute from age 18 to 65. It will show you how much you contributed in each of those years. If you contributed the maximum, it will have the letter ‘M” assigned for that year. All you have to do is add up all the M’s to see if you are eligible for the maximum. If you have 39 M’s you’ll get the maximum. If you have 20 M’s you will get approximately half the maximum (you might get some partial credits for part years).
Planning your retirement needs and income requires some understanding of how much you will get from CPP. Many people either assume they will get the maximum or assume they will get nothing at all because they fear the benefit may not be there in the future. Both these assumptions have significant flaws. Take the time to personalize the planning by understanding how the CPP benefit is calculated and how much you will receive.
Here’s an article give you a more detailed calculation on How to Calculate Your CPP Retirement Pension
For more information on CPP and other government benefits, check out my ONLINE GUIDE to CPP And OAS


-
I know Mike is a very solid investor and respect his opinions very much. So if he says pay attention to this or that - I will.
~ Dale G.
-
I've started managing my own investments so view Michael's site as a one-stop shop from which to get information and perspectives.
~ Dave E.
-
Michael offers easy reading, honest, common sense information that anyone can use in a practical manner.
~ der_al.
-
A sane voice in a scrambled investment world.
~ Ed R.
Inside Edge Pro Contributors

Greg Weldon

Josef Schachter

Tyler Bollhorn

Ryan Irvine

Paul Beattie

Martin Straith

Patrick Ceresna

Mark Leibovit

James Thorne

Victor Adair