
Energy & Commodities
I hope you followed my suggestions in last week’s column concerning gold and silver. If you did, you should be sitting pretty. Gold has plunged as much as $42.70, or 3.2 percent in just a week.
Silver, platinum and palladium are also getting hit, just as I warned, with more losses to come.
But that should be music to your ears. Why?
Because that is how bull markets are built. They climb higher, then selloff, then climb higher yet again. Rarely, if ever, do real bull markets go straight up (or real bear markets go straight down).
It’s just one of those things that most investors never understand, mentally or emotionally.
And it’s one of those things that even most traders don’t figure out, because most of them don’t have the necessary experience especially with their own money on the line.
To me, a trader is not a trader unless they have had at least 15 years’ experience with their own money on the line. Anything short of that is a rookie.
But that’s beside the point for today. There is more carnage coming in the precious metals — and it’s already causing the next crash in the mining sector.
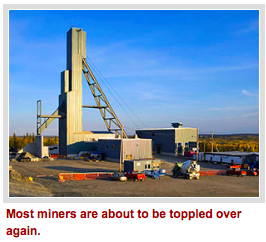 Yes, you heard that right. With very rare exceptions, most miners are about to be toppled over again. They’re likely to give up as much as 100% of their recent gains, if not more.
But also keep in mind what I said last week and in other published works: It is never the first move up that determines whether or not you are looking at a real bull market.
Instead, what is almost always the all-determining factor is the first pullback.
How much does it pullback? How fast does it pullback? What is the pattern of the pullback? Are previous resistance levels now becoming support?
Price fluctuates, all the time. Thing is, most analysts, investors and traders do not have the patience, objectivity, or experience to analyze price — the language of the market — no less the timing element …
Which is precisely why the majority of investors, traders and analyst are wrong the majority of the time.
Am I tooting my own horn? I guess I am, in a way, and pardon me for doing so. But I am sick and tired of all the inexperienced analysts and talking heads who are out there … and how much money it costs innocent investors.
I’m not always right either, but over time, my track record is considered by many to be unparalleled. Especially in the precious metals and mining sector.
How important is the first pullback? Well, just consider the following:
![]() It was the first pullback that allowed me to be one of the first, if not THE first, to predict the great 11-year-long bull market in gold way back in 2000.
It was the first pullback that allowed me to be one of the first, if not THE first, to predict the great 11-year-long bull market in gold way back in 2000.
That empowered me to accurately call virtually every major turn in the precious metals market since then …
![]() Including gold’s major pullback in 2008, when I screamed buy, buy, buy, just before gold took off from $650 to $1,921!
Including gold’s major pullback in 2008, when I screamed buy, buy, buy, just before gold took off from $650 to $1,921!
![]() And that also gave me the ability to warn you that a failed rally attempt in September 2011 signaled a brand new bear market for gold, just two weeks after gold hit $1,921!
And that also gave me the ability to warn you that a failed rally attempt in September 2011 signaled a brand new bear market for gold, just two weeks after gold hit $1,921!
Analyzing the first pullback that comes after a major rally … or, conversely, the first rally in a potential new bear market …
Is a major component of the many models I use. So you can bet your bottom that I am watching the metals — and the miners — like a hawk right now.
Because if the pullbacks pan out as I expect them to, then I’m going to be all over many of the best remaining miners in the world for my subscribers, with companies such as …
Miner A: This core, diversified portfolio includes companies like this, a senior miner with over 90 million ounces of proven gold reserves.
At a gold price of $1,250, that’s an asset base of more than $118 billion.
What’s more, buying shares in this company gives you great leverage on the price of gold. It’s almost like buying gold at just $15.51 an ounce — at an 98.73% discount to today’s gold price.
My year 2020 target: An easy quadruple.
Miner B: Another gem of a miner I’ll soon be recommending has only about 9 million ounces in gold reserves, yet those reserves are currently valued at a mere $1.66 per ounce!
Talk about leverage. When you buy this producing senior miner you are effectively paying $1.66 per ounce of gold, a whopping 99.86% discount from today’s gold price.
My year 2020 target: A quintuple.
And that’s just for starters.
In fact, if you are a Real Wealth member, you’ll be getting the details on these two miners in the March issue, publishing on Friday, March 18.
Until next week, best wishes,
Larry
Larry Edelson, one of the world’s foremost experts on gold and precious metals, is the editor of Real Wealth Report and Supercycle Trader.
Larry has called the ups and downs in the gold market time and again. As a result, he is often called upon by the media for his investing views. Larry has been featured on Bloomberg, Reuters and CNBC as well as The New York Times and New York Sun.

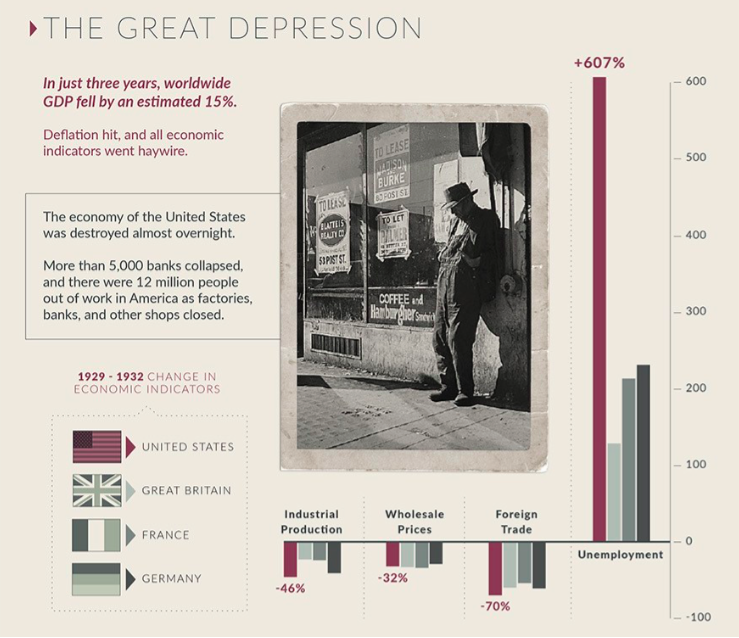 The economy of the United States was destroyed almost overnight.
More than 5,000 banks collapsed, and there were 12 million people out of work in America as factories, banks, and other shops closed.
Many reasons have been supplied by the different economic camps for the cause of the Great Depression, which we reviewed in the first part of this series.
Regardless of the causes, the combination of deflationary pressures and a collapsing economy created one of the most desperate and miserable eras of American history. The resulting aftermath was so bad, that almost every future Central Bank policy would be designed primarily to combat such deflation.
…view and read more HERE

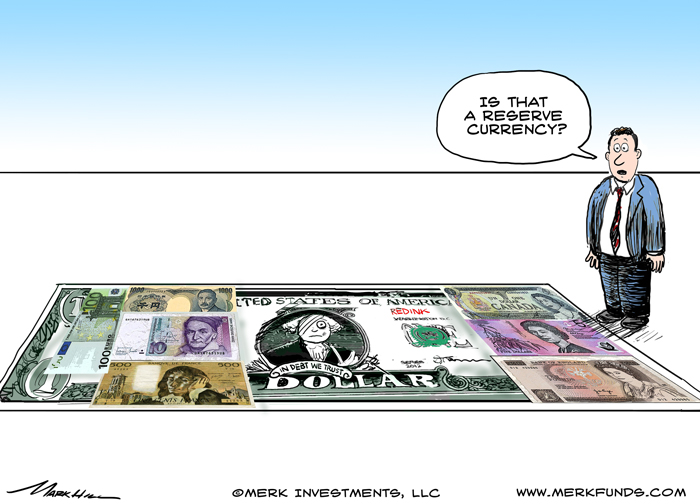
Is the dollar’s seemingly relentless rise in recent years coming to an end? What are the implications not only for the greenback, but other currencies and markets around the world?
The chart below shows the U.S. dollar index over the past 40 years together with its longer term moving average, as well as 1 and 2 standard deviation bands. To some the chart may suggest that exchange rates are mean reverting; some will see a longer-term declining trend in the dollar; others will point to what may be considered an extreme valuation given that the dollar index has been around 2 standard deviations above its moving average. To us, the fact that the dollar has moved so far from its moving average, gives rise to the question whether the dollar rally may be over. Let’s consider some arguments for and against ‘peak dollar’: 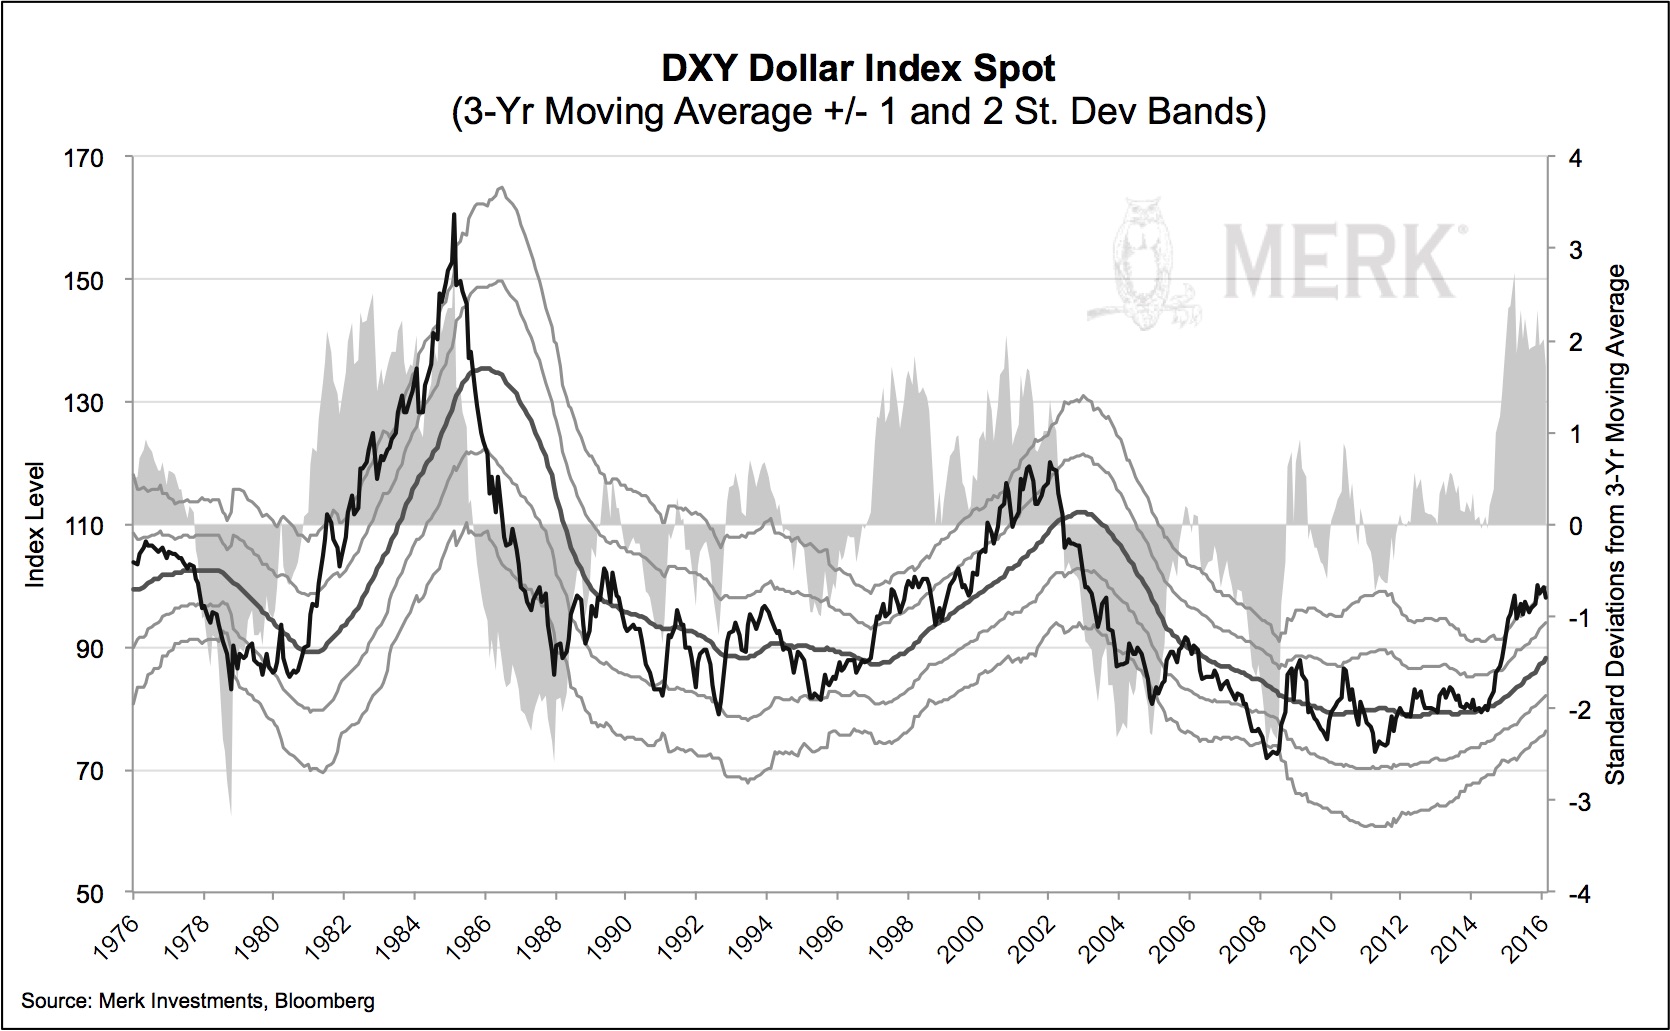
U.S. rate hikes?
It’s widely anticipated that the Fed will continue to raise interest rates. So why would the dollar not rise? It turns out that we have been told for years now that the Fed will ‘exit’ from its extraordinarily accommodative policy. In our analysis, the U.S. dollar historically appreciates in anticipation of a hiking cycle, but not necessarily as rates actually move higher.
Rate differentials
What about rate differentials? The European Central Bank (ECB) just lowered rates again. While all else equal, a high interest rate differential may benefit the higher yielding currency, all else is rarely equal. Betting on such rate differentials is also referred to as a ‘carry trade’ strategy. In our analysis, carry trade strategies tend to perform well in ‘risk on’ environments, i.e. in environments when equities and other ‘risk assets’ do well. Let’s pause to reflect that the U.S. dollar historically is considered a ‘safe haven’ when there is a ‘flight to quality.’ Remember 2008, when the dollar was widely considered the ‘only safe place in town’? Well, the yen substantially outperformed the greenback that year, but, yes, the dollar – and notably U.S. Treasuries – were two of the few places where investors found refuge.
But we have observed that for some time now, the U.S. dollar has tended to follow dynamics more typically associated with a high yielding currency, that is to rally in conjunction with the equity markets. This is no accident, as, on a relative basis, the U.S. dollar, has indeed become a high yielding currency versus many of its peers. The flip side of that is that we have observed the dollar often declines when equity markets plunge. This suggests that investors might want to gain some non-dollar exposure as a way to diversify their portfolio. Except they might want to hold non-dollar cash rather than equities, as international equities may also suffer when U.S. equities are under pressure.
Rates bottoming in rest of the world?
We have heard many central bankers complain that their currencies are overvalued and that rates might go lower. But last week, ECB chief Mario Draghi released what we think was a bombshell. During the Q&A of last week’s press conference, he said: “From today’s perspective, and taking into account the support of our measures to growth and inflation, we don’t anticipate that it will be necessary to reduce rates further.” (bolding added) No, he did not misspeak, as he mentioned a second time during the press conference that rates may not go down any further. There are a variety of reasons why he might indicate that rates have bottomed, including:
- Negative interest rates have been difficult to work with for some banks. Notably, Draghi pointed out that banks lose money on some loans linked to overnight lending rates that are negative. By signaling that rates may not go down any further, banks may not restrict lending based on a fear that they may face more losses as rates go deeper into negative territory.
- Draghi appears to have shifted towards a new regime in trying to jumpstart growth in the Eurozone, focusing on boosting bank profitability with another newly announced program (TLTRO II) that, in our analysis, could cut bank funding cost in half for all Eurozone banks. As such, he appears to acknowledge that weakening the euro has not been the panacea to fix the ills of the Eurozone.
- Data in the Eurozone haven’t been so bad. Indeed, listening to Draghi over the past 9 months, a lot of what he looks at looks pretty decent. In fact, just about all negatives he cited at his most recent press conference were risks outside of the Eurozone (global growth) or at least partially outside the control of the ECB (low energy prices).
The conclusion we draw from this is that the bottom of the interest rate cycle may well be in for the Eurozone. Take Draghi’s word for it, not ours. And we think his position creates a whole different dynamic for the U.S. dollar.
On a somewhat related note, we have been arguing for some time that interest rates in Sweden, for example, are way too low. The economy there has good growth and low unemployment; it’s just that inflation is rather low. In our view, the Swedish central bank (Risksbank) has been paranoid about ever more negative rates in the Eurozone; with that risk off the table, the Riksbank may soon be courageous enough to reverse course.
Swiss National Bank President Jordan has also come out [saying?] that there’s a limit as to how far rates can go down.
Commodity currencies
If you see a trend above, these are all European currencies. In contrast, so-called commodity currencies (e.g. the Australian dollar and Canadian dollar) have not been at zero or in negative territory. The dynamics there have also not followed traditional patterns. Still, Mr. Poloz, the head of the Bank of Canada (BoC), last week stated that the BoC wants to see how fiscal policy plays out before deciding on whether to cut rates further. Canada is one of the few countries that appears to be getting a serious fiscal stimulus (Prime Minister Trudeau was quick to discard his election promise to only have minor deficits).
Australia is a bit of a special base, as central bank governor’s Glenn Stevens term is expiring later this year; if we understand Mr. Stevens correctly, he wants out as the governor that did not need to resort to extraordinary policies. Indeed, the Australian economy has rapidly been adjusting, with the weaker Australian dollar helping.
New Zealand, also considered a commodity country, in contrast, just lowered rates again, a reflection that the economy might have a more difficult time adjusting than Australia’s.
Emerging markets
All that said, before we get too far ahead of ourselves, let’s have a look at emerging market currencies. After declining rather substantially, they may be due for a rebound. But let’s not forget that these tend to be tightly managed currencies. The dynamics there, in our analysis, are much more driven by liquidity than many other factors. And may make these currencies move more in tandem with U.S. equities.
Stock market?!
At the risk of oversimplification, the dollar’s fate over the coming months may well be decided by how the stock market is doing. In many ways, the Fed’s actions may also be tied to how the stock market is doing (but that’s an analysis for another day). If our analysis is correct, a rising equity market may bode well for the U.S. dollar; a falling equity market may bode poorly for the greenback.
We may be a tad biased, having provided an analysis last August that we think a bear market is upon us. In the context here, we might want to add that sovereign wealth funds may need to sell U.S. dollar denominated investments to cover budget shortfalls back home, providing pressure on both equities and the greenback.
Axel Merk
Merk Investments, Manager of the Merk Funds

| Tue. | Wed. | Thu. | Fri. | Mon. | Tue. | Evaluation | |
| Monetary conditions | 0 | 0 | 0 | 0 | 0 | 0 | 0 |
| 5 day RSI S&P 500 | 55 | 62 | 62 | 78 | 75 | 70 | – |
| 5 day RSI NASDAQ | 50 | 58 | 53 | 73 | 73 | 63 | 0 |
|
McCl-
lAN OSC.
|
+176 | +202 | +138 | +205 | +143 | +40 |
0
|
| Composite Gauge | 15 | 8 | 11 | 5 | 10 | 10 | 0 |
| Comp. Gauge, 5 day m.a. | 7.6 | 8.2 | 9.6 | 9.2 | 9.8 | 8.8 | 0 |
| CBOE Put Call Ratio | .98 | .93 | .99 | 1.01 | .92 | 89 |
0
|
| VIX | 18.67 | 18.34 | 18.05 | 16.50 | 16.92 | 16.84 | 0 |
| VIX % change | +8 | -2 | -2 | -9 | +3 | 0 | 0 |
| VIX % change 5 day m.a. | +1.4 | +1.6 | +1.6 | -0.4 | -.04 | -2.0 | 0 |
| Adv – Dec 3 day m.a. | +111 | +176 | +353 | +776 | -262 | -30 | 0 |
| Supply Demand 5 day m.a. | .68 | .63 | .54 | .62 | .60 | .78 | 0 |
| Trading Index (TRIN) | 1.83 | 1.09 | .67 | .72 | 1.31 | 1.04 |
0
|
|
S&P 500
|
1979 | 1989 | 1990 | 2022 | 2020 | 2016 | Plurality -1 |

 “The central banks aren’t interested in what works, they’re interested in their own prestige. And they are so deep into it already and it didn’t work. They will increase the medicine,” said Faber, the publisher of The Gloom, Boom & Doom Report. “Eventually, they’ll buy all the government bonds; they’ll buy all the corporate bonds, all the shares outstanding. Afterwards the housing market goes down, they’ll buy all the homes and then the government will own everything.”

-
I know Mike is a very solid investor and respect his opinions very much. So if he says pay attention to this or that - I will.
~ Dale G.
-
I've started managing my own investments so view Michael's site as a one-stop shop from which to get information and perspectives.
~ Dave E.
-
Michael offers easy reading, honest, common sense information that anyone can use in a practical manner.
~ der_al.
-
A sane voice in a scrambled investment world.
~ Ed R.
Inside Edge Pro Contributors

Greg Weldon

Josef Schachter

Tyler Bollhorn

Ryan Irvine

Paul Beattie

Martin Straith

Patrick Ceresna

Mark Leibovit

James Thorne

Victor Adair