
Currency
In the midst of the great commodities boom past, despite the prognostications of many it was never going to end, e.g. one top seer was fond of asking us to visualize every Chinese citizens eating just one egg and one strip of bacon and having a glass of juice every day for breakfast and voila–commodities investing nirvana. Well, despite the logic of this visualization, it hasn’t been that simple. But that’s the point—it never is simple.

PM Sector longs have had a laugh at our expense over the past couple of weeks as gold has continued to edge higher after we called it down, but it is looking more and more like they will end up like those 4 fools in the classic Clint Eastwood Spaghetti Western, A Fistful of Dollars. Clint rides into a tiny flyblown town and the 4 fools shoot around his mule’s feet. After advising the undertaker to Get 3 coffins ready, having made a slight underestimation, Clint returns and challenges the 4 fools by saying “When you apologize to my mule like I know you’re going to”. Needless to say they do not respond in the required manner to this demand and so Clint quickly dispatches them to the great satisfaction of the undertaker.


- As it often does, gold is pausing ahead of this week’s FOMC meeting. I don’t expect Janet Yellen to raise rates this week, although recent jobs reports and the oil price rally are likely tempting her to do so.
- The limited recovery from the meltdown in global stock markets after her first rate hike is likely to convince Janet to hold off, but only until the next meeting.
- That is when a fresh and potentially horrific US stock market meltdown is most likely.
- Please click here now. Please double-click to enlarge. That’s the daily gold chart. The sell-off that began last week is building the right shoulder of a solid inverse head and shoulders pattern, which is strengthening the overall technical picture.
- For a look at key liquidity flows into and out of gold, please click here now. That’s a snapshot of the latest COT report, and I’ve highlighted the commercial bank actions in green.
- The banks clearly are not afraid to “chase some price” in this general price area, as they added long positions as well as short ones quite recently.
- The COT reports offer a look at what the banks have done in the past, but to understand what they are likely doing in the present, please click here now. Please double-click to enlarge. That’s a short term gold chart, using five minute bars.
- Note the sizable volume bars that are appearing. In my professional opinion, the banks have already covered tens of thousands of short positions, just in the past few trading sessions.
- If my right shoulder projection plays out, I think they will have covered off many more, and will be adding long positions quite aggressively as they do that.
- Please click here now. From a fundamental perspective, gold’s rally from December has been mainly based on three factors:
- First, Janet’s rate hike created a huge panic in risk-on markets. Second, influential economists began suggesting that a new upcycle for commodities could begin later this year.
- That caused money managers to commit to the entire commodity sector, on an ongoing basis as a value play.
- Third, Chinese New Year buying was a strong seasonal factor.
- Indian demand is often limited at this time of the year, but it has been more soft than usual because of hopes for a duty cut, and now a jeweller strike. If the strike continues, official Indian demand could be under 20 tons in March.
- In the short term, it’s difficult for gold to make strong headway with Chinese New Year buying finished, and India being this quiet…unless some new fear trade catalyst is on the near-term horizon.
- What could that be? For the likely answer, please click here now. Japanese central banker Kuroda left rates unchanged at the latest BOJ meeting, but many top bank economists feel he could be poised to do something drastic at the next meeting in April with his QEE program.
- I’ve argued that rate hikes in America and NIRP (negative rates) in Europe and Japan are a potent combination for higher gold prices.
- If Indian jewellers end their strike in April, as Janet hikes rates and Kuroda drastically ramps up QEE, gold could begin a much more aggressive rally than what has already occurred in the past few months.
- Please click here now. While these comments about China tying gold reserves to GDP were arguably made by somebody “talking their book”, the PBOC has released official written statements about the key role of gold in the internationalization of the yuan.
- The SGE gold price fix is scheduled, tentatively, for an April 19 launch date, and that time frame coincides with many other key events for price discovery in the West.
- Tactics? As always, amateur investors who tend to panic during gold price pullbacks should buy put options. While I’m always massively net long gold, I also always make sure I add some short positions into rallies, following the “financial footsteps” of the commercial bank traders.
- Please click here now. Please double-click to enlarge. That’s the GDX weekly chart. It looks spectacular, but the most likely price action in the short term is a bit of a “sideways chop”.
- That chop should see a couple of right shoulders form, as part of a big inverse head and shoulders bottom pattern. While anything is possible in any market at any time, including new lows for gold, I think the Western gold community is starting to look pretty good here, given the sizable institutional buying taking place “across the board” in gold stocks.
- Because a lot of that buying is value-oriented, even if gold did “impossibly” go to a new low, the substantial institutional commitment to gold stocks that is in play now is likely to accelerate. Simply put, there’s a wave of confidence sweeping through the institutional investor community about gold stocks, and I think it’s time for the Western gold community to grab an extra gold stocks surfboard, and have some fun!
Mar 15, 2016
Stewart Thomson
Graceland Updates
website: www.gracelandupdates.com
email for questions: stewart@gracelandupdates.com
email to request the free reports: freereports@gracelandupdates.com

What if we think of ZIRP (Zero Interest Rate Program) as a financial virus, created and distributed by the central banks, that infects pools of savings? Symptoms are:
- The ZIRP virus weakens and gradually destroys pension funds. Retirees, beware of this virus!
- The ZIRP virus destroys income for personal savers. People saved for decades and now their savings yield little or nothing in interest.
- The same has occurred with Insurance companies – they earn little on their bonds compared to what they previously earned.
- Governments must (in theory) increase their contributions to retirement plans to supplement the decreased earnings due to the deleterious effects of the ZIRP virus. Consequently some governments are closer to insolvency and should curtail expenditures. Retirees, this is another warning!
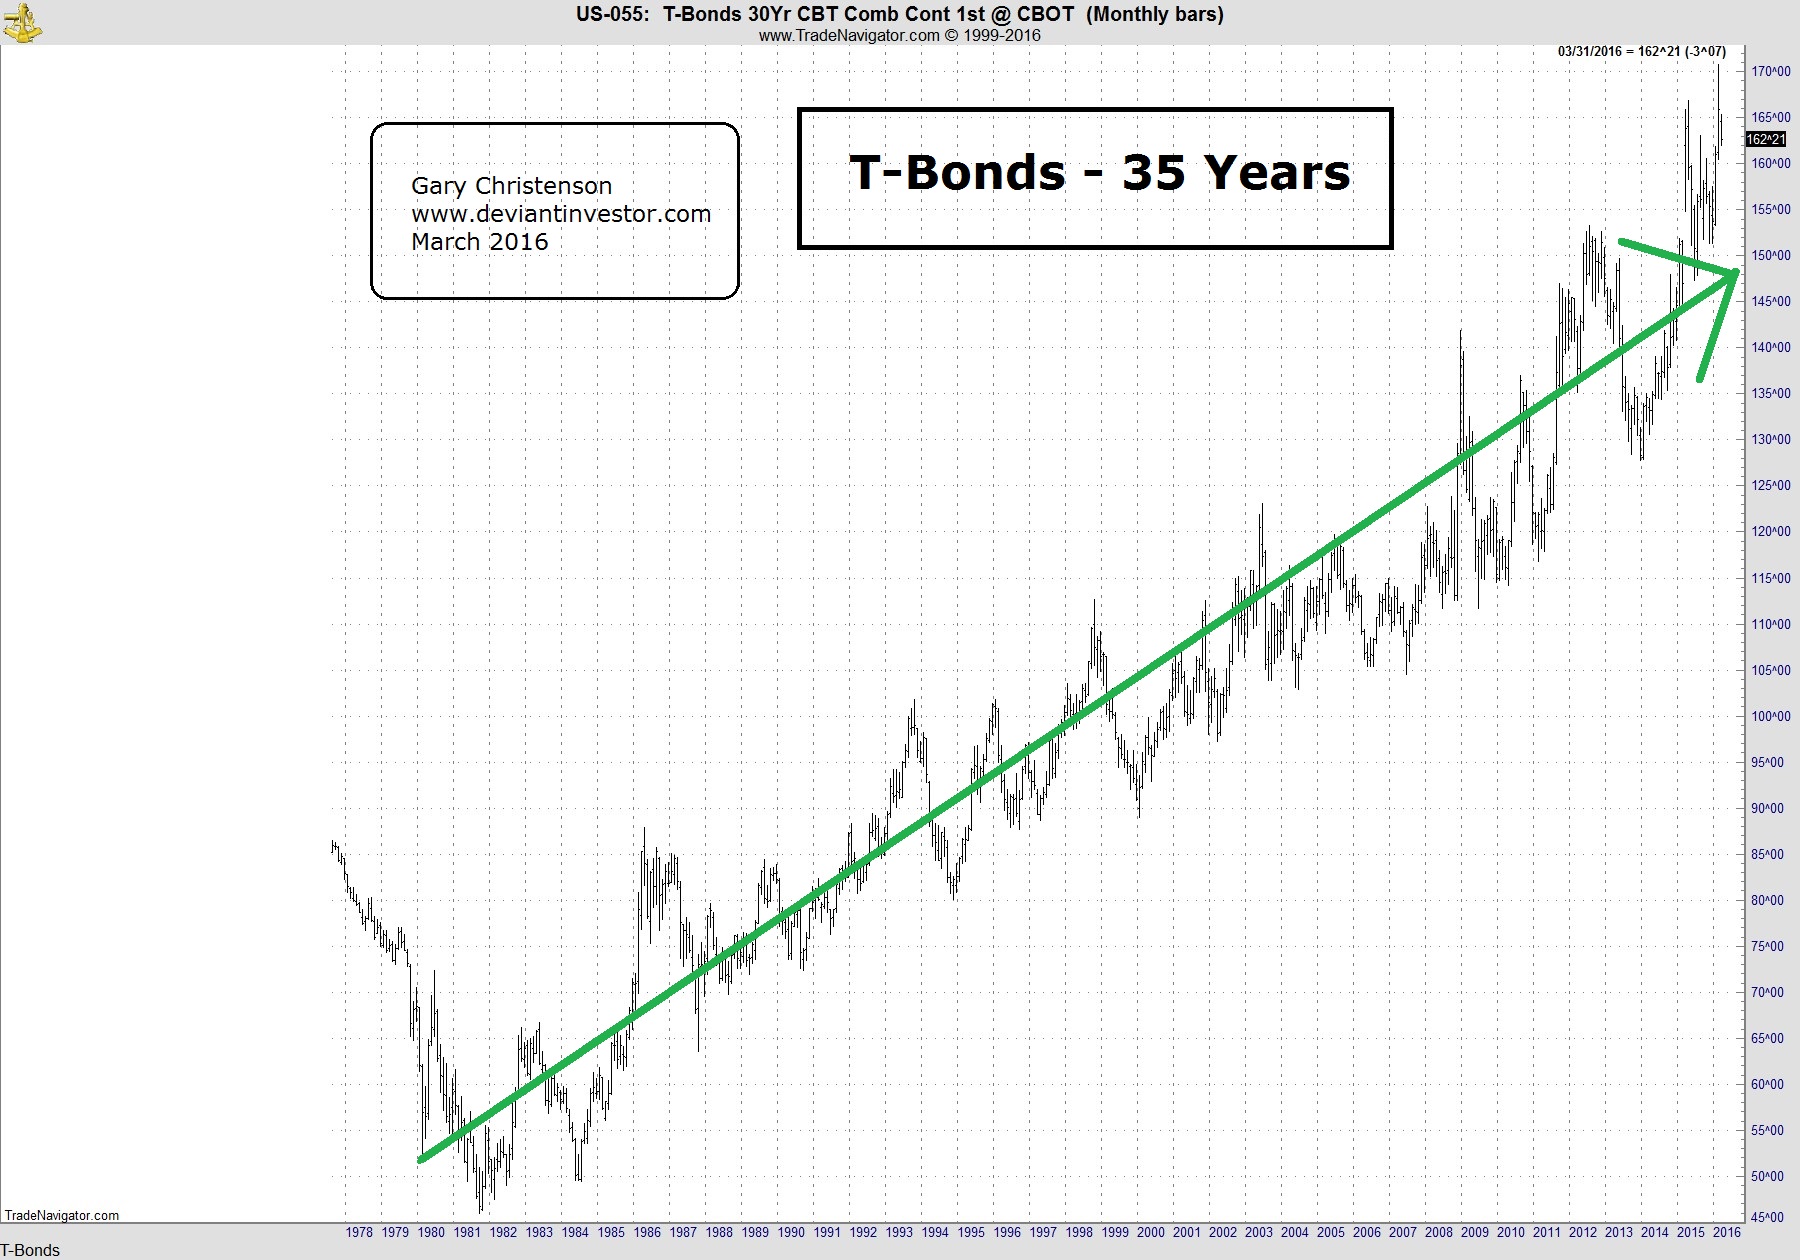
- The bond market is further levitated in its 35 year bull market. This benefits the political and financial elite … until it crashes.

On Friday, crude oil gained 1.24% as rig count declined to the lowest level ever. Thanks to this news, light crude hit a fresh March high, but will we see further rally in the coming week?
In our last Oil Trading Alert, we wrote the following:
(…) earlier today, the IEA, said that non-OPEC output would fall by 750,000 barrels per day (bpd) in 2016 compared to its previous estimate of 600,000 bpd. Additionally, U.S. production alone would decline by 530,000 bpd in 2016. Thanks to this news, crude oil futures extended gains in a pre-market trading, hitting a fresh high of $38.95, which suggests that the commodity could also move higher after the market’s open and even approach the barrier of $40 later in the day (especially if today’s Baker Hughes report would be bullish).
As it turned out, on Friday, crude oil extended gains and hit a fresh high of $39.02 after the Baker Hughes report showed that the total number of U.S. oil rigs dropped by 9 to 480 for the week ending on March 4, which was the lowest level in history (the previous lowest record came on April 23, 1999 when the rig count slipped to 488). On top of that, the number of active U.S. oil drilling rigs dropped by 6 to 386, which was the 12th consecutive week of weekly declines. Thanks to these numbers, light crude re-tested the major resistance levels, but will we see further rally in the coming week? Let’s take a look at the charts and find out what can we infer from them.…continue reading HERE


-
I know Mike is a very solid investor and respect his opinions very much. So if he says pay attention to this or that - I will.
~ Dale G.
-
I've started managing my own investments so view Michael's site as a one-stop shop from which to get information and perspectives.
~ Dave E.
-
Michael offers easy reading, honest, common sense information that anyone can use in a practical manner.
~ der_al.
-
A sane voice in a scrambled investment world.
~ Ed R.
Inside Edge Pro Contributors

Greg Weldon

Josef Schachter

Tyler Bollhorn

Ryan Irvine

Paul Beattie

Martin Straith

Patrick Ceresna

Mark Leibovit

James Thorne

Victor Adair