Energy & Commodities

The Outlook for Mining M&A

It’s no secret that mergers and acquisitions (M&A) activity in the mining sector is in the dumps.  According to PWC, deal volume in the first half of 2013 declined 31% as compared to the same period last year. Deal value declined 74%. Excluding Glencore’s $54 billion acquisition of Xstrata in 2012, deal value is still down 21%. A recent Bloomberg article noted that the volume of acquisitions valued at less than $1 billion is at an eight-year low while the volume of deals in Q3 was the lowest since Q4 of 2004. However, some deals are taking place and in order for speculators and investors to capitalize, they will need to keep a discerning eye, just like potential suitors.

The cause of the current malaise in M&A activity is fairly simple and two fold. First, the major companies who drive M&A activity made some bad decisions and costly acquisitions in previous years. Second, the deep and extended cyclical bear market has essentially forced the majors, in terms of acquisitions, to the sidelines. The majors are looking to get leaner and meaner and until that and a recovery in the market occur, they will remain on the sidelines.

Despite difficult conditions, some companies have remained active.

Days ago B2Gold (BTG, BTO.to) announced the friendly acquisition of Volta Resources (VTR.v) for $63 million. This will be B2’s second acquisition in the last 12 months. In the first quarter of this year the company closed its acquisition of CGA Mining, which cost the company $1.1B.

Alamos Gold (AGI, AGI.to), like B2Gold has been quite active. Alamos recently closed its acquisition of Esperanza Resources for $69.4 million which was announced in the summer. Alamos also closed a smaller acquisition of Orsa Ventures for $3.5 million.

Also, New Gold (NGD, NGD.to) on May 31 agreed to acquire Rainy River Resources for $355 million.

These recent deals highlight one observation I’ve heard from several exploration companies. At present, its the mid-tier type companies that will lead the M&A charge. These are companies that are generating healthy cash flow and earnings at these prices and have the working capital to push forward. Their share prices are not in the toilet like those of the majors and many juniors. Meanwhile, majors will be on the sideline at least until industry sentiment improves. That is what one exploration company told me.

So when will sentiment improve?

GDX and GDXJ continue to be trapped in a long bottoming process. This process began in the spring and is in its seventh month. While a bottom in terms of price is likely in, both GDX and GDXJ can stay trapped in this process for several more months and perhaps longer. My view is sentiment will not improve until after GDX and GDXJ breakout above the red lines.

oct30ed

M&A activity will remain quite low well into 2014 for several reasons. The majors for the most part are in no position to take on more risk. Even if we get a rip-roaring recovery in 2014, the majors will need more time to get themselves in a better position to make acquisitions. In addition, a handful of mid-tiers have already been fairly active. Thus, don’t expect a huge increase in acquisitions for at least several quarters.

Nevertheless, more than a handful of exploration and development companies appear to have bottomed and are showing relative strength against the sector. These are companies that have value and potential even amid a struggling market.

To find such companies, start your research by looking for junior companies which are strong enough to stand their own. Look for companies with cash, experienced management teams and projects in favorable jurisdictions. In addition, ownership of the stock by a major or larger company is the type of sponsorship we love to see. Then you have to do due diligence on the projects which is obviously more difficult. Acquirers are essentially looking for projects that are not too costly to start-up and will have good margins at current prices. Good Luck!

Jordan Roy-Byrne, CMT

Jordan@TheDailyGold.com

If you’d be interested in our analysis on the junior companies poised to lead this recovery, we invite you to learn more about our service.


THE NEW ABNORMAL

The US dodged a bullet and the Vancouver Subscriber Investment Summit had a great turn out on the same day. Coincidence? I think not.

Seriously; thanks from Keith, Lawrence and I for the great turnout. I’d like to thank the companies that presented as they make these days possible. Last but definitely not least I congratulate Nichola Vermiere and Katy Severs for organizing a great event and doing all the hard work to make sure it was well attended and went off without a hitch. People thanked me for a great show but It’s Nichola and Katy that do the heavy lifting. I just show up and try not to trip over the microphone wire.

We made it through another US budget drama. Gold ended it better than I feared. It’s too soon to know if that is just a “buy on news” knee-jerk reaction but I suspect not. Fed accommodation should continue for a while and physical buying has picked up again. It seems improbable Washington would put us through another shutdown in three months but the losers are already sounding belligerent. You can’t discount another sideshow at the start of 2014.

A short period of something like normality hopefully means the small subset of juniors delivering real results will get a hearing and positive reaction to good news. That would be a nice change.

Washington continues its pantomime, dominating the newswires with one internal deadline after another. The markets have been taking the process pretty calmly, almost enthusiastically. Wall St. essentially ignored the whole process. Yes, the volatility was high but at the end of the day the NY market hit a new record which tells you how unconcerned most traders are.

The episode was driven by Republicans and it seems like Wall St, which is not a small contributor to the GOP, was comfortable the party would not do the stupid thing when it came down to the wire. It does make one wonder what the more radical elements of that party will do for an encore.

Many in the corporate world are already making noises about voting with their feet and with their wallets. I’m not sure how much Tea Party funding comes from corporate types but it sounds like some of that funding is about to evaporate.

For all the sound and fury in the past three months we’re left pretty much where we were at the start. We have another set of deadlines three months in the future and promises everyone will play nice and formulate some kind of budget deal. It might actually happen this time.

No one objective views this side show as anything but a political disaster for the Republicans. They tried to make Obama blink first and, unlike 2011, he didn’t. It seems even less likely he will blink first in January. I think that is Wall St’s read. Budget impasses are the “new abnormal” and traders are going to largely ignore them unless there is a firm reason to think there is default risk.

I don’t think traders care about things like sequestration either. Something is happening that appears to be shrinking deficits; they’re uninterested in the details. As long as they don’t read headlines implying the government is going to take more money out of their pocket they will tune out the process.

So where does that leave us? The shutdown had some economic impact though will take time to gauge how much. It’s assumed by most macroeconomists that this episode knocked about 0.3-0.5% of Q4 GDP. That isn’t a huge deal if its accurate. It would take the projected growth rate for Q4 down to 2%, a pretty lackluster amount.

In the midst of the shutdown weekly employment claims were coming in higher but the data was noisy and pretty much useless. The shutdown didn’t last long enough to generate layoffs anywhere and government employees are going to get back pay for time missed.

All in all it shouldn’t be that damaging but its coming on the back of mediocre payroll numbers. The September nonfarm payroll number will now be released on October 22nd and the October one will come out a week late. Its hard to say whether either number, especially the October one, will have much impact since its sure to be heavily revised later.

For the gold market, the shutdown is mainly important for its impact on the Fed’s QE program. The September Fed meeting minutes indicate FOMC members expected a start to tapering before year end. The shutdown will have changed that. There may be more lasting effects on the $US as well.

The Fed has always insisted its QE program and the taper that ends it are data driven. Recent comments from Fed committee members-including a couple of monetary hawks-show concern that data quality is going to be poor for a while.

It will take a couple of months before the impact of the shutdown on the wider economy is measured. The political grandstanding hasn’t helped consumer confidence. Several private surveys show confidence at nine month to two year lows.

I’ve never found these surveys to be great predictors but they could still give the Fed pause. The US is about to head into the shopping season that makes or breaks the retail sector for the year. I don’t think the Fed wants to rain on that parade.

As I expected, Janet Yellen has been nominated as the new Fed chair. She is a monetary dove, more dovish than Bernanke in fact. She isn’t blind about it; she was simply right that this would be a weak expansion. She’s also on record in the past being dubious about how trustworthy the unemployment rate is as a measure of US financial health. She’s right about that too. Anyone who can do the math can see much of the reduction in the unemployment rate comes from workers giving up, not from workers getting jobs.

While I agree that physical demand should ultimately price gold many other factors are short term drivers. “Taper talk” has been a big negative for most of the year. That should work in gold’s favor for the next few months as traders assume the taper will be pushed back.

Impact of the $US on gold and other commodity prices is variable but there are periods this year where it had a large impact (or other factors had big impacts on both gold and the greenback). We saw that the day after the US shutdown ended. Gold rose $40 and the $US got hammered. This was partially a “risk on” trade plus an acknowledgement that the Fed would extend QE. Gold didn’t follow through the next trading day but held most of its gains and other commodities gained. The $US is at a nine month low-any sort of negative economic news could drive it below support at 79 which would be supportive of commodity prices.

sc-1

While the US was busy with political theatre China clocked a 7.8% growth rate in Q3, reversing two months of slowing. That should help support base metals and bulk material prices like coal and iron ore. Europe has also been showing more signs of life. It’s going to be a long hard road back for the EU but at least it looks the economic nadir has been crossed.

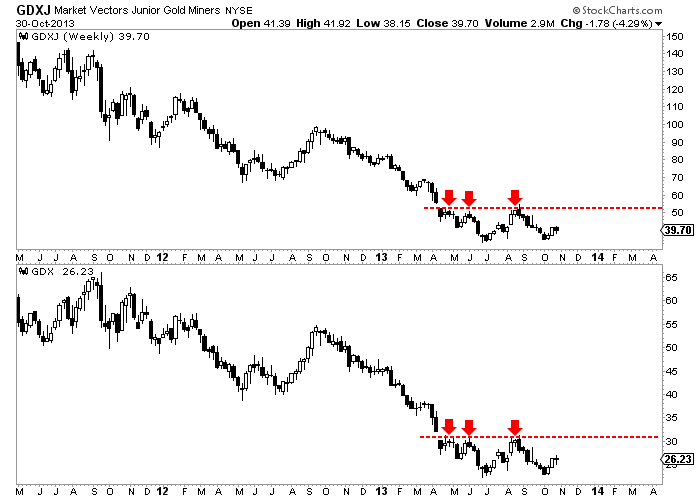
In addition to support from a weaker Dollar physical demand picked up when gold dropped below $1300. ETF outflows (i.e.-the move from West to East) continued. Those sellers were no doubt surprised that gold gained after the vote in Washington. Others like them might be rethinking exiting the space.

The initial reaction to the end of the shutdown is encouraging but it will take a couple of weeks at least to know whether we have established an uptrend.

Though I would consider the next month of US economic data highly suspect in terms of quality, a batch of weak readings could help the gold price and generally better economic readings elsewhere could help base metals. The S&P looks stretched but the Fed stimulus trade is back on so it probably gets a victory lap too, unless/until we see weak job/retail numbers.

All this should add up to a better tone for juniors but there is little time to stage a rally. Tax loss selling is again a factor, though I think there has been a bunch of that already. Gold needs to gain at least another $50/oz to start calming traders. If that happens we may see a bit of strength going into year-end once tax loss sellers have finished.

That is hardly a ringing endorsement but it’s better than I feared even a couple of days ago. A small minority of active, well managed companies still have to carry the day and that was never going to be easy.

Ω


The HRA–Journal and HRA-Special Delivery are independent publications produced and distributed by Stockwork Consulting Ltd, which is committed to providing timely and factual analysis of junior mining, resource, and other venture capital companies.  Companies are chosen on the basis of a speculative potential for significant upside gains resulting from asset-based expansion.  These are generally high-risk securities, and opinions contained herein are time and market sensitive.  No statement or expression of opinion, or any other matter herein, directly or indirectly, is an offer, solicitation or recommendation to buy or sell any securities mentioned.  While we believe all sources of information to be factual and reliable we in no way represent or guarantee the accuracy thereof, nor of the statements made herein.  We do not receive or request compensation in any form in order to feature companies in these publications.  We may, or may not, own securities and/or options to acquire securities of the companies mentioned herein. This document is protected by the copyright laws of Canada and the U.S. and may not be reproduced in any form for other than for personal use without the prior written consent of the publisher.  This document may be quoted, in context, provided proper credit is given.

©2013 Stockwork Consulting Ltd.  All Rights Reserved.

Published by Stockwork Consulting Ltd.
Box 85909, Phoenix AZ, 85071 
Toll Free 1-877-528-3958

U.S., Canada Lead World in Shale Gas Production

26MarShaleGas468Its official — the U.S. government’s authoritative Energy Information Administration has confirmed that the world’s three leading shale gas producers are U.S., Canada and China, respectively.

In a 23 October report entitled “North America leads the world in production of shale gas” the EIA reports, “The United States and Canada are the only major producers of commercially viable natural gas from shale formations in the world, even though about a dozen other countries have conducted exploratory test wells” and that China is the only nation outside of North America that has registered commercially viable production of shale gas, although the volumes contribute less than 1 percent of the total natural gas production in that country. In comparison, shale gas as a share of total natural gas production in 2012 was 39 percent in the United States and 15 percent in Canada.

This is not the whole global story, however.

According to the “Technically Recoverable Shale Oil and Shale Gas Resources: An Assessment of 137 Shale Formations in 41 Countries Outside the United States” analysis prepared by Advanced Resources International for the EIA, in comparison with 2011 figures, 41 countries were now assessed to have recoverable shale gas reserves, up from 32 two years ago. The number of basins with recoverable shale reserves increased from 41 in 2011 to 48 in 2013, and the number of formations containing shale gas nearly doubled in the same time period, from 69 in 2011 to 137 in 2013. Worldwide, estimates of “technically recoverable resources” of shale gas also increased, from 6,622 trillion cubic feet in 2011 to 7,299 tcf two years later. Shale/”tight oil” estimates also rose, more than 1,000 percent, from 32 billion barrels in 2011 to an impressive 345 bb.

The report’s most arresting statistic is that in only two years, estimates of U.S. potential shale gas reserves soared by nearly 50 percent. “The shale gas resources assessed in this report, combined with EIA’s prior estimate of U.S. shale gas resources, add approximately 47 percent to the 15,583 trillion cubic feet of proved and unproven non-shale technically recoverable natural gas resources. Globally, 32 percent of the total estimated natural gas resources are in shale formations, while 10 percent of estimated oil resources are in shale or tight formations.”

[Hear MoreKurt Wulff: The Big News in the Shale Play – Eagle Ford, Bakken, and Permian]

Another fascinating statistic from the study is its ranking of the “Top 10 countries with technically recoverable shale oil resources.” While the U.S. is first in extraction, the report ranks the Russian Federation in reserves, with 75 billion barrels of technically recoverable shale oil. The U.S. is number two, with 58 bb. China is number 3, with 32 bb, Argentina number 4 with 27 bb, Libya number 5 with 26 bb, Australia number six with 18 bb, leaving Venezuela and Mexico tied for seventh with 13 bb apiece and Pakistan and Canada tied for eighth place, with 9 bb apiece.

A number of interesting conclusions flow from the above information.

First, five of the top shale gas reserves are in the Western Hemisphere – the U.S. Argentina, Venezuela, Mexico and Canada, but only two of them, the U.S. and Canada, have aggressively moved to exploit them.

Secondly, conspicuously absent are Middle Eastern countries Saudi Arabia and Iran, where hydrocarbon information is regarded as a state secret. Iraq is also absent. Energy poor Pakistan and energy power Libya have shale gas reserves, but neither the money nor the technology to exploit them.

In the Pacific, Australia is doing nicely from its coal exports, and is looking towards ramping up its liquefied natural gas exports.

Canada, while having relatively modest shale gas reserves, nevertheless is only trailing the U.S. in their exploitation.

…leaving as wild cards energy superpower Russia and energy starved China, both as yet minors players in the shale gas revolution.

Bottom line?

Given North America’s commanding lead in exploiting shale gas, vast potential opportunities exist, and U.S. and Canadian energy firms can expect profitable contracts from nations endowed with substantive shale gas reserves to come knocking at their doors for assistance in unlocking their subterranean treasures.


About Us

OilPrice.com is the fastest growing energy news site online. Our analysis focuses on Oil and Gas, Alternative Energy and Geopolitics. We have 3 in house writers and publish research from over 150 contributors.

OilPrice works with over 250 syndication partners who re-publish our analysis. Some of our partners are: Zerohedge, Business Insider, Forbes, 24/7 Wall St, Arab News, The Street, Rigzone, Mining.com, Mineweb, Minyanville, Stockhouse + many others…

OilPrice.com publishes more news than any other energy related site online.

Follow the Money… Straight to Canada

Let’s call it an energy shopping spree of sorts.

Last year, more than $10 billion poured from the pockets of Chinese investors seeking a stake in the U.S. energy sector.

And yet, for every cent they put toward U.S. shale projects, there was another patch of land attracting even greater attention…

Although it may be hard for some people to believe, given the fact that the media spotlight has been focused solely on the United States, the Chinese shelled out roughly $23 billion in Western Canada alone.

And that’s because for China, it’s all about natural gas right now.

More and More and More Gas

It’s easy to see where all this spending is taking us…

We can follow the money right to the Canadian frontier.

And China’s lust for North American energy is even more evident in the steps they’re taking at home.

A few weeks ago, I mentioned the ongoing war on smog being waged in Beijing. Perhaps the only way to turn the tide is to reduce the country’s dependence on coal. In order to cut their coal addiction, the Middle Kingdom is turning to natural gas.

This move is more serious than pledges and press releases. As it stands now, China can only import less than 26 billion cubic meters of LNG per year. However, within the next two years, that amount is expected to more than double — to nearly 65 billion cubic meters.

There is, of course, a major obstacle in China’s plans to implement natural gas on a grand scale, and that’s their serious inability to kick-start their own shale gas boom.

Here in the United States, we’ve been spoiled by the supply glut created from the dramatic ramp-up of shale gas production. On the other side of the globe, the Chinese are having problems producing their resources…

Even though they are sitting on a larger deposit of shale gas than Uncle Sam is (more than one quadrillion cubic feet of technically recoverable gas, according to the EIA), that doesn’t necessarily mean they can extract it.

(Don’t forget, it took George Mitchell nearly 20 years to get it right in the Barnett Shale.)

When it comes to drilling shale wells, cost is king. In the U.S., for example, wells in the Marcellus can run about $5 million apiece. So far, the handful of shale wells drilled in China has come with a price tag of almost $15 million per well.

Add to the fact that it’s taking more than three months to drill and complete each one, and that translates to the Chinese spending five times more andtaking four times longer than companies operating in the Marcellus Shale!

Barring a miracle, China will be forced to import a good deal of the natural gas it needs if it’s to meet the 230 billion cubic meters it expects to consume in 2015.

Follow the Money… Straight to Canada

It’s no coincidence China is quickly expanding its LNG import infrastructure. And I’ll give you one guess where the country will look to meet its supply shortfall…

British Columbia is home to the Horn River Basin, one of the largest shale gas deposits in North America. At last count, this area contains over 500 trillion cubic feet of natural gas underground.

While this figure doesn’t seem all that impressive when stacked against the 1,116 trillion cubic feet on the Asian continent, let me assure you that looks can be deceiving in this situation…

Because unlike China, where shale production is still a well of hopeful optimism right now, companies in British Columbia have 94 trillion cubic feet of recoverable gas on hand.

And we can take these potential investments in Canada’s burgeoning LNG industry a step further…

One of the biggest names right now in Canadian LNG is none other than Chevron. Back in February, Chevron became a 50% owner in the Kitimat LNG project in British Columbia.

Now, Chevron is great if you also happen to have a multi-decade time frame in mind.

Had you decided to invest in the source responsible for supplying Chevron with its natural gas, the results would have been drastically different.

cvx-chart

Then again, you wouldn’t be shelling out over $120 per share, either…

Not only is this company trading for ten times less than major oil companies like Chevron, but it’s also exploiting Big Oil’s biggest weakness: the crucial need for more gas to export.

The Horn River player above is doing precisely that, and it’s actually one of a handful of companies that will practically monopolize the entire LNG trade with Asia.

I suggest you take a few minutes to learn the details of this opportunity.

Until next time,

Keith Kohl Signature

Keith Kohl

@KeithKohl1 on Twitter

A true insider in the energy markets, Keith is one of few financial reporters to have visited the Alberta oil sands. His research has helped thousands of investors capitalize from the rapidly changing face of energy. Keith connects with hundreds of thousands of readers as the Managing Editor of Energy & Capital as well as Investment Director of Angel Publishing’s Energy Investor.For years, Keith has been providing in-depth coverage of the Bakken, the Haynesville Shale, and the Marcellus natural gas formations — all ahead of the mainstream media. For more on Keith, go to his editor’s page.

Mark Leibovit: Big Picture Targets

METALS: GOLD, SILVER, PLATINUM, PALLADIUM AND COPPER –  1252.69 HELD AND GOLD HAS PUSHED HIGHER TOUCHING 1361.98 on Monday. Gains are coming grudgingly. I NOW WANT TO SEE GOLD TAKE 1374.77 TO HELP RECONFIRM THE OCTOBER ‘CYCLICAL LOW’ THAT IS BEHIND US. IF WE SHOULD PULL BACK HERE, WE DO NOT WANT TO SEE A DECLINE UNDER 1287.00 AND CERTAINLY NOW 1252.69 – MAJOR SUPPORT LEVELS. I’M GIVING THE UPSIDE THE BENEFIT OF THE DOUBT DUE TO RECENT POSITIVE LEIBOVIT VRs AND POSITIVE SEASONAL PATTERNS.
———————————————
Spot Gold was up 1.35 at 1357.85 touching 1361.98 intraday. On October 15, it traded at 1252.69. As I’ve written, it appears that was the anticipated October ‘seasonal’ low. However, should we break under 1252.80, the June 28 low of 1186.40 may indeed be challenged. Next resistance is 1374.77 and ultimately the August 28 peak at 1432.38 before we can even attempt to call a major bottom.

Seventeen analysts surveyed by Bloomberg News expect prices to advance next week, nine are bearish and six neutral. The Bloomberg U.S. Dollar Index, a measure against 10 currencies, slid to an eight-month low this week as U.S. employers added fewer jobs than expected last month. Gold’s 30-week correlation coefficient to the index is at minus 0.53, with a figure of minus 1 meaning the two always move in opposite directions.

A majority of participants in the weekly Kitco News Gold Survey expect to see higher prices next week, with many expecting the gains established this week to spill over into next week’s dealings. In the Kitco News Gold Survey, out of 34 participants, 26 responded this week. Of these, 20 see prices up, while five see prices down and one sees prices sideways. Market participants include bullion dealers, investment banks, futures traders and technical-chart analysts. Last week, a nominal number of survey participants were bullish. As of noon EDT Friday, December gold on the Comex division of the New York Mercantile Exchange was up about $32 an ounce for the week.

———————————————
Spot Silver was down .09 at 22.62. Silver touched 22.87 on Thursday, after touching 22.01 on October 22 where a key reversal reversed the short-term trend higher. We NEED to see some upside momentum here and, so far, it’s lacking. The big low was formed on June 27 at 18.31. We then rallied to 25.07 on August 28. From there we declined to 22.01 on October 22 which could be considered by some as a retest of the 18.31 low. We shall see. Downside risk is into the 13.00-15.00 range if that low is violated.
———————————————
Platinum was up 17.50 at 1475.00, closing at the high for the second day in a row. The recent high was 1550.50 posted on August 27 and the October 15 low was at 1360.00. Stepping back, the recent intermediate high was 1745.00 from February 7 and the recent intermediate low was 1303.00 from June 28. The big, big low was at 731 on October 27, 2008 and the big, big record high of 2308.80 that preceded it was back on March 4, 2008.
——————————————-
Palladium was up 2.00 at 748.50. On October 22, Palladium touched 754.50. We need to see that level penetrated to reinstate the short-term uptrend. On June 10, we touched a new recovery high of 775 before we nosedived to 633 (the June 26 low). That pretty much defines the current near-term trading range. Under 633, downside potential is next to 526. Above 775, look towards the 825-875 range. A little history: The big, big low was posted back on November 28, 2008 at 154 and Palladium subsequently traded at 862 on February 18, 2011. Looking way back, however, Palladium hit an all-time high of 968.00 back in December, 2000. As you know, Palladium’s fortune as is with Platinum (and Rhodium) are somewhat tied to the economy and the automobile industry.

Platinum and palladium will be the best performing precious metals next year as record global car sales will keep them in short supply for a third year, according to the most-accurate forecasters.The metals, used in catalytic converters, will be in a shortage for the longest stretch since 2005 for platinum and 2000 for palladium, Barclays Plc and Johnson Matthey Plc data show. Platinum will gain 13 percent to average $1,635 an ounce by the fourth quarter of 2014, according to the mean of eight estimates by the most-accurate analysts tracked by Bloomberg in the past two years. Palladium will gain 10 percent to average $823 an ounce, the most for a quarter since 2001

——————————————–
The Philadelphia Gold and Silver Index – the XAU (for shares) – was up .52 at 100.23 touching 101.66 intraday. The recent peak was 115.21 intraday on August 27 which came off the big July 26 low of 82.28. Should we clear 115.21, look for 116.20 and 127.00. Under 82.28 (the June 26 low), I currently have no clear downside objective. The ‘big picture’ high was 232.72 in December, 2010.
——————————————–
Copper was down .0035 at 3.2645. Resistance remains at 3.39, 3.44, 3.48, 3.5605, 3.5905, 3.7935 and the 3.8520 high from September 14, 2012. . Under 3.0065, next support (a possible target) is 2.85. The record high of 4.6495 was posted on February 15, 2011. With Copper being both volatile a leading indicator for world economies, watching its trend becomes very important. I have ‘big picture’ targets that begin at 4.00 followed by 4.50, 5.05, 5.55 and then possibly 7.00 over the next few years. Recall, Copper had hit a bear market low of 1.2710 back on December 26, 2008. 
———————————————
Screen Shot 2013-10-29 at 9.33.30 AMDo you subscribe to the Leibovit VR Gold Letter?

The October 24 edition can be purchased at www.vrgoldletter.com.