
Energy & Commodities
Be prepared for the next great transfer of wealth. Buy physical silver and storable food.
The latest from Jim Rogers, author of A Gift to My Children: A Father’s Lessons for Life and Investing and Hot Commodities: How Anyone Can Invest Profitably in the World’s Best Market.
The all time high on Sugar was 66 cents, so it`s down 75 percent. That`s just in nominal terms. There`s not much in the world that it`s down 75 percent cheaper that what it was 37 years ago. Sugar is one of those things.
Jim Rogers is an author, financial commentator and successful international investor. He has been frequently featured in Time, The New York Times, Barron’s, Forbes, Fortune, The Wall Street Journal, The Financial Times and is a regular guest on Bloomberg and CNBC.
via jimrogers-investments.blogspot.com
Sugar: The bull has returned
by Sholom Sanik
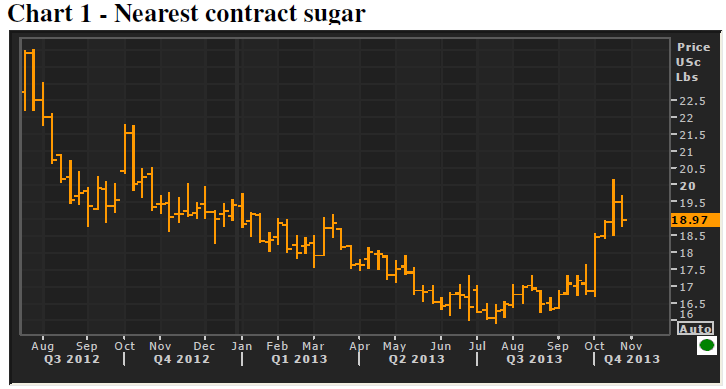
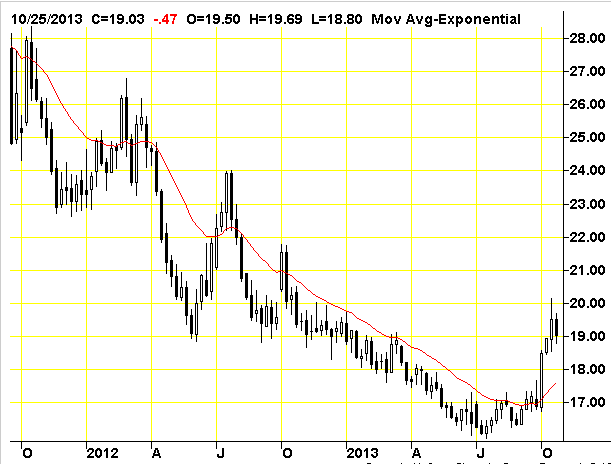
On the morning of Oct. 18, sugar prices were consolidating a 3¢-cent-per pound rally that began in mid-July. The market was meeting some resistance at seven-month highs (Chart 1). Then news broke that a massive fire broke out at Santos Port terminal, the largest in Brazil. March sugar spiked up by over 1¢-cent-per pound. By the end of the session, the market had pared the gains and settled at prices not seen since December 2012.
In addition to extensive damage to the facility, the fire destroyed 180,000 tonnes of sugar, which had been stored in five warehouses. Miraculously, there were no fatalities and only some light injuries.
The burned sugar itself is insignificant in the grand scheme – it represents less than 0.05% of total 2012-13 Brazilian output. The market can handle that. The much larger problem is the effect on the shipping infrastructure. The gutted terminal has capacity to ship 9 million tonnes per year, about a third of all sugar sold abroad by Brazil. Competing ports will take up some of the overflow, but it is estimated that 20% of total Brazilian sugar shipping will be disabled until repairs are complete. Brazilian sugar traders already invoked force majeure on sugar that was scheduled to be shipped from the port.
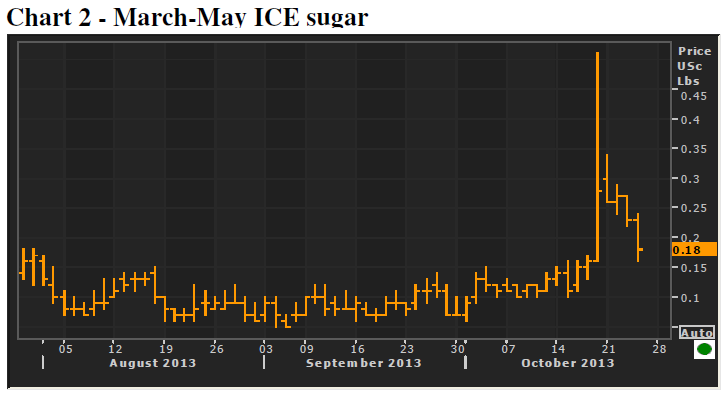
A week has passed since the devastating fire, and sugar prices have slipped back to pre-fire levels. It would seem – judging by the market’s reaction – that the impact on the global supply chain will be limited. There is no sign of tightness, even for the near-term. The March-May spread, which had been trading near flat, spiked briefly on the day of the fire to 50 points premium to spot March, but has since narrowed to only 16 points (Chart 2).
The global balance sheet for the outgoing 2012-13 marketing year will show a surplus of close to 10 million tonnes. The surplus is expected to narrow, but will still be several million tonnes for the upcoming 2013-14 season. So it understandable that there is a feeling of complacency. A one-off event, like the blaze at the Brazilian port, has historically created short lived excitement for bulls and typically leaves nothing but a false breakout on charts. Once the implications for long-term supply/demand fundamentals are assessed, the market retreats.
Also by Sholom Sanik:
Ethanol still a force, but corn stocks in recovery mode
Cocoa: Deficits for the foreseeable future
Smaller U.S. soybean crop will not dent burdensome global supplies
Weekly Commodity Futures Price Chart
Monthly Commodity Futures Price Chart

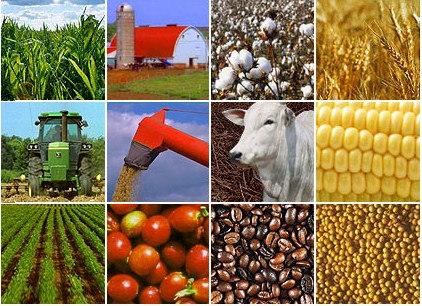 I can think of no better asset to own during any kind of financial crisis than farmland or investing in agriculture stocks.
In some ways, farmland is even better than gold or silver. At least farmland is an intrinsically useful thing. It provides a tangible yield in the form of good things from the earth. We all have to eat. As consumers trim their sails, they ‘ll give up a lot before they give up their calorie intake. In fact, worldwide, the per capita calorie intake is likely to rise, while quality soil will become a scarce commodity. Altogether, I see five big reasons why agriculture investments are as good as green gold…
Invest In Agriculture: Reason #1
Grain inventories are falling to their lowest levels in more than 40 years
Obviously, we can’t continue to dip into inventories. The natural response you would expect to see is rising prices for grains and for the farmland that produces them. Global grain inventories, drought pending, are expected to rise this year, but will still remain well below historical level.
The big thing to keep your eye on here is stocks-to-use ratio. That compares the amount we have on hand to the amount we’re using. The higher the number, the closer we are to having fully stocked granaries. In the case of big commodities like corn, wheat and soybeans, the cupboard’s pretty bare. Based on USDA numbers, the stocks-to-use ratio for 2008-2009 looks to be the second lowest in history.
U.S. ending stocks are projected to nearly double, going from 7 million metric tons to nearly 14 million metric tons. Many countries, even grain powerhouse Argentina, are still holding onto local supply by restricting exports.
Mark McLornan made this comparison in the May issue of Marc Faber’s Gloom Boom & Doom Report: Investing in agriculture today will be like investing in the oil sector in 2001-2002. (If you’ll remember, that’s when oil raced up to $143 a barrel from its $30 low.) Right now, this sector remains locked in underinvestment, so there’s opportunity here, considering the case of future demand.
Invest In Agriculture: Reason #2
Grain consumption is on the rise
The world consumes, on average, 2,600 bushels of grain crop per second. That’s almost twice what we ate back in 1974. And that amount could easily double to 5,200 bushels per second over the next 20 years. The amount of pressure on the global food supply network is enormous. You can see the steep downward trend in wheat supply in the chart below.
Why are we eating so much more grain? The big factor here is meat. Hundreds of millions of people in China and India are joining the middle class. As people get wealthier they eat more meat. And more meat requires more grains to feed cattle and hogs. It takes 10 pounds of grain to produce one pound of meat. Because of that, most of the demand growth for coarse grain and oilseed meal will come from livestock in developing economies or the countries feeding them. So long as the middle class expands, you can be sure meat and grain consumption will follow.
Invest In Agriculture: Reason #3
Biofuels are driving ag demand up to new levels
Most every oil-consuming country has biofuel targets in place that will kick in over the next five years. These places include the U.S., the EU, Canada, Japan, Brazil, India and China. To meet their targets, according to work by Agcapita, we‘ll have to commit some 240 million acres to biofuel production. That represents about 50% of the arable land in North America and about 6% of all the arable land in the world.
Let’s consider ethanol alone for a moment, courtesy of some World Bank stats. From 2004-2007, U.S. biofuel use increased by 50 million tons, while world production increased only 51 million tons. That leaves only 1 million tons left over to cover a 33 million ton increase in the rest of corn demand the world over. Meaning we didn’t cover usage and caused the price to rise. By 2008, U.S. farmers were already planting every available acre with corn, the second biggest planting in 60 years, and producing one of the largest corn crops in history.
This helped push U.S. farmland values up to new record highs. Massachusetts farmland fetched the highest price at $12,200 per acre. As you can see, the biofuel craze puts more pressure on farmland demand. And, there are other pressures as well…
Invest In Agriculture: Reason #4
Arable land per person is falling
We are losing quality topsoil faster than we are replacing it. Quality soil is loose, clumpy, filled with air pockets and teeming with life. It’s a complex microecosystem all its own. On average, the planet has little more than three feet of topsoil spread over its surface. The Seattle Post-Intelligencer calls it the shallow skin of nutrient-rich matter that sustains most of our food. Replacing it isn’t easy. It grows back an inch or two over hundreds of years.
This is not lost on certain farseeing investors. Jeremy Grantham, the curmudgeonly head of the money manager GMO, recently told his clients: Our farmers are in the mining business! Yes, the soil is incredibly deep, but it is still finite. For every bushel of wheat produced, we lose two bushels of topsoil.
We lose topsoil to development, erosion and desertification. Globally, it’s clear we are eroding soils at a rate much faster than they can form, notes John Reganold, a soils scientist at Washington State University. Estimates vary, but in the U.S., the National Academy of Sciences says we’re losing soil 10 times faster than it’s being replaced. The U.N. says that on a global basis, the rate of loss is 10-100 times faster than that of replacement.
In any case, it seems safe to say that good dirt is in short supply. This ensures a growing scarcity of good farmland, and plenty of countries including Saudi Arabia, China, and South Korea, that will pay for it at any price.
For the first time ever we’re in danger of slipping below one acre per person. Of course we don‘t need 2.8 acres per person anymore, because of advances in agriculture over time. But gains in yield per acre are slowing. Over the last 40 years, we’ve increased the yield per acre by 2.1% per year. But the pace of those gains is slowing. Since 2000, the increase in yields per acre has averaged less than 1% per year.
We may see new innovations in seeds or other technology that we can scarcely imagine now. But any solution will take time and money to implement. Meanwhile, the world’s agriculture markets just get tighter and tighter…
Invest In Agriculture: Reason #5
Low water supplies cut down farm productivity
China is a biggie to watch when it comes to food supply dynamics. It feeds 20% of the world’s population on only 10% of the world’s arable land and with only 6% of its water. China’s water tables are falling too. In parts of its traditional breadbasket in the north production of wheat and corn is in jeopardy. Chinese officials are well aware of this urgent need.
As the Financial Times reports: The country is investing heavily in agriculture. Its agriculture budget increased 27% in 2007, 38% in 2008, and about 20% in 2009. No other big country, barring India, has increased spending on farming so much, says the FT. Still, increasing output will be a challenge.
One British study suggests that if China imports to meet just 5% more of its grain demand, it could swallow all the world’s exported grain. In 2007 and 2008, China imported practically zero wheat. However, today imports are on the rise, sometimes increasing over 100% from month to month. Part of that’s due to drought, which we can expect a lot more of in China as the years roll on and the water table decreases even more.
It also means that any way to secure better water supplies will be worth its weight in gold. Growing crops and keeping livestock hydrated uses three-quarters of the world’s water. That’s a lot of water, and China already doesn’t have enough.
A United Nations report puts it in stark terms: The population of China, India, Pakistan, and other big Asian countries will grow 1.5 billion by 2050, doubling the continent’s food demand. Some of the best returns this decade will come from agriculture investing, and the kinds of companies that keep us supplied with water, food, and energy. Position your portfolio accordingly.
Thank you for reading,
Chris Mayer for The Daily Reckoning
More Reading: 2014: The Year the Chickens Come Home to Roost

 Unlike Anything We Have Ever Seen Before
As I have discussed, we are about to witness a major change in the development of international oil, gas, and power generation.
This will involve a massive expansion of unconventional shale gas and tight (usually also called shale) oil production worldwide, along with substantial moves in infrastructure, electrical production and grid networking.
For all of this, cross-border movements quite unlike anything we have ever witnessed will be required.
As such, I recommended six interrelated elements that will be essential in the development of a game-changing approach to energy production and dissemination.
This shift will require:
(1) The identification, prioritization, and availability of technical innovation;
(2) An overall approach to predicting and containing costs;
(3) Attention to the adverse impacts on everyday life from the increasing exploitation of unconventional oil and gas – environmental, local/regional, and economic, market and labor dislocation problems;
(4) Planning flexibility to allow a wider selection of service providers, expertise, equipment, and technique applied to projects internationally, with an emphasis on developing in-country sources of technology, equipment and training worldwide;
(5) Development and application of new models for project finance; and
(6) Comprehensive regulatory and risk management approaches to merge government, private sector and social needs and objectives.
I also spent some time during the briefing and in the private discussions over dinner outlining how all of this could be done. The key is developing a seamless way to integrate the many factors within the six elements above.
This will require early attention to what is needed in countries around the world and identifying who is likely to provide the solutions.
And it is here that we are going to obtain an early indication of the companies, approaches, and breakthroughs that are likely to provide major profits for investors. In fact, what I intend to do here is expand the stage on which individual investors normally operate.
In the future, we will be going global.
To make this happen, there will have to be a primary venue for the planning, identification, coordination and application in the energy sector as needed.
It just so happens that I’m involved in that as well.
In May, as many of you may recall, I was appointed Executive Chair of the Global Energy Symposium (GES).
This ground breaking new effort will bring noted international energy figures together to conduct ongoing analysis and priority identification, along with providing policy recommendations to governments, international agencies, corporations, environmentalists, and social groups.
This effort is so critical that I will be leaving my university appointments to head up this international group. But don’t worry, the way average individuals will profit from this will still continue on right here in OEI and in my specialized investment subscriptions through Money Map.
As we get closer to its first major international conclave in April of next year, you are going to hear a lot more about the GES. But one thing is certain: You are about to get an inside view on some of the most important energy changes in a generation.
Already, the London session has had an immediate impact on wider circles of interest. So over the next several weeks, you are coming along as Marina and I talk to other high-powered groups in Rio de Janeiro, Moscow, and a series of very private meetings at our second home in the Bahamas.
The international energy picture is changing fast and we are going to be right in the center of it.
The recent months have been tough for the U.S. currency. Since July the greenback has lost 6% and dropped to a new eight-month low on Friday. Investors avoided the dollar, firstly after the Fed opted against cutting its stimulus in September and then as the budget spat in Washington pushed the country close to a default. Despite this decline, yesterday, the dollar pulled back from an eight-month low as investors awaited delayed U.S. jobs data.
Many investors think that the Fed will delay trimming its $85 billion-a-month bond-buying program until the economic impact of this month’s partial U.S. government shutdown becomes clearer. The Fed’s taper decision will ultimately be tied to the economic data. Therefore, this week all eyes will be on the crucial nonfarm payrolls report. The report was originally scheduled for release on Oct. 4, but because of the government shutdown, it will be released today. Analysts polled by Reuters expect payrolls to have increased by 180,000 in September, with the jobless rate steady at 7.3 percent. Therefore, a reading anywhere in the 160,000 to 190,000 range would probably be fairly neutral with respect to near-term U.S. dollar direction. Any signs of weakness may reinforce expectations that the Fed would hold off from scaling back its stimulus this year, pressuring the greenback. However, if it is a strong number it would suggest that the shutdown may have had only a limited impact and any strength in the jobs data could be used as an excuse to buy the dollar.
Taking the above into account, investors are probably wondering whether this report can have a positive impact on the greenback or not. When we take a look at the chart, we see that the dollar dropped to its new eight-month low in the previous week. What’s interesting, at almost the same time we saw a new October low in crude oil.
This relationship between the U.S. dollar and light crude has encouraged us to examine their connection in the short term. However, before we focus on this issue, let’s take a look at the long- and the medium-term crude oil chart to see if there’s anything on the horizon that could drive the price of light crude higher or lower in the near future. Let’s start with a look at the monthly chart of light crude (charts courtesy by http://stockcharts.com).
On the above chart we see that crude oil dropped below the long-term declining support/resistance line based on the September 2012 and March 2013 highs (the upper black line). However, the breakdown below this line is not confirmed at the moment. Please note that despite this downward move, crude oil still remains above the long-term declining resistance line based on the July 2008 and May 2011 highs (bold red line).
From this perspective, the picture remains bullish.
Now, let’s zoom in on our picture of the oil market and see the weekly chart.
Looking at the above chart, we see that the price of crude oil declined once again in the previous week and dropped below the October low. In this way, light crude slipped to a new monthly low of $100.03 and closed last week at its lowest level since June. Yesterday, we saw further deterioration and the price dropped below the psychological barrier of $ 100 and hit its new monthly low of $99.41 per barrel.
In spite of this drop, from this point of view, the situation is mixed, because light crude reached the important medium-term support.
As you can see on the weekly chart, crude oil reached the September 2012 top (in terms of intraday highs) in the previous week. Yesterday, light crude extended declines and almost reached the September 2012 top in terms of weekly closing prices. This support level may encourage oil bulls to act and if this happens, we will likely see a pullback to around $104. However, if this zone is broken, the next target level for the sellers will be close to $97, where the 50-week moving average intersects with the previously-broken neck level of the reverse head and shoulders formation.
Before we summarize our today’s essay, we have decided to examine the relationship between crude oil and the U.S. currency in the short term. At the beginning of the month crude oil prices were supported by a weaker U.S. dollar as commodities priced in the dollar became less expensive for holders of other currencies. Did this relationship remain in place in the following days? Let’s take a closer look at the chart below.
On the above chart we see that at the beginning of the month the dollar was under selling pressure as a U.S. government shutdown began. These circumstances resulted in a downward move, which took the U.S. currency to its lowest level since February. At the same time, crude oil rose to its monthly high of $104.38, which confirmed a strong relationship between them. However, it seems that in the following days this negative correlation waned. Although there were several days in which a stronger dollar triggered lower prices of crude oil, we almost immediately saw an invalidation of this tendency. Additionally, on Thursday, the dollar and crude oil dropped together. In case of crude oil, we saw a new monthly low. What’s interesting, on the following day we also saw a new October low for the U.S. dollar.
Looking at the above chart, we see that a weaker U.S. dollar hasn’t always been so bullish for crude oil. Please note that a big part of the June-July rally in light crude coincided with higher values of the dollar. We saw similar price action in both cases in mid-June, in August, and then again at the beginning of September. It seems that in this period of time, a stronger dollar pushed light crude higher, not lower. What’s interesting, when the U.S. currency declined it usually triggered corrective moves in light crude in the following days. It was clearly visible at the beginning of September. Please note that the whole September-October decline in the dollar didn’t result in a rally in crude oil. Therefore, we can conclude that although there are short periods of time when the price of light crude is supported by a weaker dollar, overall, they have been positively correlated in the recent months. If this relationship remains in place and we see a rebound in the greenback, we will likely see a pullback in crude oil in the following days as well.
Summing up, although crude oil dropped below the psychological barrier of $ 100, we saw it reach the September 2012 top, which is a medium-term support level. What’s interesting, the USD Index dropped below the 80 level and also reached the medium-term support line. Therefore, it seems that further declines in both cases are quite limited.
Thank you.
Nadia Simmons
Sunshine Profits‘ Crude Oil Expert
* * * * *
Disclaimer
All essays, research and information found above represent analyses and opinions of Nadia Simmons and Sunshine Profits’ associates only. As such, it may prove wrong and be a subject to change without notice. Opinions and analyses were based on data available to authors of respective essays at the time of writing. Although the information provided above is based on careful research and sources that are believed to be accurate, Nadia Simmons and his associates do not guarantee the accuracy or thoroughness of the data or information reported. The opinions published above are neither an offer nor a recommendation to purchase or sell any securities. Nadia Simmons is not a Registered Securities Advisor. By reading Nadia Simmons’ reports you fully agree that he will not be held responsible or liable for any decisions you make regarding any information provided in these reports. Investing, trading and speculation in any financial markets may involve high risk of loss. Nadia Simmons, Sunshine Profits’ employees and affiliates as well as members of their families may have a short or long position in any securities, including those mentioned in any of the reports or essays, and may make additional purchases and/or sales of those securities without notice.
 Legendary hedge fund manager Kyle Bass joins the Financial Sense Newshour to cover a wide range of topics: stocks, bonds, the debt ceiling, and more. He believes the Federal Reserve won’t be raising interest rates for another 3-5 years and that stocks are, unfortunately, “the only game in town.”
Here we present a partial transcript of this thought-provoking interview airing for subscribers this Wednesday:
Jim: Do you feel the debt ceiling debate and the political theater in Washington are hurting U.S. credibility and our capital markets in the long-run?
Kyle: No…the entire world is in the same position we are in one way or another. That’s painting the world with a broader brush, but when you look at the developed western economies (and, of course, we’ll exclude countries with no net debt like Australia and Canada that are natural resource heavy), but the developed western economies with the largest debt loads are all in the same boat. Whether or not they have debt ceilings in the U.S. or bank note agreements like they had in Japan until they recently abolished them, there are all of these potential glass ceilings that are put on the marketplace that always tend to move. I think since 1960 we’ve raised our debt something like 82 times.
Jim: Economists have often said—I’m thinking of “This Times Is Different” by Reinhart and Rogoff—when countries have debt-to-GDP ratios over 100%, they get into trouble; Japan’s is 230%. Why have they not had trouble up until now?
Kyle: When you think about what Reinhart and Rogoff’s book says, it kind of gets to an answer but it’s not the right way to look at things; there are many more variables to analyze the situation with. One is, of course, debt to central government tax revenues—that ratio. Another one is what percentage of your central government tax revenues do you spend on interest alone? Those barometers are much more impactful than just using a debt-to-GDP barometer. And then when you think about Reinhart and Rogoff’s work, if you’ve read all the white papers that they’ve written prior to writing the book, one of the other conclusions that they draw is when debt gets to be about 100% GDP it becomes problematic. Well, what that means is, typically—and, again, painting the world with a broad brush—central government tax revenues are roughly 20% of GDP. So what they’re telling you is when debt gets to be 5 times your revenue, that’s when you start to have a problem. Historically, the analysis that’s been done empirically by academics has focused on the countries that have fallen into a restructuring or a default as a result of this ratio that you and I are discussing. Historically, those have been emerging market economies that have higher borrowing costs. So, it actually makes complete sense that that number is too low when you’re talking about a developed market economy versus an emerging economy because, in theory, a developed economy can borrow at lower rates than an emerging economy can. That being said, in Japan, when the debts are 24 times their central government tax revenue, they are already completely insolvent—it’s just a question of when does it blow up.
Jim: I want to turn our attention to the stock market right now and your view of where you see the markets right now. They don’t seem overvalued when you compare them to 2000 or 2007, but they’re not cheap; and, where do you go in a market when the rate of return on cash or bonds is hardly anything?
Kyle: I think that as long as the Fed—for instance, the Fed is still buying $85 billion a month; almost a trillion a year—you could argue that the Fed is being more stimulative today than they were a year or year and a half ago. When we were running a trillion to a trillion and a half deficits, the Fed, at a trillion dollars in a deficit, was buying every bond that was issued. Today, you have a scenario where the fiscal deficit in the U.S., we think, is somewhere around 650 to 700 billion dollars. So, in theory, the Fed is actually adding more money to the economy today than it was a year ago because the deficit is lower and they’re still buying the same number of bonds. So what I’m saying is the monetary base continues to expand. What the economists are saying is velocity continues to drop at a faster rate than the base is expanding. Well, velocity, I believe, is a coincident indicator at best—possibly a lagging indicator. So, when the v [velocity] turns around that’s when inflation shows up, but for now–you’re asking about stocks…I think, given the lack of nominal yield in the bond market, all of the new money is going to continue into stocks. The interesting thing is it’s going to make the rich people richer and the middle and lower class won’t be any better off, which is the opposite of what the administration is trying to pull off.
Jim: What is your outlook on when the Fed will taper or, eventually, raise interest rates?
Kyle: I personally think that what enables the Fed to taper, again, is a contraction in the fiscal deficit. Now, part of that equation will be remedied by higher tax collections; unfortunately, the other side of that equation is, of course, lesser spending, which isn’t going to happen. So, I believe they can taper to the extent that the fiscal deficit has contracted. I don’t think that they’ll be able to raise the Fed funds rate any time in the foreseeable future—3 to 5 years.
Jim: So, that would argue that stocks would be a better play.
Kyle: Unfortunately…because it feels like they’re making it the only game in town. It’s not your choice, but it’s the only answer though. [End transcript]
In the rest of this must-listen interview, legendary hedge fund manager Kyle Bass gives investors his most recent views on Japan, the impact and outlook for shale gas in the U.S., and a wide range of other topics.
If you would like to hear this full must-listen interview with Kyle Bass ariing this Wednesday, CLICK HERE to subscribe. In addition to hearing from money managers, institutional investors, and analysts regularly interviewed for FS Insiders, you’ll also gain access to our entire archive of past interviews.

-
I know Mike is a very solid investor and respect his opinions very much. So if he says pay attention to this or that - I will.
~ Dale G.
-
I've started managing my own investments so view Michael's site as a one-stop shop from which to get information and perspectives.
~ Dave E.
-
Michael offers easy reading, honest, common sense information that anyone can use in a practical manner.
~ der_al.
-
A sane voice in a scrambled investment world.
~ Ed R.
Inside Edge Pro Contributors

Greg Weldon

Josef Schachter

Tyler Bollhorn

Ryan Irvine

Paul Beattie

Martin Straith

Patrick Ceresna

Mark Leibovit

James Thorne

Victor Adair