
Energy & Commodities
The bear market I’ve been tracking for you isn’t confined only to gold.
I warned you quite some time ago that the price of crude oil would fall substantially, to below $70 a barrel and quite possibly lower, before it bottoms.
Since Oct. 16, oil has plunged from $102.49 a barrel to $94.11, an 8.2 percent hit.
More losses are coming for oil. This monthly chart confirms it.
 As you can clearly see, oil’s rally since its 2009 crash-era low has been choppy, with overlapping waves. This is not the kind of action that is conducive to a bottom.
Instead, it’s typical of a bear market that has not ended, and that has another leg to the downside coming.
That leg down is beginning now. Major technical support lies at $60-$62, and should that give way, oil will not bottom until it falls to as low as $40.
Hard to believe, when there are so many die-hard oil bulls out there? When there are so many political hotspots around the world that could cause oil to rally?
Well, that’s what they said about gold back in September 2011 when the Fed announced QEIII. No way, they said, could gold go down. But it did, and it fell hard.
From a fundamental point of view, oil is not bullish. Oil inventories have been rising for seven straight weeks. Last week, they rose 5.2 million barrels. Over the past four weeks, inventories have risen by 22 million barrels, the second largest increase since February 2009.
What’s especially difficult for oil right now is Europe. The euro region is in a freefall. Almost every country in Europe is contracting, severely. Unemployment continues to soar. Disinflation has tightened its grip, with the latest inflation data so bad — at 0.7 percent year-over-year, that the European Central Bank cut rates to 0.25 percent, a record low.
In addition, the U.S. is well on its way to 100 percent energy independence. OPEC is losing control over the energy markets, and right now, that’s hugely bearish for crude oil.
But mark my words, once oil bottoms, a new bull market will be hatched.
How so, when there are do many dynamic changes occurring in the oil market, with the U.S. set to become energy independent?
There are three reasons oil will soar again, after it bottoms.
First, there’s China. While China is home to oodles of natural gas, its economy is still oil thirsty and will be for a very long time.
In September, China surpassed the U.S. as the largest buyer of oil in international markets. China’s net oil imports reached 6.3 million barrels a day, passing the U.S. at 6.2 million barrels per day, according to U.S. government reports.
Total Chinese demand for oil could reach about 10 million barrels per day and rise to a staggering 18 million barrels per day by 2035, according to data compiled by the World Bank.
In terms of dependence on oil, the U.S. and China are moving in opposite directions. While the U.S. will soon be energy independent, China will soon be the No. 1 consumer of oil and almost entirely dependent upon foreign supplies.
Second, there’s incipient global inflation and a coming end to the dollar reserve system. Europe won’t be stuck in disinflation for long. Nor will anyone else. At some point in the not-too-distant future, central bank money printing will result in much higher inflation and that will be bullish for oil prices.
In addition, the U.S. dollar will eventually lose its reserve currency role, and be supplanted by a new global reserve currency, in electronic form. The dollar’s diminished role and the uncertainty of a new monetary system and reserve currency is bound to be very bullish for oil prices.
Third, there’s the war cycles. As I’ve discussed and showed you before, the cycles of war point consistently higher into the year 2020. Rising geo-political tension around the globe is going to accelerate in the months and years ahead, putting a firm bid under oil prices.
How can you play the downside in oil over the next few months, as oil heads toward a major bottom?
Simple. Consider buying shares in an inverse ETF. My favorite oil ETF is the ProShares UltraShort DJ-UBS Crude Oil (SCO).
What about energy shares? With very few exceptions, most should trade lower along with oil over the next few months. Then, energy shares will become a fantastic buy.
Lastly, as noted in my previous columns, keep a close eye on gold right now. The action in the yellow metal is critical; it’s in the middle of a timeframe for a major low. And while new lows in gold are still possible, gold is inching its way closer to that point in time where it blasts off again.
Best wishes,
Larry

Tomorrow’s Copper Demand
According to the Minerals Education Coalition every American born will need 978 pounds of copper over their lifetime.
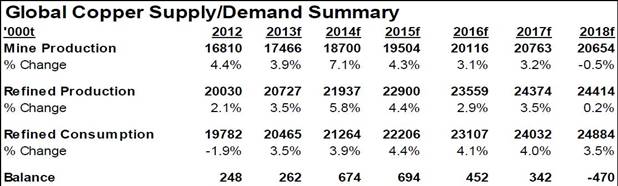
We can see in the above Wood MacKenzie, Macquarie Research graph, from an August 2013 report, a projected refined shortage in 2018. The surplus forecast between now and then is diminutive in relation to the sheer size of the copper market and copper production often falls short of forecasts due to accidents, strikes, ore degradation or power shortages. Disruptions in the copper market averaged 900,000 tonnes of copper supply per year between 2004 and 2012.
We already have one billion people out of today’s current population slated to become significant consumers by 2025.
Another 2.8 billion people will be added to the world between now and 2050. Most will not be Americans but they are going to want a lot of things that we in the western developed world take for granted – electricity, plumbing, appliances, AC etc.
Out of a total of 10 billion people in 2050, 8.2 billion of them are expected to be in developing countries.
How much copper could they expect to use over their lifetime?
Will they each use 978 lb’s of copper in their life time? Is there 8 plus trillion pounds of new copper left to be mined in the world?
Probably not…
According to a September 2013 report from the United States Geological Survey (USGS) global land-based copper resources (contained in identified, mined, and undiscovered resources – undiscovered resource numbers are based on geological modeling, the copper should, might, be there) exceed 3 billion tons (6 trillion pounds). These identified, mined, and undiscovered resources do not include deep-sea nodules and submarine massive sulfides.
“Infinite growth of material consumption in a finite world is an impossibility.” E. F. Schumacher
“We’re living in a finite world, one in which resource constraints are becoming increasingly binding.”Paul Krugman, ‘The Finite World’
Conclusion
If we mined every last discovered, and undiscovered, pound of land based copper the expected 8.2 billion people in the developing world would only get three quarters of the way towards copper use parity per capita with the U.S.
Of course the rest of us, the other 1.8 billion people expected to be on this planet by 2050, aren’t going to be easing up, we’re still going to be using copper at prestigious rates while our eastern cousins play catch up.
Copper use parity isn’t going to happen, it can’t.
It’s this author’s opinion the developing world will not get a third of the way to our development levels here in the west before we all run out of USGS stated copper resources to mine.
Consider that this game of ‘Copper Catch Up’ is not going to happen in 100 years, it’s happening now.
The world’s exploding population, the massive shift from rural to urban, the growth of a very consumption minded middle class in developing countries, it’s all happening now.
Add in finite, increasingly hard to source resources.
The effects will felt long before we actually start to run out of copper and there will be severe consequences:
- Rising energy and commodity prices
- A decline in the global economy
- Civil unrest
Are the coming consequences of living in a finite world on your radar screen?
If not, they should be.
Richard (Rick) Mills
About Richard Mills
Richard is the owner of Aheadoftheherd.com and invests in the junior resource/bio-tech sectors. His articles have been published on over 400 websites, including:
WallStreetJournal, USAToday, NationalPost, Lewrockwell, MontrealGazette, VancouverSun, CBSnews, HuffingtonPost, Londonthenews, Wealthwire, CalgaryHerald, Forbes, Dallasnews, SGTreport, Vantagewire, Indiatimes, Ninemsn, Ibtimes, Businessweek, HongKongHerald, Moneytalks and the Association of Mining Analysts.
If you’re interested in learning more about the junior resource and bio-med sectors, and quality individual company’s within these sectors, please come and visit us at www.aheadoftheherd.com
If you are interested in advertising on Richard’s site please contact him for more information,rick@aheadoftheherd.com
***
Legal Notice / Disclaimer
This document is not and should not be construed as an offer to sell or the solicitation of an offer to purchase or subscribe for any investment.
Richard Mills has based this document on information obtained from sources he believes to be reliable but which has not been independently verified.
Richard Mills makes no guarantee, representation or warranty and accepts no responsibility or liability as to its accuracy or completeness. Expressions of opinion are those of Richard Mills only and are subject to change without notice. Richard Mills assumes no warranty, liability or guarantee for the current relevance, correctness or completeness of any information provided within this Report and will not be held liable for the consequence of reliance upon any opinion or statement contained herein or any omission.
Furthermore, I, Richard Mills, assume no liability for any direct or indirect loss or damage or, in particular, for lost profit, which you may incur as a result of the use and existence of the information provided within this Report.

On December 20, 1922, a surveyor — J.G. Tierney — made his way along the Colorado River by barge. Tierney, who worked for the U.S. government, was surveying a remote spot in the Mojave Desert called Boulder Canyon.
Boulder Canyon sits in the middle of some of the most unforgiving land in America.
During the summer, temperatures frequently top out near 120 degrees. Less than five inches of rain fall each year. Rattlesnakes and scorpions hide under rocks. And the sharp cliffs are near-impossible to scale.
And yet, this canyon in the heart of the desert holds one of the greatest investments in U.S. history… one that has generated billions of dollars in wealth and is practically guaranteed to keep doing so for decades.
But it wasn’t without its costs. In total, 112 men — beginning with J.G. Tierney, who on that December day drowned after falling off the barge that carried him and his equipment — died to create this investment.
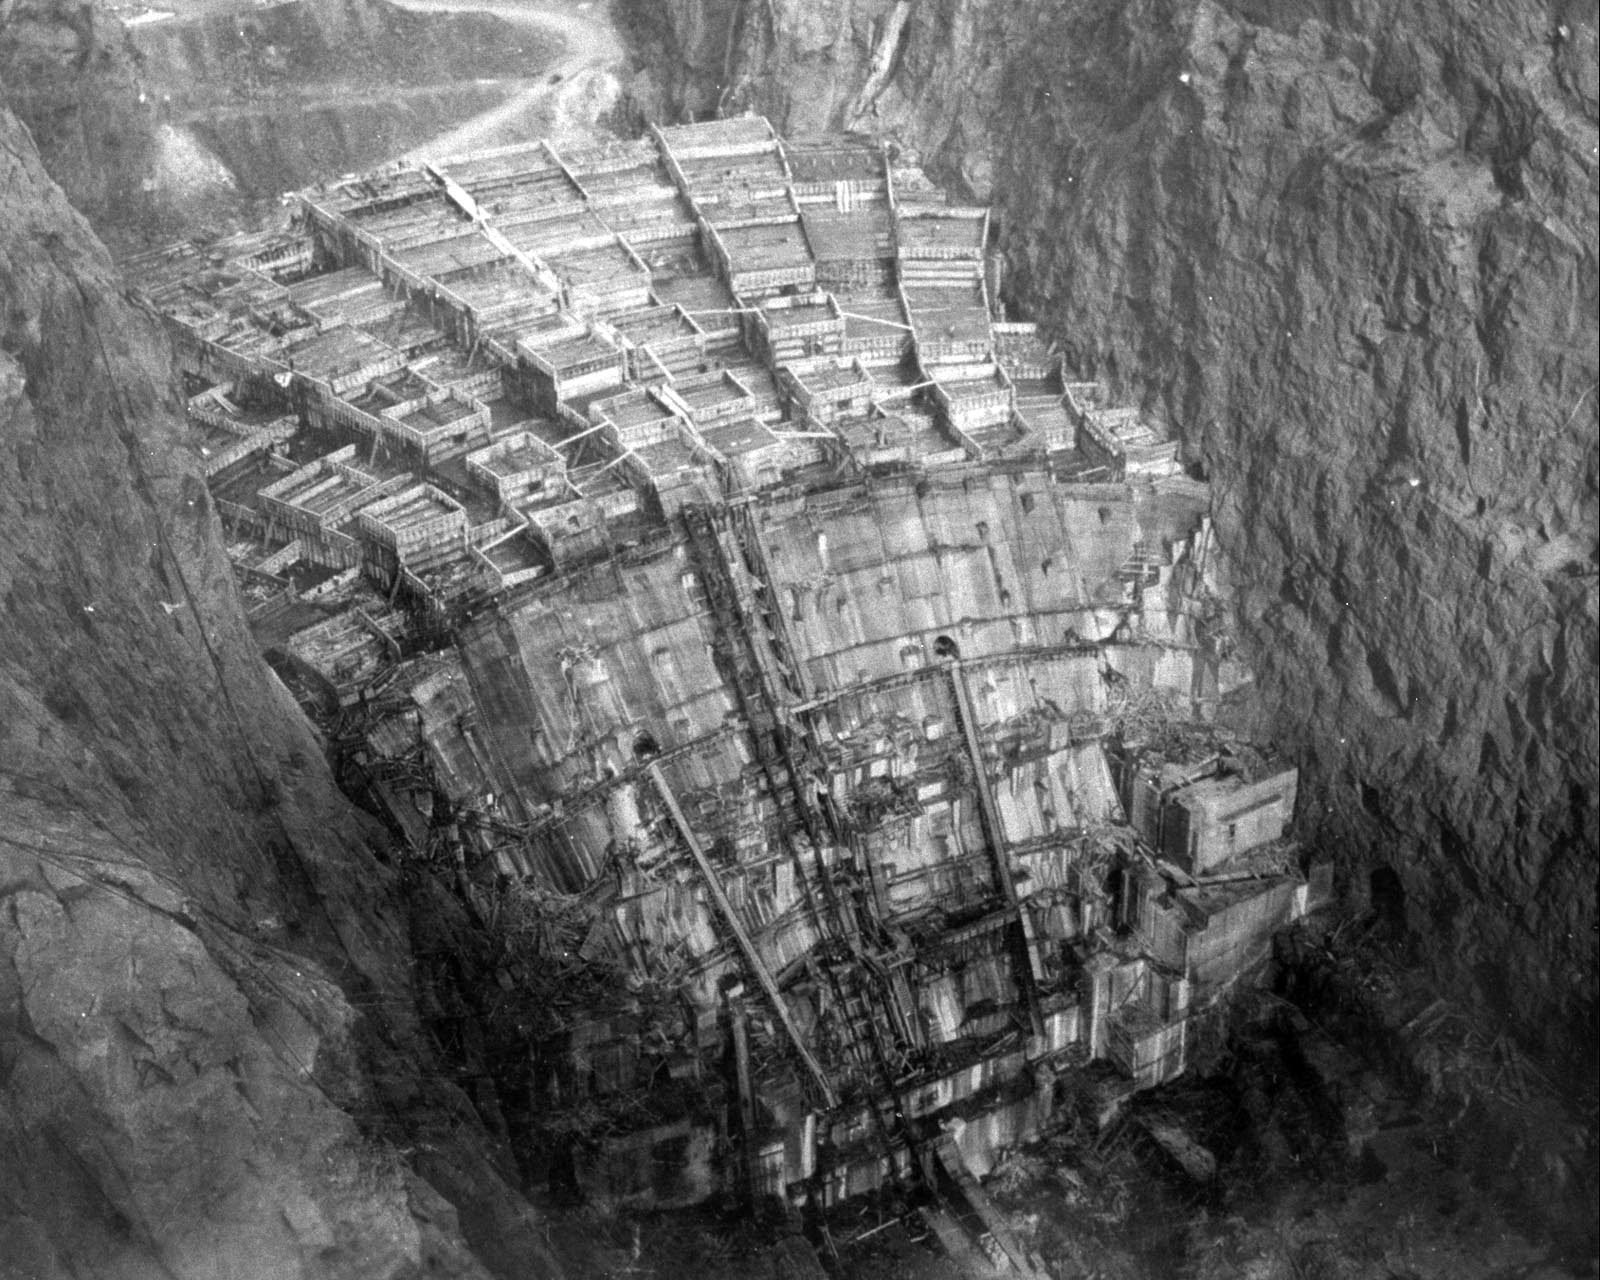 I’m talking about Hoover Dam.
Before I get too far… no, I am not recommending that you invest in the Hoover Dam. Even if you wanted to, it’s fully owned by the U.S. government. There’s not a stock you can buy that gives you access.
Instead, it’s what Hoover Dam represents that is the true opportunity to grow your wealth.
Let me explain…
Hoover Dam (originally called Boulder Dam) was finished in 1936, at which point it began damming the Colorado River to create Lake Mead — the United States’ largest reservoir.
The project was massive. At its peak, more than 5,000 people worked on it at the same time. And the dam contains enough concrete to pave a two-lane highway from San Francisco to New York City.
In total, construction costs came to $49 million.
That $49 million investment is the sole reason why millions of people are able to live in the Las Vegas area today. And it has generated billions of dollars of wealth in the process.
But Hoover Dam didn’t just create a massive reservoir to provide water to the middle of the desert. It also created one of the most lucrative electricity generation plants ever built.
Located in the base of the dam are 17 hydroelectric turbines that make up the Hoover Powerplant. These turbines generate roughly 4.2 billion kilowatt hours (kWh) of electricity per year, making it one of the largest hydroelectric plants in the United States.
Electric providers love hydroelectric power because it’s among the cheapest power sources on the planet. Hoover Powerplant sells its electricity on the wholesale market at just 1.6 cents per kilowatt hour. In comparison, Las Vegas residents pay an average of 11.6 cents per kWh for electricity — seven times as much.
But even at that low cost, Hoover Dam generates and sells about $63 million in electricity every year (1.6 cents x 4.2 billion kWh) — that’s nearly 130% of what it cost to build the dam in the first place.
Of course, there are a number of other costs such as maintenance and upkeep that figure into the equation, but the point remains — Hoover Dam has become one of the greatest individual investments ever made by the U.S. government. And it continues to increase its return year after year.
So how can this help us as investors? After all, as I mentioned earlier, you can’t invest directly in Hoover Dam.
You simply have to understand why Hoover Dam has been such a success…
Hoover Dam is what I like to call an “irreplaceable asset.”
No one can come along and build a competing dam. And the world isn’t going to run out of a need for electricity. If anything, we’ll need more electricity in the future.
That’s why even 76 years after it was built, the dam is more important today than ever.
And while you can’t invest in Hoover Dam, there are dozens of irreplaceable assets around the world — including many hydroelectric dams — that you can invest in.
And as you would expect, investing in these irreplaceable assets has proven to be extremely profitable.
Take oil and gas pipelines, for example. Pipelines are the ultimate irreplaceable assets. Another company can’t simply build a pipeline next to an existing one. And the pipelines that carry fuel, natural gas, oil, and other commodities across the country aren’t about to be replaced by some new technology.
That’s why I’ve loaded up on pipeline operators, which are typically structured as master limited partnerships (MLPs), in my Top 10 Stocks portfolio.
In fact, pipelines have been one of the strongest corners of the market for years. The benchmark for master limited partnerships — the Alerian MLP Index — has returned 328%, including dividends, during the past decade… or almost 16% a year. That’s over three times the S&P 500’s 10-year performance.
But there are more irreplaceable assets than just pipelines.
Take my investment in Brookfield Infrastructure (NYSE:BIP). Brookfield owns toll roads, electricity transmission grids, ports, and railroads all over the globe. All of these are irreplaceable assets. And they continue to earn a steady stream of cash for BIP and its investors.
This is exactly why I added the shares to my Top 10 Stocksportfolio more than two years ago. And it’s why the stock is one of my biggest winners — up 67% in just over two years while paying a yield of 4.4%.
Don’t get me wrong, there are no guaranteed winners in the investing world. Any investment can fall in value. But when you find the sort of securities that give you access to irreplaceable assets, they often end up being some of the most lucrative investments to own for the long term.
Note: It’s no surprise that our “Top 10 Stocks For 2014” report lists several companies that own irreplaceable assets, helping many of these companies dominate or even monopolize their markets. These cash-rich stocks not only throw off dividend yields twice as high as the S&P 500, they also handily outperform it. Through 2012, our annual list of Top 10 Stocks have beaten the market 7 out of 10 years. Visit this link to get all the details…
Good Investing!
Elliott Gue
Top 10 Stocks
Goldman Sachs Report: Is There No End to the Bakken Trend?
One year ago, I wrote this story, asking—could the Bakken ever hit 1 million barrels of oil per day (bopd) production?
Well, now the Market is asking—when (not if) will it hit 2 million?
A massive, 76-page report from Goldman Sachs from late September suggests 2023—that’s another TEN YEARS of growth—with the biggest growth year being next year, in 2014.
In fact, they say the worst case scenario for the Bakken is now 1.3 million in 2017. One million? Pfffftttt…yesterday’s news.
A smaller examination from Credit Suisse in early October suggests the same thing. Analysts from these investment giants went to the Bakken to find out firsthand whether this prime play has peaked.
And the two groups independently returned with the same answer: no.
Two factors will continue to drive Bakken production growth for at least another decade: tighter well spacing and production from deeper zones. There’s enough life in these drivers that Goldman’s analysts started off their Big Report by stating they “believe production from the Bakken horizontal oil shale play in North Dakota and Montana can continue to grow substantially.”
If deeper zones and tighter well spacing were not spurring resource expansion, Bakken oil production would plateau at 1.3 million bpd in 2017. That would mean the Bakken only offered a few more years of growth, and at a much slower pace than we have seen to date.
Instead, Goldman expects the Bakken to peak at 2 million bpd and not until 2023. To get there, they figure production growth will average 130,000-210,000 bopd a year, well above the 110,000 bopd increase that we saw in the first half of this year.
First, the play has been de-risked and its areal extent defined. Bakken operators now known where and what the Bakken is.
However, they are still figuring out how well spacing and drilling depths impact everything, like how much oil they can pull from the formation.
At first, producers drilled Bakken wells on 640-acre spacing, one per square mile. Then they moved with good success to 320-acre spacing. With shale formations, the worry is that wells drilled too close together tap into the same oil and limit each other’s productivity. (The industry says that wells are communicating.) However, this year operators started to test 160-acre spacing – and met with great success in some areas.
Not every part of the Bakken will be able to support 160-acre well spacing, but the analysts at Goldman figure 20% of the Bakken can handle it. They also think downspacing, as it is known, will get seriously underway in the next six months because lots of Bakken E&Ps are testing tighter spacings now.
Second, Goldman sees production rising as producers tap into deeper reserves. The Bakken is a layer cake, with five oil-bearing layers amongst nine total layers. The top two oily layers, the Middle Bakken and Three Forks 1, currently account for most of the Bakken’s production.
Underneath these layers lie three more oil-bearing shale formations, known as Three Forks 2, 3, and 4. So far wells drilled into these deeper layers have been mostly exploratory, but there have been some successes, especially from Three Forks 2. This bodes well for at least some deeper Bakken production.
On top of all that potential for production growth, the Bakken is also becoming more efficient. Better geologic understanding and more experienced drillers mean well costs and timelines are both coming down.
Slow output growth in H1 2013 but different drivers to come
Bakken production growth did slow notably in the first half of 2013—Goldman says that was due to weather issues, and the timing of bringing pads online.
As the Bakken matures more operators are shifting to multi-well pads, which take longer to establish but are more efficient in the long run. This transition really hit in H1 ‘13, which means the slowdown in output growth was really just a delay.
As all those multi-well pads come online, all that delayed output will boost Bakken production once again – with the biggest boost coming next year, when the guys at Goldman expect Bakken oil production to climb 212,000 bpd. After that they foresee output growth of 165,000 bpd in 2015 and 115,000 bpd on average in 2016-2018.
Efficiency, not rig count, is what matters
Production growth in the Bakken is still happening, despite fewer wells being drilled. Rig counts are used to measure how busy a play is and a declining number added to concerns the Bakken boom was ending.
What makes rigs more efficient? Well trained crews. Experience–operators now understand their acreages and geology better, and so can spot wells more accurately. Small technical improvements like better fluids and drilling technology means wells get drilled more quickly and the rigs can move on to the next job sooner, reducing the needed number of drills.
Fewer rigs does not mean fewer wells. Goldman forecasts well completions will also rise even as the rig count declines, with faster drilling times. They see 20% more wells drilled in 2013-2017 compared to 2011-12, even assuming a 20% lower rig count.
And pad drilling is starting to happen in the Bakken—where the industry drills 8-10 wells from one 10 acre site. This requires fewer rigs to complete the same number of wells.
Goldman sees no end to this trend. In fact, their analysts predict an average of just 150 rigs in 2014 through 2017, down from a peak of 213 in mid-2012, even as Bakken production climbs from just over 700,000 bpd today to an estimated 1.6 million bpd in 2017.
A more accurate measure isn’t the number of rigs drilling, but the number of feet that get drilled. A lot of operators are now doing two mile plus laterals—longer than ever before. That reduces the rig count as well.
Credit Suisse adds that these longer laterals—with more fracks spaced more tightly together—are boosting recoveries, and with not much added cost. These analysts say companies in the core of the Bakken are now guessing they will recover as much as 940 million barrels of oil equivalent (mboe), compared with 650 million boe in 2012.
So a smaller rig count is simply a result of a better, more efficient Bakken – not, as the Street worries, because of lack of inventory.
Digging into those deeper zones
Most horizontal drilling activity in the Bakken has focused on the Middle Bakken, a limestone, dolomite, siltstone and sandstone layer that lies about 4,500 feet below surface on the eastern edge of the basin, deepening to 11,000 feet below surface in the southwest corner of North Dakota.
The source rock for the Middle Bakken – the part of the formation that supplied the oil now in the Middle zone – are the Upper Bakken shale, a 23-foot thick layer just above the Middle Bakken, and the Lower Bakken Shale, a 50-foot thick formation just below.
The Three Forks formation is beneath all of that. This 250-foot thick section has 4 different layers, all of which also got their oil from the Lower Bakken Shale. The uppermost Three Forks layer (Three Forks 1, or TF10) has been largely derisked – in other words, it is producing.
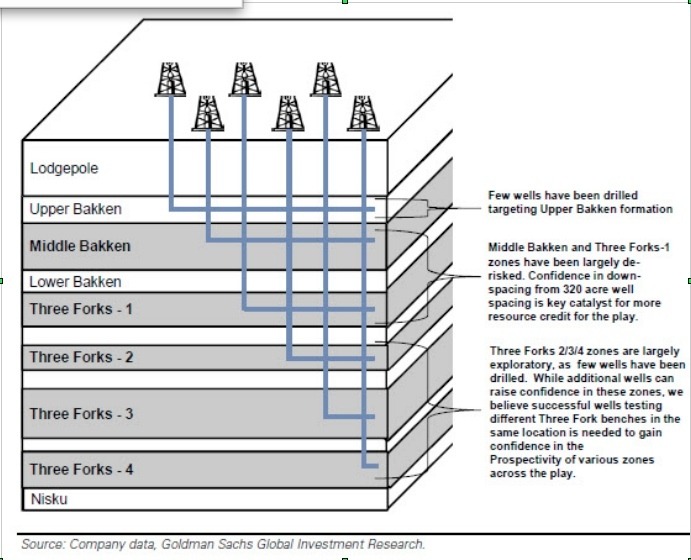
Three Forks 2, 3, and 4 are still largely exploratory.
Three Forks 2 (TF2) is certainly showing promise, though primarily in McKenzie County, in the core of the Bakken. Continental, ConocoPhillips, and EOG have all drilled successful TF2 wells in McKenzie County.
There have also been successful TF3 wells, and while the numbers are fewer the geographic spread is greater. Operators have reported successful TF3 wells in four different counties.
The sector is still waiting for a strong TF4 well. Only two TF4 wells have been drilled to date, both by Continental, and neither well produced economically
A key question is whether Three Forks 2, 3, and 4 can be developed independent of TF1. It is possible that wells drilled into the Middle Bakken and Three Forks 1 may have depleted the Lower Three Forks interval.
In short, the data is still limited and key questions remain unanswered. Nevertheless, Goldman assumes 25% of the Bakken will generate some productivity from Three Forks 2, 3, and 4. That can only help.
And of course, this report was written before Whiting Petroleum (WLL-NYSE) and EOG Resources (EOG-NYSE) showed the Market in early October that they can greatly increase the EUR of a Bakken well by using short wide fracks vs. long skinny ones—you can read my story on that HERE.
So it’s possible late 2014 I’m writing a story…the Bakken only producing 2 million barrels a day? Pffffttt…that’s old news.
– Keith
Editor’s Note: As I stated above, faster drilling times and rising well completions are two key components in Goldman’s forecast. So how can investors capitalize? One OGIB stock—one of my top picks—has doubled their U.S. market share in the last few years…and the Market continues to reward its growth, in a big way. My research report spells out this opportunity in detail—you can read it here.
 Commodities can be a portfolio hedge
The most unsettling thing about commodities investments—their inherent risk—is also their best feature as an alternative investment strategy, financial advisors say.
Because the performance of commodities does not correlate with that of equities or fixed income, allocating a small percentage of a portfolio to natural resources can actually lower the overall risk in the long term, said Patrick Robert, co-founder and CEO of PKR Investments, a financial consulting firm.
“For people who want [their portfolios] to be diversified, if they’re not hitting a home run right out of the gate [with equities], commodities can act as a hedge,” said Robert, who is also a certified financial planner.
….read more HERE

-
I know Mike is a very solid investor and respect his opinions very much. So if he says pay attention to this or that - I will.
~ Dale G.
-
I've started managing my own investments so view Michael's site as a one-stop shop from which to get information and perspectives.
~ Dave E.
-
Michael offers easy reading, honest, common sense information that anyone can use in a practical manner.
~ der_al.
-
A sane voice in a scrambled investment world.
~ Ed R.
Inside Edge Pro Contributors

Greg Weldon

Josef Schachter

Tyler Bollhorn

Ryan Irvine

Paul Beattie

Martin Straith

Patrick Ceresna

Mark Leibovit

James Thorne

Victor Adair