
Economic Outlook
The long-running Greek debt tragedy is almost over. The International Monetary Fund may be the first to blink at the end of next week, triggering another global financial crisis. Not surprisingly for financial markets the worry at the moment is Greece, Greece, Greece.
International Monetary Fund CEO Christine Lagarde told Germany’s Frankfurter Allgemeine Zeitung she could not ‘preclude’ a Greek exit, after four months of tortuous bail-out talks that have failed to get both sides closer to a deal to release aid to the country.
Optimism fades
‘No one wishes the Europeans a Grexit,’ said Ms Lagarde, hinting that Greece is closer to leaving the single currency than ever before. Extinguishing recent hopes in Athens that the two sides were ready to draft an agreement by the end of the week, Ms Lagarde said recent optimism over the country’s future had ’sobered’.
‘It’s very unlikely that we will reach a comprehensive solution in the next few days’, Ms Lagarde told the newspaper during a summit of G7 leaders in Dresden on Thursday.
Peter Rosenstreich, chief FX analyst at Swissquote Bank, explains why he thinks the market is finding the Greece deal situation ‘numbing’ right now…

Video link click here!

 The biggest trade deal in a decade is on its way to being fast-tracked through the U.S. Congress, which if happens means no debate, no amendments. What makes TPP or Trans Pacific Partnership different? It stands out in size as 40% of world trade will be involved. But it’s surrounded in secrecy. Singapore-based investor Jim Rogers explains that some industries are going to boom and some are going to collapse with the passage of this bill in this 3.41 minute interview.
The Trans-Pacific Partnership (TPP) is a proposed regional regulatory and investment treaty involving twelve countries throughout the Asia Pacific region.

We live in an age where bad economic news is not only unwelcome, but it is routinely overlooked or excused. On the other hand, good news is spotted and trumpeted even when it doesn’t exist. An ideal illustration of this dangerous tendency towards collective selectivity came last week when the markets and the media somehow turned an awful employment report into an ideal data set that confirmed all optimism and contained nothing but good news for investors. In truth, it was anything but.
The stakes were high with this year’s April non-farm payroll report. It was the first major employment report of the Second Quarter and it was hoped that it would show an economy bouncing back from a sluggish winter. But there was cause for concern. The March report had been an unmitigated disaster. Only 126,000 jobs were created when 247,000 were expected. Then, two lesser April employment reports had been released, the ADP private payroll data and the Challenger jobs cuts report that came in far below expectations (Challenger showed the biggest month over month increase in layoffs in three years). Even more harrowing was the recently released .2% annualized GDP in the First Quarter, a dismal April trade deficit, and the worst back to back monthly productivity reports in almost a decade. We needed good news, and we needed it bad.
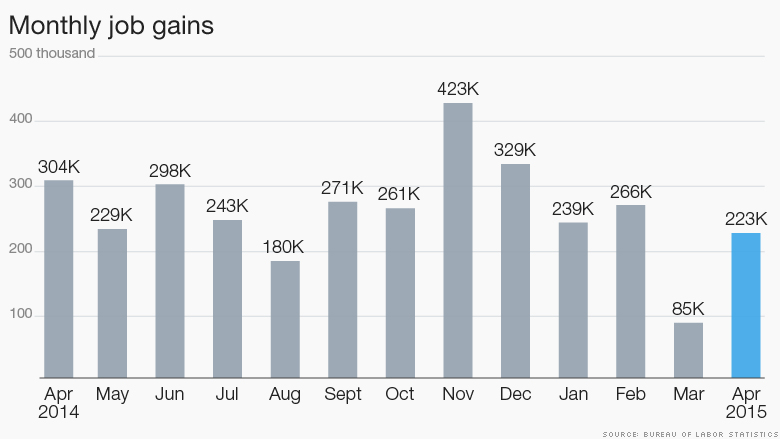
The April report’s headline was all most people needed to see before breathing a collective sigh of relief. 223,000 jobs were created during the month, which was a full 3,000 jobs more than the 220,000 that had been predicted by the consensus of economists. In addition, the unemployment rate held at a very low 5.4% (matching the consensus), the lowest number since the Market Crash of 2008. The steady rate, and the modest beat (of a modest expectation) were received like a strand of garlic to ward away evil spirits. Icing the cake was the understanding that the report was not so good that it would accelerate the Federal Reserve’s timetable to raise interest rates. As a result, it was termed a “Goldilocks” report, which many consider to be the best of all possible outcomes. But even a casual look beneath the surface should have thoroughly deflated the euphoria.
The biggest shock should have been the downward revision of the already weak March numbers, which most people had expected would be revised upwards. Instead, 41,000 jobs were cut from March, leaving only 85,000 hires for the month, making it the worst month in job creation in three years. If March and April were averaged, we would only have about 150,000 jobs per month, numbers that would be indicative of a very weak economy. And don’t forget, April may be revised down next month just as drastically as March.
As you dig down, it gets worse. Average hourly earnings only increased .1%, which was exactly half of the expected .2% increase. They also revised down March’s gain from .4% to .2%. The report showed that the number of Americans who have left the labor force has hit an all-time high of 93,149,000. But the most important set of ignored ugly data was the breakdown of full time vs. part time jobs.
As far as the headline number of job creation is concerned, all jobs are equal. No matter if they involve brain surgery or lawn mowing, or if they are full time or part time, a job is a job. But the April Household Survey, which is released in support of the Nonfarm Payrolls, showed an increase of 437,000 part-time jobs, the biggest gain in part-time employment since June of last year. At the same time, the number of full time jobs declined by 252,000, the biggest drop of the year. Instead of talking about these lost real jobs, we talk about net gain in the total number of jobs which was only made possible by the huge increase in part time jobs. It is safe to say that a great many of those who found part time jobs would have preferred something with more hours and more pay. These facts show how the types of jobs Americans are finding continue to deteriorate, and explains why wage growth has been so disappointing.
It’s also worth noting that up to 175,000 of the new jobs reported in April resulted from assumptions that government statisticians make using the birth/death model. This technique compensates for unknown business formation to assume that a certain number of businesses come into being when the economy is strong. And since the government assumes that the economy is currently strong, it assumes those jobs were created. How convenient.
Another disturbing aspect of the Household Survey is the demographic breakdown of who is working and who is not. In April, workers aged 55 and older gained 266,000 jobs, while workers aged 25-54 lost 19,000 jobs. These results should blow another hole in the theory, repeatedly espoused by Janet Yellen and others, that the labor participation rate is falling because of retiring baby boomers. If that were the case, then you would see the number of older workers going down, not going up. The people who should be retiring are instead taking part-time jobs to keep food on the table or to pay their electric bills. It’s the younger workers, in the prime of their earning potential and who need to be working, who are leaving the labor force in droves.
The fact that this dog of a report could be received like a beauty queen is a testament to how desperate and intellectually complacent Wall Street economists have become. In the days since the report was issued, data that confirms a strong spring rebound has yet to materialize. April retail sales and March business inventories were flat and below expectations. If analysts actually delved beneath the rosy headlines, they would not be surprised that debt-laden consumers, with part-time jobs facing rising costs of basic necessities, were too broke to shop.
The story was much different last spring, when the economy was rocketing upward after contracting in First Quarter. Yet the optimism for the full year surprisingly persists. Few major Wall Street firms have cut their full year GDP predictions below 2.0%, even though such sluggish growth seems more and more likely. The Fed itself has only backed off slightly from its 2.6%-3.0% “Central Tendency” 2015 growth forecast that it issued last December, and now sees full year growth from 2.3%-2.7%. That is already starting to look like wishful thinking. (See my previous commentary). But optimism is hard to kill. Maybe because that’s all we have?
Economic data from employment situation report Bureau of Labor Statistics
Best Selling author Peter Schiff is the CEO and Chief Global Strategist of Euro Pacific Capital. His podcasts are available on The Peter Schiff Channel on Youtube
Catch Peter’s latest thoughts on the U.S. and International markets in the Euro Pacific Capital Winter 2015 Global Investor Newsletter!

 Today, we have bad news and good news.
The good news is that there will be no 25-year recession. Nor will there be a depression that will last the rest of our lifetimes.
The bad news: It will be much worse than that.
Yesterday, the Dow rose another 43 points. Gold seems to be working its way back to the $1,200 level, where it feels most comfortable.
“A long depression” has been much discussed in the financial press. Several economists are predicting many years of sluggish or negative growth. It is the obvious consequence of several overlapping trends and existing conditions.
Old People Are Dead Wood
First, people are getting older. Especially in Europe and Japan, but also in China, Russia and the US.
As we’ve described many times, as people get older, they change. They stop producing and begin consuming. They are no longer the dynamic innovators and eager early adopters of their youth; they become the old dogs who won’t learn new tricks.
Nor are they the green and growing timber of a healthy economy; instead, they become dead wood.
There’s nothing wrong with growing old. There’s nothing wrong with dying either, at least from a philosophical point of view. But it’s not going to increase auto sales or boost incomes – except for the undertakers.
The Cure for Debt? More Debt!
Second, most large economies are deeply in debt. The increase in debt levels began after World War II and sped up after the money system changed in 1968-71.
By 2007, US consumers reached what was probably “peak debt.” That is, they couldn’t continue to borrow and spend as they had for the previous half a century. Most of their debt was mortgage debt, and the price of housing was falling.
The feds reacted, as they always do… inappropriately. They tried to cure a debt problem with more debt. But consumers were both unwilling and unable to borrow. Their incomes and their collateral were going down. This left corporations and government to aim only for their own toes.
Central banks created more money and credit – trillions of dollars of it. But since the household sector wasn’t borrowing, the money went into financial assets and zombie government spending. Neither provided any significant support for wages or output. So, the real economy went soft, even as the cost of credit fell to its lowest levels in history.
The Cronies Are in Control
Third, the developed economies have been zombified. The US, for example, is way down at No. 46 on the World Bank’s list of places where it is easiest to start a new business. And only one G8 country – Canada – even makes the top 10.
Paperwork. Expenses. Regulation. High taxes. High labor rates. Entrenched competition with aging, loyal customers. All are endemic from Boston to Berlin to Beijing.
Leading industries – heavily controlled and regulated, including defense, education, health and finance – are practically arms of the government. All are protected with high barriers to entry and low expectations. Competition is barely tolerated. Innovation is discouraged. Mistakes are forgiven and reimbursed.
Meanwhile, the masses are encouraged to become zombies too, with generous rewards for those who 1) do nothing, 2) pretend to work or 3) prevent other people from doing anything. After all the zombies, cronies and connivers get their money, there is little left for the productive economy.
The Solution Begins When Markets Crack
Typically, these problems – too much debt, too many zombies, and too many old people – lead to financial crises. Then, they are “solved” by either inflation or depression. And the solution begins when markets crack.
Markets never go up forever. Instead, they go up, down and even sideways. They breathe in and out. And after sucking in air for the last 30 years, US financial assets are ready to exhale. Legendary asset manager Bill Gross comments:
When does our credit-based financial system sputter/break down?
When investable assets pose too much risk for too little return.
Not immediately, but at the margin, credit and stocks begin to be exchanged for figurative and sometimes literal money in a mattress.
When that happens, problems begin to take care of themselves, in one of two ways…
A quick, sharp depression wipes out the value of credit claims. Borrowers go broke. Bonds expire worthless. Companies declare bankruptcy. The whole capital structure tends to get marked down as debts are written off and financial assets of all kinds lose their value.
Or, under pressure, the feds print money. Debts are diminished as the currency loses its value. The zombies still get money, but it is worth less. Inflation adjustments cannot keep up with high rates of inflation. Pensions, prices and promises fade.
Either way, the slate is wiped clean and a new cycle can begin.
But what rag will clean the slate now?
More tomorrow…
Regards,
Bill
Market Insight:
Invest in What the Fed Can’t Destroy
by Chris Hunter, Editor-in-Chief, Bonner & Partners
Publisher’s Note: Market Insight editor Chris Hunter is away on holiday this week. In the meantime, we thought you might enjoy an excerpt from the March issue of Bonner & Partners Investor Network. In it, Chris speaks with financial iconoclast and truth-teller David Alan Stockman about how to invest in a stimulus-drunk market such as this.
CH: You once said, “I invest in anything that Bernanke can’t destroy, including gold, canned beans, bottled water and flashlight batteries.”
How can our readers protect themselves from the dangers ahead? What one piece of advice would you give somebody who’s worried about another major credit collapse?
DAS: Three big points on this.
First, capital preservation – that is, not losing money – is more important for your readers than capital gains when government and central banks have gone rogue and have chronically violated every known rule of fiscal rectitude and sound money.
That means getting out of harm’s way in all the financial markets – debt, equity, commodities and derivatives – because when the big correction comes they will all experience a thundering collapse.
Second, short-term liquid investments and cash are not as bad as their microscopic yields imply.
The 20-year worldwide central bank credit boom has generated vast overinvestment in mining, manufacturing, transportation and distribution capacity worldwide. But now that the credit inflation is reaching its outer limits, and we are entering what I described as the “crack-up” phase, the forces of global deflation will drive down the price of goods and many consumer services as well.
When the next crisis fully materializes, cash will be king. It will buy more everyday goods and services and will have command over drastically marked-down financial and real estate assets of every kind.
Third, the impending collapse of the global central bank credit bubble will generate unprecedented volatility and drastic movements in asset prices of all kinds.
 If U.S. economic growth falls any lower, we are officially going to be in recession territory. On Wednesday, we learned that U.S. GDP grew at a 0.2 percent annual rate in the first quarter of 2015. That was much lower than all of the “experts” were projecting. And of course there are all sorts of questions whether the GDP numbers the government feeds us are legitimate anyway. According to John Williams of shadowstats.com, if honest numbers were used they would show that U.S. GDP growth has been continuously negative since 2005. But even if we consider the number that the government has given us to be the “real” number, it still shows that the U.S. economy has stalled out. It is almost as if we have hit a “turning point”, and there are many out there (including myself) that believe that the next major economic downturn is dead ahead. As you will see in this article, a whole bunch of things are happening right now that we would expect to see if a recession was beginning. The following are 16 signs that the economy has stalled out and the next economic downturn is here…
#1 We just learned that U.S. GDP grew at an anemic 0.2 percent annual rateduring the first quarter of 2015…
The gross domestic product grew between January and March at an annualized rate of 0.2 percent, the U.S. Commerce Department said, adding to the picture of an economy braking sharply after accelerating for much of last year. The pace fell well shy of the 1 percent mark anticipated by analysts and marked the weakest quarter in a year.
….#2 – 16 HERE

-
I know Mike is a very solid investor and respect his opinions very much. So if he says pay attention to this or that - I will.
~ Dale G.
-
I've started managing my own investments so view Michael's site as a one-stop shop from which to get information and perspectives.
~ Dave E.
-
Michael offers easy reading, honest, common sense information that anyone can use in a practical manner.
~ der_al.
-
A sane voice in a scrambled investment world.
~ Ed R.
Inside Edge Pro Contributors

Greg Weldon

Josef Schachter

Tyler Bollhorn

Ryan Irvine

Paul Beattie

Martin Straith

Patrick Ceresna

Mark Leibovit

James Thorne

Victor Adair