
Daily Updates
“I’ve reached a point where I feel the only asset I have confidence in is gold,”, that is a pretty bold (and scary) statement from a mainstream money manager-Lou
A Billionaire Goes All-In on Gold
You’ve got a perfect storm with no apparent solution,” he said. “If the world does well, gold will be fine. If the world doesn’t do well, gold will also do fine … but a lot of other things could collapse.”
Though he won’t disclose how much physical gold he owns, Mr. Kaplan, who is 47 years old, controls up to 30% of the shares in some so-called junior miners. Together, his holdings amount to a nearly $2 billion bet on gold, more than the Brazilian central bank’s bullion is currently worth.
Mr. Kaplan oversees an empire devoted largely to gold.
Many fund managers and high-rollers have allocated small percentages of their portfolios to gold as a hedge against inflation. But Mr. Kaplan is the bull of bullion. He has gone further than perhaps any other major investor, betting the majority of his wealth on gold and other precious metals. And it reflects his deeply held conviction that global economic instability could bring rising demand for gold.
Through his firm, Tigris Financial Group, and affiliates, Mr. Kaplan has loaded up on bullion and bought up properties in 17 countries on five continents, where geologists are exploring for more. Tigris subsidiaries have taken stakes in mining companies, including tiny firms that have yet to produce an ounce.
“I’ve reached a point where I feel the only asset I have confidence in is gold,” Mr. Kaplan said in an interview at Tigris’s midtown Manhattan headquarters.
On Demand and Supply
Gold miners are struggling to make major discoveries and it takes years to bring new finds into production. If people want to stock up on gold in a hurry, it will be hard to ramp up production enough to satisfy them, Mr. Kaplan believes.
…..read it all HERE
Peter Grandich – The Gold Cartel and their perma bear buddies are once again up to their old tricks on the Comex.
Bill Murphy, Chris Powell, GATA and I have a message for them (youtube of Pat Benatar’s “Hit me with your Best Shot”)
On Major Moves, Peter Grandich has been very right and not only saved many investors fortunes, but expanded them dramatically. On November 3, 2007 at the MoneyTalks Survival Conference, Peter Grandich of the Grandich Letter warned that “an unprecedented economic tsunami will hit American beginning in 2008”. Peter advised publicly to short the US market two days from the top in October, 2007 and stayed short until the last week of October, 2008. He began to buy stocks in March 7th, 2009. He also bought oil and oil related investments near the lows after the dive from $147.
….go to visit Peter’s Website
To HERE Peter speak and others speak on Trading go HERE:

In October of 2007, Bob Hoye of Institutional Advisors was on Money Talks when he made it very clear, crystal clear to get out of the markets. He said a credit tsunami was about to absolutely overwhelm us.. Obviously a very, very valuable call. He also declared publicly to get back into the market at the end of the 1st quarter of ’09. That’s why I’m really pleased to get his perspective.
Michael Campbell: Bob, we just heard Bernanke give his semiannual update in the US. What do you think is happening out there?
Bob Hoye: A big financial mania is beyond the control of any government or any government agency. It’s a crowd phenomenon thing, and there is nothing he or they can do about it. The irony is that when the mania is on, you have the guys on the Policy side say, “Hey, this is all due to our brilliant, policy manipulations. We just know how to change interest rates, we can manage this boom and we’ll run it forever.”
Michael: Do you think that the government officials generally understand that they can’t do anything really?
Bob: No. When a boom is on they really, I’ve got this going way back to 1825, they really believe that it is due to their brilliant management and it will continue. Then it fails as the momentum of equities or real estate that’s being speculated in just stops going up. Thats when the power shifts from central banker whose new job is to keep the bubble going and get the accounts offside over to the margin clerk whose job is to get the accounts on side.
Michael: So the Government solution to the debt problem is to encourage people to take on more debt?
Bob: Well the first person in writing that proposed that idea of growing credit and the credit contraction would go away was a guy by the name of Edward Misledon in the crash of 1622. Every other generation seems to bring forward an intellectual who comes up with that brilliant idea. The problem is that the whole system in a speculative fury, takes on more debt than can be serviced in an ordinary economy. But the problem is, because of crushing equity and asset prices you get the drop in the economy and you just can’t service the debt. That’s the problem. When Amsterdam was the World’s leading financial capital they had a term for credit when it was available, they called it Easy Money. To this day the guys in Bond Trade still say it’s Easy Money.
Michael: How can policy makers influence consumer psychology?
Bob: They can’t. In the early 1930’s Banks stopped lending money to individuals and corporations because they were empty. Banks that did have some money bought treasury market. I believe that is going on now as well. Then the intellectuals get upset about hoarding of cash. In the 1930’ retail stores even had anti-hoarding stickers in the window. The behavior of policy makers through every bubble has been the same. At the top say it’s managed. Good policy. In the crash they turn around and look for scapegoats to lay the blame on. Then you go to a period of regulation increase in order to close the barn door after the horse is gone. And then the next flight comes in, one you have a great financial bubble turn into a great depression.
Business contraction starts virtually with the bear market. So the top of the stock market was in late October 2007, then the NBE came along and said that the Recession started a month later. Now as you and I know through our experience in the market, you have a stock market high and then later on, a year later you have the high for the economy. That is usual. The only time you get the failure of the business cycle with the stock market is at the end of the bubble. So where I sit on this one is that when the panic down ended in March a year ago, the rebound would have a rebound in Business activity. Then when eventually the stock market peaked in April 2010, the stock market would go down and it would re-take the economy with it. May 2010 started the resumption of bad economic news and last week’s Housing number was a disaster. So this is working that you have a rebound in the stock market, you get a rebound in business activity. Then both fail at the same time. In my mind we are in a severe post bubble contraction and it will go on for some time.
Michael: Are you on the deflation side too?
Bob: Yes, we should look at a boom as a credit expansion, a credit inflation. Then you, as the prices fall credit becomes unserviceable and then it contracts. It keeps contracting. So it’s a credit inflation followed by a credit deflation, prices go up, prices go down. And this is going to go on relentlessly. One of the blunders in current thinking on economics is that they look back, and this is ironical because Bernanke is one of the leading scholars on the post 1929 contraction, and they all conclude that the Fed was tight. It wasn’t. There was evidence in the newspapers that in the summer of ’29 when the Fed raised the cost of money to Wall Street at the same time they were easing money to Main Street. Then in the crash the head of the New York Fed, which was giant compared to all the other chapters, opened the discount window and bought bonds out of the market. Exceeded its lending authority by a factor of six times. In January, February of 1930 the fed in a bulletin said that they met the panic in the classic way by liberally discounting, which they did. Then you go to July 1932 which was the bottom of the market and Barrons’ had an editorial that said, ‘Every anti-deflationary measure taken by the Fed is not working.’ The problem was that the vortex of deflation kept sucking bond prices down.
Michael: How I should be approaching equity markets right now?
Bob: Well as I said there was a very good top for the US stock markets in April and May. Through the summer it’s just been a sort of a choppy market favoring slightly the down side but then we typically get a nice rally going into the turn from August to September and it’s happening. We had a good day Friday and this is likely to continue into next week but this is just the seasonal sort of little lift in the markets that will be followed by further decline.
You have the spreads for junk bonds out almost to as wide as they were in the June hit. The long end spreads have been widening since May and that’s a bad sign. The weakness in base metal prices is not good. In Money market maturities of less than one year maturity rates continue to decline and the Ted spread it continues to narrow. A lot of thinking people are packing money in at the short end. Its not because it is fed policy to have low interest rates, its that we’re in nervous times and careful money is parking in the most liquid item which is treasury bills in the US.
The other most liquid item of course is gold. There is a constant accumulation of Gold going on. Technically the nominal price of Gold, the real price as we calculate it relative to commodities is going up. This is a good thing for gold mining for improving profits margins but it’s a bad thing for the stock market. Another indicator we find reliable is the gold silver ratio. It has a tendency when it turns up to signal a wave of credit concerns. The gold silver ratio is now about 65, if it goes right through 68 we’ll say watch out, we’ve got a liquidity problem coming.
Michael: The spread between what the Greek government pays for 10 years money in Euros and what the German government pays is now 9%. Is that a look out?
Bob: It is indeed. I’m positive next week the bond market is going to be heading south. On the ten year note this week we got upside exhaustion readings, which means the best is in. The dynamics are there for an important top in bond prices and they are about to head down. Another sign that there is a problem.
Michael: If bond prices head down, will it not provide an opportunity to get higher yields?
Bob: Eventually yes, but the point is that the bond market in the last few months has been the only game in town and there’s been a lot of speculation. Still, there’s no shortage of supply of bonds from that crazy White house administration. I think this is the move where the bond vigilantes come in and say “No Mr. Treasury you’re not going to flog any more of these bonds to the market.” I’m looking for a real serious convulsion in the bond market.
Michael: The US Dollar?
Bob: All of this debt that was expanded during the bubble, let’s say the majority of it, is due payable into New York in US dollars so that represents a huge short position of US dollars. If we go back into history, the records shows after the financial mania blew out eventually the senior currency becomes chronically strong relative to most commodities and other currencies. It used to be Sterling it’s now US Dollars. It’s very simple, those who borrowed US Dollars because they thought US Dollars were going to go to zero now owe them due and payable due in New York. It’s a huge short position and the Dollar’s going to go up and up and up. It’s fascinating.
Michael: Bob, to summarize there is an opportunity to be short the Government bond market which has run to exhaustion. If your not inclined to short you’d be cautious, raise cash, and you don’t mind having your long term gold position. Have I missed anything?
Bob: One trade you can is the gold-Silver ratio. If it breaks through 68, it might run to 75. In the crash in ’08 it got out to 84. Also while you can sell some of your gold stocks, we’re always interested in the junior exploration stocks. You can’t move around too quickly so you can hedge yourself with the new junior-gold-stock ETF symbol GDSJ in the states. One of the other ways would be to most certainly sell your silver stocks and also play the short side on silver stocks. It will make you some money and protect your core positions and gold.
Michael: Great Bob, as usual a real pleasure to talk to you. I hope we can visit again in the very near future, I always find it fascinating.
Bob: Mike, I enjoyed it.
I’m seeing unusual strength in the gold market. Strength that has reversed the very short-term negative trends in gold to positive, and even given me a new cycle projection on my software.
In fact, I believe gold’s recent action is so significant, it’s bearing important messages about the future. I’ll get to those in a minute, and how you should prepare your finances. First, more on the recent action in gold …
Consider gold’s daily cycle chart. As you can see, the daily cycle projection for gold (red line) is now showing a few more days of sideways trading action … then the potential for a very slight dip in mid-September, but then a powerful rally going into October 20.
How does one interpret this cycle chart for gold? What could be the underlying fundamentals emerging that are giving gold unusual late summer strength right now?

First, from a technical perspective, I believe the long-term bull market in gold is overpowering the short-term action, and instead of the usual weakness we should see in late summer, we are now seeing an early kick-off to the Autumn rally I spoke of in prior issues.
That’s not unusual when longer-term cycles are so powerfully bullish. They can often alter the shorter-term cycles, turning what should be a period of weakness, into unusual short-term strength.
Second, also from a technical point of view, gold has risen above important chart resistance at the $1,225 level, and it has consolidated that price support over the last several trading sessions. Put another way, the $1,225 level that was previously resistance, is now starting to act as support.
Third, from a fundamental point of view, we already know the demand/supply picture supports a long-term bull market in gold.
So, like the long-term cycles, the long-term fundamentals at this time seem to also be overpowering the short-term seasonal weakness we otherwise should be seeing now in the yellow metal.
Fourth, also from a fundamental point of view, I believe we need to interpret gold’s recent unusual strength as giving us a few important warning signs of what is to come. That’s often true of gold, as it, more than any market I know, has the uncanny ability to anticipate future developments in the economy and in the markets.
Here’s where I think it gets very interesting, and why we need to heed gold’s recent warnings. Right now, I believe gold’s recent strength could be foreshadowing the following …
A. That the Federal Reserve could very soon start printing money again. We already know the Fed is prepared to do this, from its last FOMC meeting, where they openly admitted the economy stinks and that the Fed stands ready to do whatever it deems necessary.
So perhaps Big Ben is going to start printing even sooner than most anticipate, given all the weakness we’ve seen in recent economic stats.
And contrary to what most analysts will tell you, the Fed is not out of bullets. The Fed can print up as much money as it wants, whenever it wants.
It can buy up more mortgages. It can buy up Treasury bonds, bills, notes and even corporate IOUs. It has far more power than anyone wants to believe.
That doesn’t make it right, nor does it guarantee any of these actions will fix the economy. You all know my view on the Fed’s actions: They’re largely designed to kick the can down the road … devalue the dollar … buy time … and eventually inflate away the economy’s problems by easing the burden of debts by raising overall price — and yes, asset — levels.
And as I’ve said many times before, it remains to be seen if it works.
But the fact of the matter is that gold’s recent action is likely warning you that the Fed is already getting ready to bring out some pretty big guns.
B. There could also be, right around the corner, another round of sovereign debt problems in Europe. That would not surprise me one bit. The sovereign European debt and euro currency crises are far from over; they could erupt again at any minute.
That may be another reason why we are seeing the U.S. Treasury bond markets showing recent death-defying strength, with yields plummeting to new lows, as investors begin to worry about Europe’s financial safety again.
Also coming into play …
C. China’s economy is far stronger than most expect. The media in the West, as I have pointed out in recent columns, is way too pessimistic on China’s economy, talking of a massive slow-down there, even an implosion.
Don’t buy into it. China’s economy, at worst, has already managed a soft-landing, so to speak. And given what I’m seeing here in Asia — growth throughout Asia is more likely to start accelerating again, exactly the opposite of what most in the West currently believe.
What’s more is that China is now actively liberalizing the gold market. The People’s Bank of China (PBOC), China’s central bank, recently announced that it would start encouraging private investment in gold — including developing new retail gold products for its citizens such as gold savings accounts and gold Exchange Traded Funds for domestic Chinese citizens.
This is a huge positive for the gold market, obviously, and China is likely to move very aggressively on this.
Also important: Beijing has recently started selling U.S. Treasury securities, and investing the proceeds in Japanese and South Korean government bonds.
This suggests China is moving out of the U.S. dollar. So in addition to selling U.S. Treasury notes and bonds and buying other Asian sovereign debt, it’s very likely that China is now actively building its gold reserves again.
Bottom line: Gold’s unusual short-term strength, which has turned the short-term cycles from negative to positive, is a very bullish sign for the gold market.
The strong Autumn rally in gold that I’ve been telling you about? It may already have started.
One final note before I give you my suggestions on how to position yourself. As I’ve been warning you, the broad market U.S. stock indices are starting to roll over to the downside. I still fully expect to see Dow 9,000 soon, and more likely, 8,700.
If the Dow closes below 8,745.90 on any trading day, there is even the potential for the Dow to fall as low 7,870.
So if you’re not already out of the stock markets, then now’s the time to get out. Do not delay.
Exceptions: Natural resource stocks, my core Asian positions, and especially my core gold positions and mining shares.
Examples: iShares FTSE/Xinhua China 25 Index (FXI) … SPDR Gold Trust (GLD) … U.S. Global Investors China Region Fund (USCOX) … Agnico-Eagle Mines (AEM) … and Goldcorp (GG). Those positions are showing gains of as much as 50.7% since first featured in this column. I suggest you consider holding or adding.
Best wishes, as always,
Larry
P.S. My August issue of Real Wealth Report is out! It’s a dynamite issue you should not miss. Click here now to become a member and to immediately download the issue.
This investment news is brought to you by Uncommon Wisdom. Uncommon Wisdom is a free daily investment newsletter from Weiss Research analysts offering the latest investing news and financial insights for the stock market, precious metals, natural resources, Asian and South American markets. From time to time, the authors of Uncommon Wisdom also cover other topics they feel can contribute to making you healthy, wealthy and wise. To view archives or subscribe, visit http://www.uncommonwisdomdaily.com.
A 4 chart sampling below and the Bottom Line taken from the comment plus 40 Charts Don Vialoux analyses in this great Monday comment. Read it all HERE
The S&P 500 Index fell 7.10 points (0.66%) last week. Intermediate trend remains down. Resistance is at 1,129.24. Support is at 1,010.91. Short term momentum indicators are oversold, but continue to trend lower.
The TSX Composite Index added 157.65 points (0.98%) last week. Intermediate trend remains down. Support is at 11,065.53. Resistance is at 12,077.01. The Index once again moved above its 50 and 200 day moving average. Short term momentum indicators recovered to a neutral level. Strength relative to the S&P 500 Index has turned positive.
The U.S. Dollar Index slipped 0.14 last week. It found resistance near its 50 day moving average. Support is at 80.08. Resistance exists in a band above 85.03. Short term momentum indicators are overbought, but have yet to show signs of peaking.
Gold added another $10.20 U.S. per ounce last week. Gold is testing its all time at $1,265.00. Short term momentum indicators are overbought, but have yet to show signs of peaking. A break above resistance implies technical upside to $1,384. ‘Tis the season for gold and gold equities to move higher!
Short term momentum indicators are oversold, but showed possibilities of a short term recovery on Friday. Their oversold level appears at a time in the month (last three days of the trading month and first two trading days of the next month) when equity markets usually move higher.
On the other hand, medium term technical indicators continue to trend lower and economic news (particularly in anticipation of the employment report on Friday) will show a continuing slow down in economic growth.
According to Thackray’s 2010 Investor’s Guide, the month of September is the weakest month of the year. U.S. equity markets historically have advanced until just after Labour Day followed by persistent declines. Additional comments and data on this phenomenon will appear in tomorrow’s Tech Talk.
U.S. equity markets have a consistent history during midterm election years of moving lower in the month of September.
The Bottom Line
A brief recovery by equity markets early this week from an oversold level would not be a surprise. However, the gains (if they occur) are not sustainable. Equity markets need a period of base building before they can launch a significant intermediate upside move. Please be patient. Meanwhile, hang on to seasonal trades in gold, agriculture and biotech.
Special Free Services available through www.equityclock.com for a limited time only
Equityclock.com is offering free access to a data base showing seasonal studies on individual stocks and sectors. The data base holds seasonality studies on over 1000 big and moderate cap securities and indices. Free services are available for this summer only. Enjoy while available!
To login, simply go to http://www.equityclock.com/charts/ and enter the
following details:
Username: equityclock.com
Password: equityclock.com
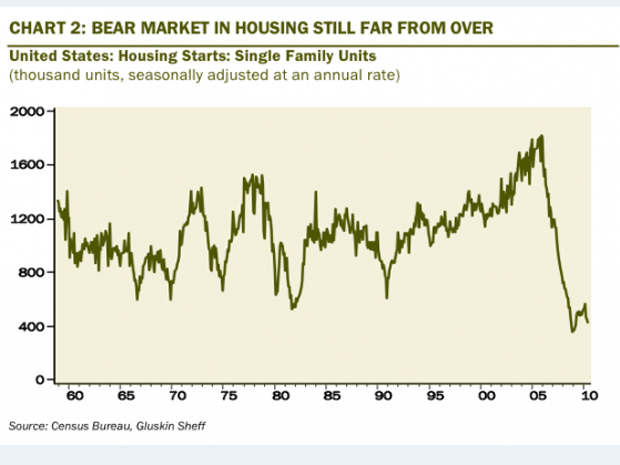
It would seem that with the new and existing home sales from earlier this week, the ranks of the housing bulls have been thinned quite aggressively.
But in case there are any more out there, David Rosenberg has a series of charts that reveal just how ugly the market remains.
He helpfully includes some lesser-spotlighted metrics, like foot traffic, buyer intent, and vacancies to give a fully-rounded picture of the market.
Go HERE to view 9 more Charts
David Rosenberg is the chief economist of Gluskin Sheff, an independent investment firm, since May 2009.
Rosenberg was the Chief Economist of Merril Lynch from 2002 to 2009. He served also as a Senior Economist at BMO Nesbitt Burns and Bank of Nova Scotia. Rosenberg has a Bachelor’s and a Master’s degree in economics from the University of Toronto.
-
I know Mike is a very solid investor and respect his opinions very much. So if he says pay attention to this or that - I will.
~ Dale G.
-
I've started managing my own investments so view Michael's site as a one-stop shop from which to get information and perspectives.
~ Dave E.
-
Michael offers easy reading, honest, common sense information that anyone can use in a practical manner.
~ der_al.
-
A sane voice in a scrambled investment world.
~ Ed R.
Inside Edge Pro Contributors

Greg Weldon

Josef Schachter

Tyler Bollhorn

Ryan Irvine

Paul Beattie

Martin Straith

Patrick Ceresna

Mark Leibovit

James Thorne

Victor Adair