
Daily Updates
Some of the work Mark Hulbert does is nothing more than telling us what the gurus in the universe he follows are thinking individually and, more frequently, in the aggregate. But of late, he also has been doing some far more interesting analysis in the “Yale Hirsch” mode – and the results are not satisfying if you are a bull.
The bullish case seems to rest on two platforms: (1) August was really bad therefore September should be good in reaction to that, and (2) “Everyone” now expects the current crop of politicos to suffer major setbacks in November and, since the market is a predictive mechanism, investors are positioning themselves today for what they believe will be wonderful news post-November (like an extension of the current tax rates and a reduction in pork-barrel spending by irresponsible pols.)
The Dow rallied more than 300 points the first two days of September so, making the usual straight-line assumption, bulls believe that today is the day to get invested, Hmmm. Let’s examine each of the above platforms in turn.
SEPTEMBER T‐NOTE FUTURES ON THE CBOT: The trend is still rather clearly
“from the lower left to the upper right” on this chart, isn’t it? And yet everyone everywhere keeps trying to find the top. Until this trend line is broken the top is not it… Repeat, it is NOT in. – Dennis Gartman For a Trial Subscription go to The Gartman Letter)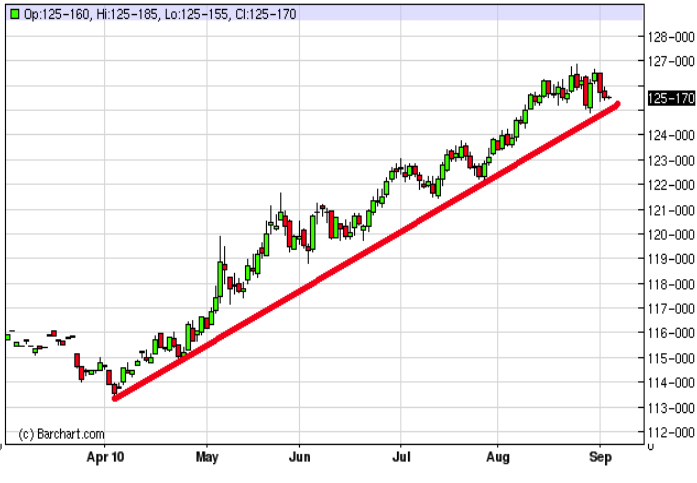
How to Profit From the “Widow-Maker” Trade – Shorting U.S. Treasury Bonds
By Keith Fitz-Gerald, Chief Investment Strategist, Money Morning
Although we’re in the midst of a U.S. Treasury bond bubble so big that pundits are calling for investors to short the government paper, resist the urge to jump in with both feet.
Doing so right now is nothing more than a “widow-maker” trade that will test both your patience and your pocket book. And yet, “shorting” the U.S. Treasury bond market is an opportunity you can’t afford to pass up – so long as you execute the trade correctly.
A T-Bond Backgrounder
U.S. Treasuries have risen an average of 2.9% this year while the Dow Jones Industrial Average has dropped 2% and the Standard & Poor’s 500 Index has declined 3% – and that’s after the best two-day run for stocks since July.
In case you’re not familiar with how yields and Treasuries work, here’s the 10-second version…..
…..read more HERE
Quotable
“Jobs are like a light switch for the market. Upside surprise — all is bright and risk is on. Bad numbers — risk is off and we’re back in the dark.” – Dealer at an Australian Bank
….read more Read MoreHERE
Thursday Sept 2nd, 2010
Wednesday was a big session with better than expected manufacturing surging the market 3%. In this article I will do a quick technical take on the current situation for the SP500 and gold as they are both trading at a key resistance level. also its important to know what type of price action we will get in the next 1-2 days so you can have your profit targets or protective stops in place depending on which side of the market you are currently playing.
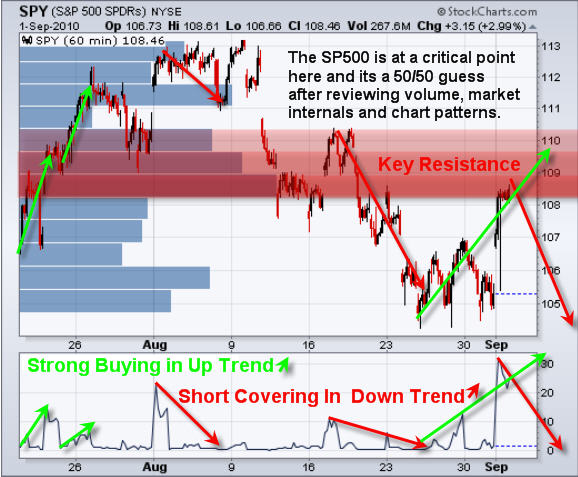
SPY – SP500 Exchange Traded Fund – 60 Minute Chart
The market is currently in a down trend which means bounces get sold. But if you take a look at the buying volume ratio at the bottom of the chart you will notice that in an uptrend buying surges are the beginning of a rally, and during a downtrend buying surges are the end of a rally. I also want to mention that a lot of volume traded at this current level which you can see on the volume by price bars on the chart. This means there will be a lot of sellers to overcome before breaking to the upside.
The situation the market is at now makes things difficult to tell if this bounce will get sold, or if its just the starting of a rally. There are several arguments for each side but the one which I think has the most influence is the buying volume. It was very strong on this current bounce. It feels more like a rally but we will not know for sure for a couple days…
That being said, if the SP500 moves up Thursday then I would consider the market to be in an uptrend and exiting any short positions is a smart play. But if this bounce is sold and the market drops, then the 3% rally on Wednesday could all be given back and then some.
GLD Gold Exchange Traded Fund – 60 Minute Chart

Gold has continued to grind its way up to the previous top. Problem is the volume has been very light and that tells me there is not much demand for gold at these elevated prices. While we are still long gold it is crucial to have your protective stop in place so we lock in as much profit as possible for when the sharp selling spike happens.
Mid-Week Technical Take:
In short, the market feels like its trying to reverse back up but at this time its still in a down trend and trading under a key resistance level. This means trading with the trend and selling the bounces is still the play. That being said today’s strong volume makes this bounce suspect. Keeping positions small and setting a protective stop should be done as a safety precaution. The next couple days will shed some light for sure…
As for gold, I am still bullish but expecting our protective stops to be triggered any day now, which means we get paid and can mark another successful trade down on the scoreboard.
If you would like to receive my ETF and Futures Trading Alerts visit my website at: www.TheGoldAndOilGuy.com
Chris Vermeulen
Analysis from one Wall Street strategist shows that the pace of money flowing into bonds is faster at this stage than the infamous dotcom bubble of the late 1990s. And that’s not necessarily bad news for those Treasury investors.
Almost two years into the bond flight, about $550 billion has poured into U.S. bond mutual funds and exchange-traded funds, according to BNYConvergEx Group Chief Market Strategist Nicholas Colas. Using inflation-adjusted figures, investors had put $499 billion at this same stage of the Internet bubble. Colas selected December 1996, the month of Alan Greenspan’s “irrational exuberance” speech, as the estimated start of the bubble in equities. For bonds, he uses the collapse of Bear Stearns in March 2008.
“We all know bubbles can last longer than anyone thinks possible, and the money flows give us a sense just how much more cash may be waiting in the wings,” said Colas, in a note to clients today. “In total, U.S. equity stock funds logged some $840 billion in new capital from Greenie’s warning to the peak of the NASDAQ, and over $1 trillion before money actually stopped flowing into stocks. So that $550 billion in new bond fund money may have some more company soon, if the 1990s period is any guide.”
Government bonds will have their best month in three years this August as prices surged and yields fell. The 2-year Treasury yield hit a record low this month of below a half percent and the 10-year yield touched a 19-month low, illustrating just how much aversion to riskier asset classes there is right now.
“Out of everything that could be a bubble, bonds could be the one that lasts the longest,” said Guy Adami, managing director for Drakon Capital and a ‘Fast Money’ trader. “Japan had a bond bubble for 20 years.”
Treasurys got a boost this month after the Federal Reserve began using money from its maturing mortgage portfolio to purchase Treasuries, a move which further spooked the equity markets about just how bad the economy must be. The central bank has not restarted a formal second quantitative easing program of Treasury purchases using new money, however.
The rate strategy team from RBS called for a correction in the bond bull market yesterday, citing how overcrowded the trade has become and Fed Chief Bernanke’s failure on Friday to explicitly say from his Jackson Hole, Wyoming retreat that round two of quantitative easing is definitely in the cards.
Treasurys have been “overbought for weeks and in dire need of a ‘long squeeze’,” said Bill O’Donnell in a note to RBS clients.
Corrections are indeed a hallmark of any bull or bubble. The bigger question is, will investors see the same magnitude of wealth destroyed as they did from buying and holding tech stocks into 2000?
Not if they hold these bonds to maturity and the U.S. can still pay its bills they won’t. “Bond investors in the current environment can at least retort that they will, eventually, get all their money back,” said BNY’s Colas.
Article via oyetimes.com
-
I know Mike is a very solid investor and respect his opinions very much. So if he says pay attention to this or that - I will.
~ Dale G.
-
I've started managing my own investments so view Michael's site as a one-stop shop from which to get information and perspectives.
~ Dave E.
-
Michael offers easy reading, honest, common sense information that anyone can use in a practical manner.
~ der_al.
-
A sane voice in a scrambled investment world.
~ Ed R.
Inside Edge Pro Contributors

Greg Weldon

Josef Schachter

Tyler Bollhorn

Ryan Irvine

Paul Beattie

Martin Straith

Patrick Ceresna

Mark Leibovit

James Thorne

Victor Adair