
Daily Updates
NBER Likely to say “Recession Ended” July 2009; Assessing the Real Time Probability US Back in Recession
One problem with the NBER recession dating analysis is that it is months and sometimes years late in making its assessments.
Marcelle Chauvet, professor of economics at the University of California addresses those shortfalls in an interesting article called Real Time Analysis of the U.S. Business Cycle
Although careful deliberations are applied to determine turning points, the NBER procedure cannot be used to monitor business cycles on a current basis. Generally, the committee meets months after a turning point (that is, the beginning or end of an economic recession) has occurred and releases a decision only when there is no doubt regarding the dating. This certainty can be achieved only by examining a substantial amount of ex post revised data. Thus, the NBER dating procedure cannot be used in real time. For example, the NBER announced only in July 2003, twenty months after the fact, that the 2001 recession had ended in November 2001.
Some models, however, can gauge how weak or strong the economy is and date business cycles in real time. In particular, the dynamic factor Markov switching model (DFMS) in Chauvet (1998) has been very successful in dating business cycles in real time and in closely reproducing the NBER dating.
The model yields a monthly indicator of the U.S. business cycles and probabilities of recessions and expansions when applied to the same series used by the NBER: nonagricultural employment, real personal income, real manufacturing and trade sales, and industrial production.
What does the DFMS nonlinear probability model tell us about U.S. recessions?
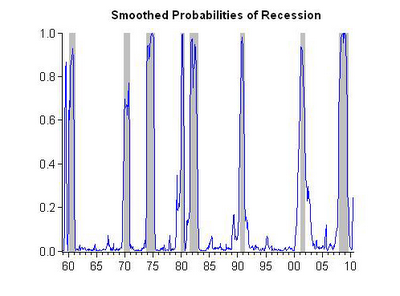
Since 1959 the U.S. economy has experienced eight recessions. Figure 1 shows the business cycle indicator, and Figure 2 shows the smoothed probabilities of recessions obtained from the DFMS model and the NBER recession dating. The probabilities are obtained using full sample information (that is, all information available from 1959 up to now).
As Figure 2 illustrates, the probabilities increase substantially at the beginning of recessions (peaks) and decrease around the end of the recessions (troughs). Recessions are generally short, lasting on average a year, whereas expansions are much longer, averaging about five years. The 1990s experienced the longest U.S. expansion (ten years) in the past 150 years, while the 2007–09 recession was the longest in the past 50 years.
…..read Mish’s analysis HERE
You just can’t keep a good economy down. At least, that’s what you think upon reading the headlines this weekend.
“Fears of double-dip recession recede,” was the headline in The Financial Times.
Why the receding fear?
The private sector created 235,000 new jobs in the past three months, the paper explained.
And here’s the “good news” report from Bloomberg:
Companies in the US added more jobs than forecast in August, easing concern the world’s largest economy is sliding back into a recession.
As private payrolls that exclude government agencies climbed 67,000, after a revised 107,000 increase in July that was more than initially estimated, Labor Department figures showed today. Overall employment fell 54,000 for a second month and the unemployment rate rose to 9.6 percent as more people entered the labor force. The median estimate of economists surveyed by Bloomberg News called for a gain of 40,000.
Wait a minute. The economy needs 120,000 jobs per month just to keep up with population growth.
Okay…okay… Let’s not quibble about that. The census workers got dumped back onto the unemployment rolls, “causing overall payrolls to fall by 54,000” and the unemployment rate to jump from 9.5% to 9.6%.
Hmmm… Let’s get this straight. Unemployment went up, right? Right.
There are fewer people working now than there were three months ago, right? Right.
And the number of jobless people is still growing too, right? Right.
All of which prompted Mr. Obama, in a moment of candor, to admit that “there’s no quick fix…”
He should have said there’s no fix at all coming from the feds. The economy has to fix itself. But nobody seems ready for that level of candor. Transparency, yes. But still, draw the curtain behind the actors… Let voters see the farce…not the dirty dealings and incompetence backstage.
The level of thinking about what caused the crisis and how to respond to it is pathetic and absurd. Even the deepest thinkers on the subject seem unable or unwilling to consider the matter in any but the most superficial terms. Has the unemployment rate gone up? Has GDP gone up? Never mind about what goes on underneath these numbers…about what they really mean…or about how an economy really works.
Technicians need measures and gauges they can work with. Nobody seems to mind that they don’t really make much sense.
But news from the unemployment front – following a couple of days of rising stock prices – was all it took to allow investors to put aside their worries about a “double dip” recession for the Labor Day weekend.
On the last day of trading they bid up the Dow by 127 points and took a couple of points off bonds and gold. Gold settled at $1251 – just $11 short of its all-time high. Which set us to wondering about the metal. It seems to be in an extraordinary bull market. When stock prices were going down a week ago – gold was going up too. This past week, stocks were going up. Still gold went up too.
Risk off…risk on… Gold doesn’t seem to care. An amazing analysis in The Financial Times told us that investors are now buying gold when they think the risks of DEFLATION are increasing. Doesn’t make much sense…deflation should increase the purchasing power of dollars. No need for gold.
Don’t bother to write and tell us how well gold performed during the Great Recession. Gold was officially money back then. The US government increased the value of gold – by pronunciamiento – in order to reduce the value of the paper currency.
Our guess is that gold goes up when deflation threatens because people expect the Fed to do something rash and stupid – a familiar subject here at The Daily Reckoning.
All of which seems to make gold a “can’t lose” bet. If inflation picks up, gold is, well, golden. If deflation gets a grip, on the other hand, gold goes up too.
But what if nothing happens? What if this Japan-style slump continues? What if the Fed doesn’t do something rash and foolish?
Bill Bonner
for The Daily Reckoning
It’s hard to believe that more than ten years have gone by since we began writing The Daily Reckoning out of a Paris office back in July of 1999…
Since then, a lot has changed. We have seen the dot com boom and bust…a massive expansion of credit…real estate mania and meltdown…and epic highs and lows in the markets.
Nothing about the past ten years has been boring. And we have been there throughout, trying to help readers make some sense out of our global economy. And hopefully providing a few laughs along the way.
In short, we pen The Daily Reckoning each day – for free — to show you how to live well in uncertain times. We aim to make each article the most entertaining 15-minute read of your day.
If you haven’t signed up yet, I urge you to do so right here. And don’t worry. It’s 100% free – no credit card is required.
An awful August, but it was great for Howard Ruff. And he expects to continue that way.
Over the year to date through August, Ruff’s Ruff Times is now up 8.8% by Hulbert Financial Digest count, as compared to negative 3.9% for the dividend-reinvested Wilshire 5000 Total Stock Market Index. Over the past 12 months, the letter is up 44.1%, against just 5.1% for the total return Wilshire 5000.
Ruff is a veteran of the 1970s gold wars, and in essence he argues that era’s stagflation (or worse) is returning.
His record is long and checkered. His relentless self-promotion tends to irritate financial journalists, who are sensitive souls, but he did make perhaps the handsomest recantation I’ve ever seen, when Mark Hulbert and I found he had exaggerated his gold record — which was actually quite impressive enough. ( See Oct. 30, 2006, column.)
In recent years, Ruff has done particularly well. He was one of 2009’s top 10 performers by Hulbert Financial Digest count, despite being skeptical of the overall stock market all year. ( See Dec. 28, 2009, column.)
Ruff only publishes once a month, and much of his letter is musings on current affairs and extracts from services he respects. Thus, his most recent issue includes a summary of Shadowstats.com’s John William’s blood-curdling prediction of an imminent hyperinflationary depression. It also contains Ruff’s reflections on the Constitution, the need to defend Arizona in its struggle with the Obama administration over its anti-illegal immigration legislation (“we have to stand up for the states”), and a joke about a husband and wife stopped by a traffic cop.
At times, Ruff has seemed almost bored by the stock market. His attitude seems to be that he’s identified the major trend and provided what he calls his “shopping list of recommended investments” (which the HFD — as always, when no allocation advice is provided — treats as a fully invested model portfolio). And that should be enough, damnit.
Ruff’s latest issue does contain this unelaborated summary of what he calls his “forecasts”:
- Socialism marches on as the Obama Administration unfolds.
- In 2010, the Republicans take back the House and the Senate, as taxpayers revolt. But a new president is elected in 2012. [This is a change. Ruff used to say that, after losing Congress, Obama would be re-elected.]
- Gold and silver gradually rise to new highs; gold over $2,300 and silver over $100.
- The following industry groups do well: a) gold mining; b) silver mining; c) uranium mining.
- Taxes rise sharply.
- Interest rates rise as bond markets sag.
The latest Ruff Times has, what seems to me, an unusual emphasis on silver, pointing out in two places that “history has no example of the government seizing silver.”
Among stocks that Ruff recommends as “pure silver plays”:
Hecla Mining Co. (HL 5.94, +0.09, +1.54%)
Pan American Silver Corp. (PAAS 26.38, +0.45, +1.74%)
Silver Wheaton Corp. (SLW 24.16, +0.27, +1.13%)
Silver Standard Resources Inc. (SSRI 18.54, +0.14, +0.76%)
Coeur d’Alene Mines Corp. (CDE 17.91, +0.23, +1.30%)
Silvercorp Metals Inc. (CA:SVM 7.97, 0.00, 0.00%)
Endeavour Silver Corp. (EXK 3.98, +0.09, +2.31%)The latest Ruff Times has, what seems to me, an unusual emphasis on silver, pointing out in two places that “history has no example of the government seizing silver.”
Among stocks that Ruff recommends as “pure silver plays”:
Hecla Mining Co. (HL 5.94, +0.09, +1.54%)
Pan American Silver Corp. (PAAS 26.38, +0.45, +1.74%)
Silver Wheaton Corp. (SLW 24.16, +0.27, +1.13%)
Silver Standard Resources Inc. (SSRI 18.54, +0.14, +0.76%)
Coeur d’Alene Mines Corp. (CDE 17.91, +0.23, +1.30%)
Silvercorp Metals Inc. (CA:SVM 7.97, 0.00, 0.00%)
Endeavour Silver Corp. (EXK 3.98, +0.09, +2.31%)
http://www.mint.com/blog/finance-core/a-visual-guide-to-deflation/
A 5 chart sampling and the Bottom Line taken from the comment plus 45 Charts Don Vialoux analyses in this great Monday comment HERE
The Bottom Line
Preferred strategy for equity investors is to be patient. Most equity markets appear to be forming a base pattern for an important intermediate upside move starting in the fourth quarter. Based on current technical data, chances are high that bottom of the four year cycle occurred this year on July 1st. Chances also are high that one more downside move in equity markets is likely before the next important intermediate upside move is in place. Stick with current favourable seasonal patterns (e.g. gold, agriculture, natural gas) and “sit in the weeds” with cash positions until the next important intermediate low is identified.
Sectors that are top candidates for purchase after the next intermediate bottom is identified are economically sensitive sectors including materials, consumer discretionary, industrials and technology.
U.S. equity index futures are lower this morning. S&P 500 futures are down 7 points in pre-opening trade. Traders are responding to a Wall Street Journal article suggesting that recent stress tests of European banks were not a rigorous as previously announced. Many of the banks’ reserves are based on sovereign debt in countries such as Greece where valuations are somewhat suspect.
The S&P 500 Index gained 39.92 points (3.75%) last week. Intermediate trend remains down. Support remains at 1,010.91. Resistance remains at 1,129.24. The Index moved back above its 50 day moving average and recovered to just below its 200 day moving average. Its 200 day moving average has proven to be a reliable intermediate resistance level during the past four months. MACD and Stochastics have recovered to a neutral level. Stochastics have recovered to an overbought level, but have yet to show signs of peaking.
Gold also responded to the Wall Street Journal article. It gained $10 in pre-opening trade and is testing its all time high at $1,265.00 U.S.
Both the Philadelphia Gold and Silver Index and the AMEX Gold Bug Index are poised to break above six month highs. ‘Tis the season for gold and gold stocks to move higher!
The TSX Composite Index added 265.20 points (2.23%) last week. Intermediate trend changed from down to neutral after the Index moved above resistance at 12,077.01 on Friday. Support is at 11,065.53. Resistance is at 12,321.76. Short term momentum indicators are overbought, but have yet to show signs of peaking. Strength relative to the S&P 500 Index remains positive.
The U.S. Dollar Index fell 0.88 last week. Support is at 80.08. Resistance is at 88.71, but could be forming at 83.56. Resistance also was found recently near its 50 day moving average. .Short term momentum indictors have rolled over and are trending down. A break below support would be a major event because it implies completion of a head and shoulders pattern.
Crude Oil slipped $0.31 per barrel last week. Short term momentum indicators are recovering from oversold levels.
…..view the entire 50 Charts analysed and Don’s comments HERE
Don Vialoux has 37 years of experience in the Investment Industry. He is a past president of the Canadian Society of Technical Analysts (www.csta.org) and a former technical analyst at RBC Investments. Don earned his Chartered Market Technician (CMT) designation from the Market Technician Association in 1995. His CMT paper entitled “Seasonality in Canadian Equity Markets” was published in the Spring-Summer 1996 edition of the MTA Journal. Don also has extensive experience with Exchange Traded Funds (also know as Index Participation Units) as well as conservative option strategies. In 1990 he wrote a report that was released in the International Federation of Technical Analyst Journal entitled “Profiting from a Combination of Technical and Fundamental Analysis”. The report introduced ” The Eight Phases of the Stock Market Cycle”, an investment concept that continues to identify profitable entry and exit points for North American equity markets. He is currently a member of the Toronto Society of Fundamental Analyst’s Derivatives Committee. Now he is the author of a daily letter on equity markets available free on the internet. The reports can be accessed daily right here at www.dvtechtalk.com.
-
I know Mike is a very solid investor and respect his opinions very much. So if he says pay attention to this or that - I will.
~ Dale G.
-
I've started managing my own investments so view Michael's site as a one-stop shop from which to get information and perspectives.
~ Dave E.
-
Michael offers easy reading, honest, common sense information that anyone can use in a practical manner.
~ der_al.
-
A sane voice in a scrambled investment world.
~ Ed R.
Inside Edge Pro Contributors

Greg Weldon

Josef Schachter

Tyler Bollhorn

Ryan Irvine

Paul Beattie

Martin Straith

Patrick Ceresna

Mark Leibovit

James Thorne

Victor Adair