
Daily Updates
US large-cap stocks are bargains of a lifetime
By Bill Miller Chief investment officer at Legg Mason Capital Management
The common view seems to be that the weak stock market reflects a weakening economy.
But we think the converse is more likely: the weak stock market is causing the economy to weaken. It is not a surprise that the recent US consumer confidence numbers were so poor; with the stock market having fallen so sharply since late April, they could hardly be otherwise.
…..read the original article HERE
….read the analysis HERE
No defence left against double-dip recession, says Nouriel Roubini
“The US has run out of bullets,” said Nouriel Roubini, professor at New York University, and one of a caste of luminaries with grim forecasts at the annual Ambrosetti conference on Lake Como.
“More quantitative easing (bond purchases) by the Federal Reserve is not going to make any difference. Treasury yields are already down to 2.5pc yet credit spreads are widening again. Monetary policy can boost liquidity but it can’t deal with solvency problems,” he told Europe’s policy elite.
Dr Roubini said the US growth rate was likely to fall below 1pc in the second half of the year, despite the biggest stimulus in history: a cut in interest rates from 5pc to zero, a budget deficit of 10pc of GDP, and $3 trillion to shore up the financial system.
The anaemic pace compares with rates of 4pc-6pc at this stage of recovery in normal post-war recoveries.
“We have reached stall speed. Any shock at this point can tip you back into recession. With interbank spreads rising, you can get a vicious circle like 2008-2009,” he said, describing a self-feeding process as the real economy and the credit system hurt each other.
“There is a 40pc chance of double-dip recession in the US, and worse in Japan. Even if it is not technically a recession it will feel like it,” he added.
Hans-Werner Sinn, head of Germany’s IFO Institute, said the US would have to purge its debt excesses the hard way.
…..read more Nouriel Roubini HERE
It’s Not Time to Abandon Stocks
(ed Note: Late addition via Barron’s)
IT’S BEEN A LOST DECADE FOR STOCKS; as of late last week, the S&P 500 had a 10-year annual loss of 1.29%. That’s led investors to head for the exits–to bond funds, in particular. But are they following a wise course?
For a discussion about equities, their future and related issues, including the impending expiration of the dividend tax cut that was enacted in 2003, we turned to Duncan Richardson, executive vice president and chief equity investment officer at Eaton Vance.
A graduate of the U.S. Naval Academy who spent time as an officer aboard a nuclear submarine, Richardson, 52, later earned an MBA at Harvard. In 1987, he joined Eaton Vance, a Boston money manager that now oversees $173 billion in assets. Richardson, who has been an equity analyst, fund manager and chief investment officer, spoke with Barron’s by phone last week from his Beantown office.
…..read more HERE
Is gold set for yet another rally in September? Over the past few years gold has always had a spectacular end of year upward rally, always starting around September.
In September of 2003, gold prices went from around $350 to approximately $425. A $75 move, a 20% move. In 2004 gold prices moved from $400 to $450 at the end of September. A $50 move representing a 12.5% increase in gold prices. Last years action will be explained in detail further on in this article. The graph below shows the September rallies of recent years.
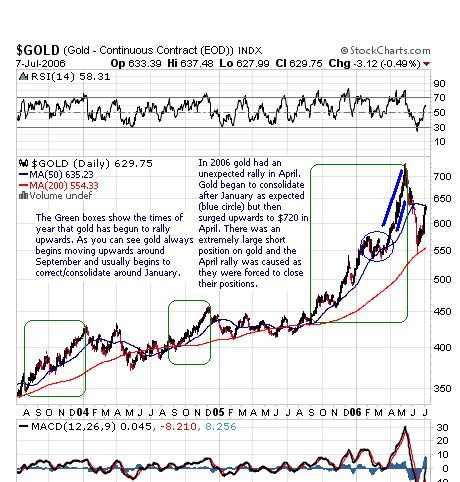
Investors getting into position, anticipating a September rally, may cause a small upturn in gold and gold stocks before we enter September. So buy your gold or gold mining stocks before we enter that period.
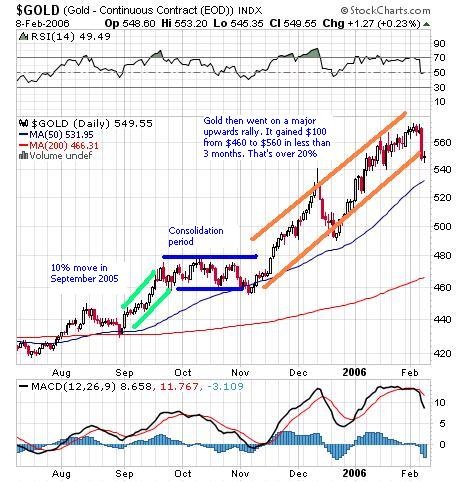
However, last year gold began its move upwards literally as soon as we entered September and it continued to rise throughout the month. By the end of September gold prices had climbed nearly $40, from about $435 to a high of over $470. A $40 dollar move in a month doesn’t seem that dramatic now, when we have seen gold prices move $10, $20, and $30 even $40 in one day!
However one must bear in mind the gold price of a year ago. Gold was about $450 and so a $40 move is close to a 10% move. A 10% move on today’s prices would be a rise of $64 in a month. $64 in one month is about $16 a week or just over $3 a day. After September we could see gold at over $700. ($640+10%=$704)
September only signifies the beginning. After the September rally there should be a consolidation for about a month. Then gold will probably rise about 20% from the end of November until the end of January. Providing that gold prices stay above $700, a 20% move would force gold to test its all time high of $850 by the end of January.
So now that we have established where gold prices are going, the next point is how to take advantage of them. Of course the most obvious option is to buy gold bullion. By purchasing bullion or a gold ETF you will track gold price exactly as you shall do as well as the gold price. This is the safest way to trade gold. However to maximise the benefit and increase you leverage on the gold price, you would be better off buying gold mining stocks in the HUI.
The HUI tends to outperform gold as is shown in the chart below.
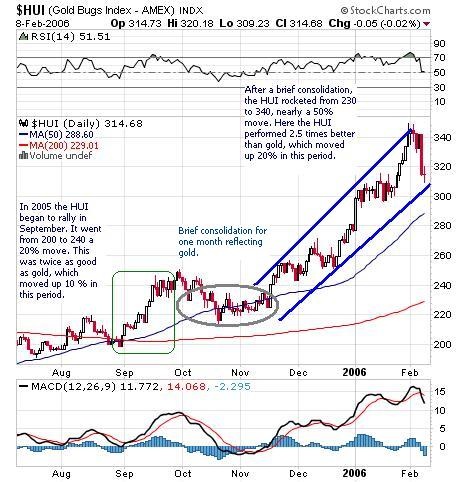
I think that buying gold mining stocks is the best option. You may want to buy a mix of stocks and physical gold for added security though. Try to buy mid sized gold producing companies, as large companies like Barrick and Newmont are usually slow to follow gold. Bema Gold, Agnico-Eagle and Kinross are good stocks to be buying as well as others. Other gold stocks are mentioned in our gold mining category.
If anyone has any other suggestions of gold stocks, or comments on this article, please leave them below.
Subscribe to the Free Gold -Prices.biz newletter HERE (enter your email on the right hand side)
Market Buzz – Summer Rally Heats Up, MOSAID Beats Street
While Toronto’s main index ended the session off its highs for the day, Friday’s session still found itself in positive territory at the close. Friday’s session marked an impressive week which saw S&P/TSX Composite Index close up 2.23% to 12,144.92. In fact, the recent leg of the current market up-tick which begun late in August continued to accelerated this past week.
We can trace the current upswing back to the July 5th year lows when the TSX dipped to the 11,092 level. From here we have witnessed the index gain over 8% in just under 2 months, a very impressive run – albeit on seasonally lower volumes.
Early in Friday’s session the TSX had been up almost 100 points but gains were trimmed in the wake of a report from the U.S. Institute for Supply Management that its service sector index for August came in at 51.5, down from 54.3 July and lower than the 53.2 reading economists had expected. While we are still seeing an expansion, it is at the slowest pace since October. Of note, the employment component (of the index) fell below 50 again, which signals contraction and is concerning.
The data took some of the luster off of the U.S. Labour Department report that the U.S. private sector created 67,000 jobs last month, much higher than the 40,000 or so that analysts expected. Having said this, we believe in the mid-term, the U.S. jobs market remains challenging.
The U.S. jobless rate edged up 0.1 of a percentage point to 9.6%. The Canadian jobs report for August comes out next Friday.
From our Canadian Small-Cap Universe (www.keystocks.com), we are happy to report that MOSAID Technologies Incorporated (MSD:TSX), Canada’s leading IP company, reported better-than-expected Q1 fiscal 2011 earnings.
The Ottawa, Ontario-based company posted Q1 fiscal 2011 revenues of $18.5 million, up 14% from $16.2 million in Q1 fiscal 2010. Q1 fiscal 2011 pro forma net income rose 29% 5o $8.6 million from $6.6 million in Q1 fiscal 2010. Pro forma diluted EPS were $0.73, based on 11.84 million diluted shares, compared to $0.65 per diluted share in Q1 fiscal 2010, based on 10.25 million diluted shares.
Looniversity – The Short Squeeze
Ah, the “short squeeze” – while the term may conger up images of your bearish broker’s vertically challenged girlfriend, in the financial world, the term has quite a different meaning. All financial humour aside (thankfully), this week we take a look at the phenomenon known as the short squeeze.
Short Sale
An investor who sells stock short borrows shares from a brokerage house and sells them to another buyer. Proceeds from the sale go into the shorter’s account. He must buy those shares back (cover) at some point in time and return them to the lender.
Short Squeeze
While shorters sell short a stock on the hope that its price will plunge, there is always a chance that its price may begin to rise. If it does so, more and more of these “shorters” will “cover” their investments. That is, they’ll buy back the shares that they had shorted, and take a loss, since they’re now having to buy the shares at a higher price. As more and more shorters do this, the price rises (since more people are buying than selling). In investment parlance, this is a short squeeze.
Put it to Us?
Q. What are the major influences on interest rates in Canada?
– Walter Williams, Vancouver, BC
A. While there are a multitude of influences on interest rates in general, we will narrow the major influences down to a party of three.
Supply and Demand: Interest rate levels are a factor of the supply and demand of credit: an increase in the demand for credit will raise interest rates, while a decrease in the demand for credit will decrease them. Conversely, an increase in the supply of credit will reduce interest rates while a decrease in the supply of credit will increase them.
Inflation: Inflation will also affect interest rate levels. The higher the rate of inflation, the more interest rates are likely to rise. This occurs because lenders will demand higher interest rates as compensation for the decrease in the purchasing power of the money they will be repaid in the future.
Bank of Canada: The major method for influencing interest rates is the Bank’s management of cash deposits in the banking system. Every day, the banks try to balance all cash flowing in or out of their accounts as closely as possible to avoid a positive balance in their clearing account at the Bank of Canada that earns no interest or a negative balance that incurs interest charges. The Bank of Canada can affect these balances by moving cash between federal government accounts at the Bank and demand accounts at the commercial banks. An increased positive balance tends to lower interest rates while an increased negative balance tends to raise rates.
KeyStone’s Latest Reports Section
- IP Company’s Q1 2011 EPS Exceed Expectations, Solid Fundamentals, Strong Cash Position & Yields 4.6%, Near-Term Rating maintained – Buy (Flash Update)
- Healthcare/Hospitality Service Trust Posts Solid Q2 2010, Total Return 108%, Yield Remains Solid at 6.81%, Near-Term Organic Growth Challenging – Rating Maintained (Flash Update)
- Staple Consumer Service Company Posts Solid Q2 2010 Results, Significant Acquisition, Ups Distributions for 11th Consecutive Quarter, Yield 6.2% – Long-Term BUY (Flash Update)
- Oil & Gas Service Stock Returns to Growth & Profitability in Q2 & Post Positive Management Outlook for Balance of 2010 (Flash Update)
- Q2 2010 EPS & Revenues Surge for China-based Agricultural Manufacturer, Announced New Growth Initiative – Stock Added to Focus BUY List (Flash
This chart of 10yr Treasury yields since 1790 is from Doug Kass at Real Money.
Dougie notes “The only time that yields have consistently been below current levels was WWII — 1941-44 — and and immediately after, to 1951, when the U.S. enforced a ceiling on yields. Even during the 1930s when the great Depression contracted the economy 25%, deflation drove yields to 2.5-4.0%.”
The Baby Boom started in 1946, and continued through 1964. Boomers saw their first instance of a financial bubble in the 1970s when gold was finally released from its permanent fix to the dollar, and was allowed to float. It went from $42 to $900 in a decade, then collapsed throughout the 1980s.
After the gold bubble of the 1970s, Boomers and others swore they would never get caught up in another bubble in something as frivolous as gold. No, no, from now on they would only invest in things that actually had earnings, like technology stocks.
After the Internet bubble hit its peak in 2000, Boomers swore they would never invest in something ephemeral like Internet stocks. From now on, they would stick to something safe, something real, like real estate.
And now, after the 2007 peak of the real estate bubble led to a collapse of the stock market and a deep economic slowdown, Boomers are again making resolutions to never again get caught up in something so speculative. No, no, from now on, Boomers are deciding to stick to something safe, something like bonds. After all, people are supposed to invest more in bonds when they get older, aren’t they?
The problem is that the Baby Boomers are such a large group that whenever they all try to crowd into the same room, their combined weight is more than can be balanced by the rest of the investing public. So having Boomers all decide that bonds are the place to be creates some interesting disruptions in the financial markets.
And this new investing fashion that has Boomers piling into bonds arrives just as interest rates are nearing the bottom of the 60-year cycle in interest rates. One important point to remember is that bond yields move inversely compared to bond prices. So seeing bond yields fall like this is another way of saying that bond prices are rising.
This week’s chart looks at the history of high grade corporate bond yields, which date back as far as 1768 in the data set previously compiled by the Foundation for the Study of Cycles (FSC). Since 1919, Moody’s has been tracking the average yields on various categories of corporate bonds, so the older yield data has been stitched together with Moody’s more modern data. Going back to periods before 1919 is a bit more problematic, since the data are harder to access and since definitions of things like “stocks” and “bonds” were somewhat looser in the 1800s than what we think of today.
Courtesy of McClellan Financial Publications
via the Big Picture
The McClellan Market Report and its companion Daily Edition are produced by Sherman McClellan and Tom McClellan. Both are technical analysts and educators whose innovative insights have helped countless investors succeed.
The McClellans’ work has been repeatedly quoted in Barron’s, and their market timing signals have ranked them in the top ten timers for both intermediate and long term by Timer Digest.
Tom McClellan
Tom McClellan is the editor of both The McClellan Market Report and The Daily Edition. Tom is widely sought as a lecturer, and his market timing signals have helped him be repeatedly ranked high by Timer Digest. For the 10 year period through 2006 Timer Digest rated him No. 1 for Gold Timing and No. 4 for Stock Market Timing. He was also Bond Timer of The Year for 2005.
The falling ratio between broader Gold Mining stock prices and the juniors is bullish for gold itself…
The PAST FEW WEEKS have been bullish for gold, in its bullion form, and also as an embed in mining stock prices, writes Brad Zigler at Hard Assets Investor.
We’ve touched on the different volatility of bullion and mining stocks before here at HAI, previously comparing Gold Bullion (or rather, the SPDR Gold Trust proxy) with the Market Vector Gold Miners ETF (NYSE Arca: GDX).
There’s more than one way to obtain broad exposure to the gold mining sector, though. Since its November 2009 launch, the Market Vectors Junior Gold Miners ETF (NYSE Arca: GDXJ) has outperformed GDX by a 3.5-to-1 margin, albeit with a dollop of extra volatility. Some of GDXJ’s components overlap into the GDX portfolio, but the newer fund weights smaller capitalization (read: development and exploration) companies more heavily than producers.
The excess variance can be seen readily when you plot the price ratio of the two ETF portfolios. The GDX/GDXJ ratio started life around 2.0 (that is, GDX’s price was roughly twice that of the nascent GDXJ fund’s), but has generally drifted lower since then.
I say “generally” because there have been significant gyrations along the ratio’s downward course. At times, the ratio sinks, meaning GDX’s senior producers lose value relative to the exploration companies. That’s when investors’ risk appetites sharpen.
At other times, when investors rein in their risk-taking, the ratio tends to rise in favor of GDX. Presently, the GDX multiple is 1.72 times – not its lowest value, but well off its most recent top at 1.92x. If the ratio breaks through the 1.72x level, a test of its old low at 1.69x is likely to follow.
But here’s the thing: A falling ratio means a bigger market appetite for risk. More specifically, a bigger appetite for Gold Mining stock risk. That, in turn, is an expression of investor confidence in bullion’s price strength.
So if you’re bullish on Gold Prices, then, you want the ratio between the broad gold-mining sector and the juniors miners to fall. Which it is doing.
Buy Gold Bullion at live “spot” prices online using the award-winning world No.1 BullionVault…
-
I know Mike is a very solid investor and respect his opinions very much. So if he says pay attention to this or that - I will.
~ Dale G.
-
I've started managing my own investments so view Michael's site as a one-stop shop from which to get information and perspectives.
~ Dave E.
-
Michael offers easy reading, honest, common sense information that anyone can use in a practical manner.
~ der_al.
-
A sane voice in a scrambled investment world.
~ Ed R.
Inside Edge Pro Contributors

Greg Weldon

Josef Schachter

Tyler Bollhorn

Ryan Irvine

Paul Beattie

Martin Straith

Patrick Ceresna

Mark Leibovit

James Thorne

Victor Adair