

NBER Likely to say “Recession Ended” July 2009; Assessing the Real Time Probability US Back in Recession
One problem with the NBER recession dating analysis is that it is months and sometimes years late in making its assessments.
Marcelle Chauvet, professor of economics at the University of California addresses those shortfalls in an interesting article called Real Time Analysis of the U.S. Business Cycle
Although careful deliberations are applied to determine turning points, the NBER procedure cannot be used to monitor business cycles on a current basis. Generally, the committee meets months after a turning point (that is, the beginning or end of an economic recession) has occurred and releases a decision only when there is no doubt regarding the dating. This certainty can be achieved only by examining a substantial amount of ex post revised data. Thus, the NBER dating procedure cannot be used in real time. For example, the NBER announced only in July 2003, twenty months after the fact, that the 2001 recession had ended in November 2001.
Some models, however, can gauge how weak or strong the economy is and date business cycles in real time. In particular, the dynamic factor Markov switching model (DFMS) in Chauvet (1998) has been very successful in dating business cycles in real time and in closely reproducing the NBER dating.
The model yields a monthly indicator of the U.S. business cycles and probabilities of recessions and expansions when applied to the same series used by the NBER: nonagricultural employment, real personal income, real manufacturing and trade sales, and industrial production.
What does the DFMS nonlinear probability model tell us about U.S. recessions?
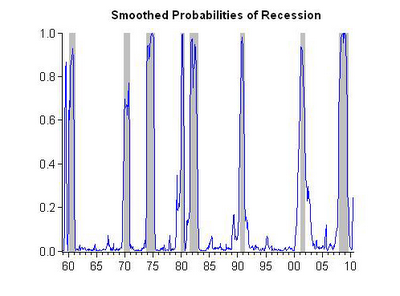
Since 1959 the U.S. economy has experienced eight recessions. Figure 1 shows the business cycle indicator, and Figure 2 shows the smoothed probabilities of recessions obtained from the DFMS model and the NBER recession dating. The probabilities are obtained using full sample information (that is, all information available from 1959 up to now).
As Figure 2 illustrates, the probabilities increase substantially at the beginning of recessions (peaks) and decrease around the end of the recessions (troughs). Recessions are generally short, lasting on average a year, whereas expansions are much longer, averaging about five years. The 1990s experienced the longest U.S. expansion (ten years) in the past 150 years, while the 2007–09 recession was the longest in the past 50 years.
…..read Mish’s analysis HERE