
Daily Updates
Quotable
“If Ben goes wacko in Jacko, could stocks spike like the Grand Teton?” – Peter Eavis, The Wall Street Journal
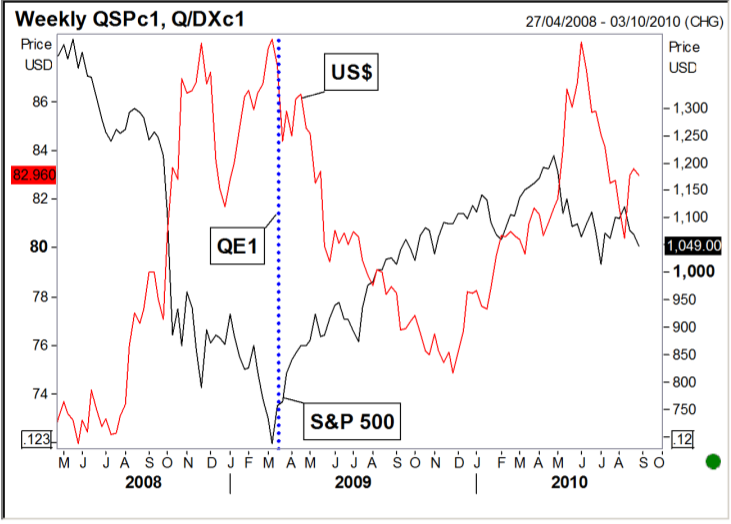
FX Trading – To QE2 or Not to QE2, That is the Question …
Dong, dong, dong….as the hour of Big Ben’s speech this morning from Jackson Hole approaches, bets are being lined up as whether Mr. Bernanke will indeed rev up his helicopter for yet another strategic drop…
Action: Mr. Bernanke says yes, the Fed will embark on quantitative easing #2 (QE2).
Reaction #1:
1. The dollar get’s whacked hard, as it did when the Fed embarked on QE1 back in March of 2009, thanks to falling US yield differential and larger supply of dollars on the market
2. Stocks rally sharply on all the new liquidity that will be used to bid up financial assets, knowing very little will likely leak out into the real economy anytime soon.
Reaction #2: My gosh! Is it really that dire? We really are in the soup. QE1 didn’t work, and that was with the support of a massive fiscal stimulus to boot. What’s the incentive to borrow and lend no matter how many more bank reserves are created. It’s not real money until it gets into the real economy. Thus, this move will not keep us from tipping into deflation, which will only push consumers deeper into their respective shells and provide yet another disincentive for companies to invest or hire new employees.
1. Stocks tumble on the realization current earnings expectations are way out of whack.
2. Dollar support on the good old risk aversion trade.
Of course, Mr. Bernanke could say that yes we still have QE2 as ammunition in our arsenal, but we see no reason to use it now. Interest rates are already low, the credit market is functioning just fine, though the latest data has been soft — we believe things are improving globally and there is very little chance of a double-dip recession. Germany is rebounding nicely and though China is slowing a bit, there is still brisk demand flowing from Asia and other emerging markets. Japan is hurting, but we expect new easing measures there will help boost growth and support the global recovery. Jobs growth has been disappointing, but recently we have witnessed job growth at the state level for the first time in a while, we think this is proof both monetary and fiscal policy, which always work with a lag, are now finally starting to…..
…..read pages 3 – 4 HERE
Since 1950 there have been 35 higher Augusts and 25 lower, up 58% of the time, bullish. Short-term traders might consider trading the positive percentages during the last three days before Labor Day, a long holiday weekend, as the Dow has been up 36 of the last 49 years, for a 73% bullish track record. Labor Day this year falls on September 6th, so Sep 1-3 should be bullish.
August combined with July’s action marked important turning points in every single year from 1982 to 1990 although there were neither Tops nor Bottoms in the summers of 91-97 (perhaps due to our “Mother of All Bull Markets” in the 1990s) but 1998 – 2007 included the high or low for the year in many cases. In 2008, 15 Aug marked the final Top Before the Dow’s Waterfall Decline in the bear market. In July 2009, the Dow endured the last significant decline prior to a 3,171 point rise that lasted until 26 April 2010. So something important might again begin this summer.
The Dines Gold Stock Average (DIGSA) in the last 42 Augusts rose 21 times, declines 18 times, and was neutral three times, scarcely bullish at 54%. The Dines Silver Stock Average (DISSA) rose 23 times (56%), declined 18 times (44%) and was neutral once. So, gold and silver’s percentages are also slightly bullish. Yet, based on DIGSA, careful research also reveals that gold shares’ more-important Bottoms occurred in Nov 71, Aug 76, Jul 82, Jul 86, Sep 88, May 89, Jun 90, Nov 92, Sep 93, Dec 97, Aug 98, Jul 99, Oct 00, Jul 01, Jul 02, Aug 07, and recently, Nov 08 – mostly around the third but also fourth quarters. This suggests that gold and silver stocks might be approaching another important Bottom in the coming months – perhaps in August.
James Dines is editor of The Dines Letter, P.O. Box 22, Belvedere, CA 94920, 1 year, 14 issues, $295. For a limited time, the subscription includes two FREE Special Reports. For details visit www.dinesletter.com.
Money can lose its value through excessive abundance, if so much silver is coined as to heighten people’s demand for silver bullion. For in this way the coinage’s estimation vanishes when it cannot buy as much silver as the money itself contains…The solution is to mint no more coinage until it recovers its par value – Copernicus
Silver Velocity to rise
Our Hinde Silver Trend model has reached a significant low that usually precedes a dynamic move. This move can be lower or higher but our other technical indicators signal a move higher is the most likely scenario.
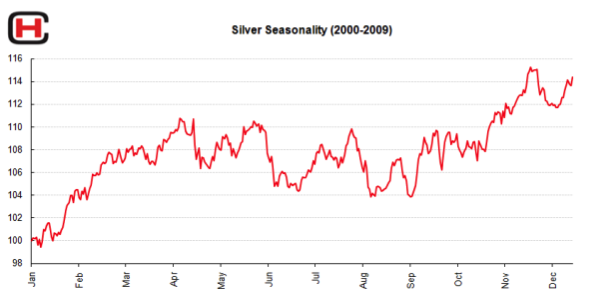
Silver Seasonality
Our silver seasonality analysis suggests that the trend will be directionally higher in price.
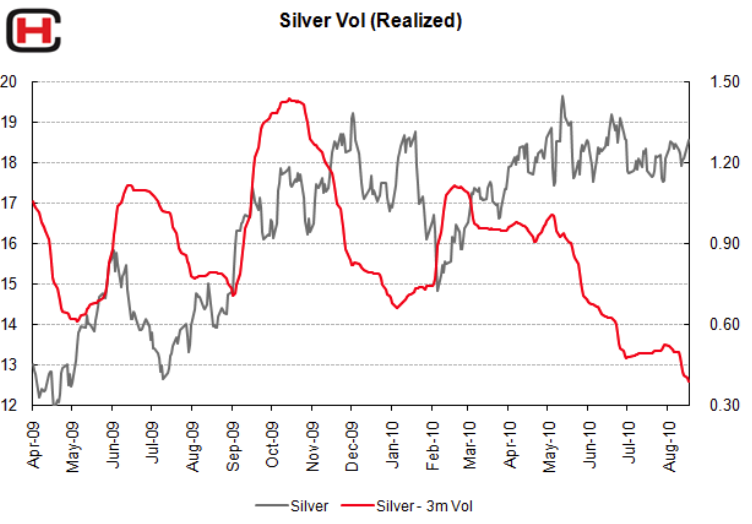
Silver Volatility
Other than just purchasing silver bullion (in allocated form), speculators could purchase volatility. As one can see from the chart below historical price volatility is at the lowest standard deviation on a rolling 3 month basis that it has been for sometime. Straddle break evens look attractive or likewise out-the-money call premiums look cheap, for those who agree with our directional bias for a move higher.
Silver’s timeless fascination
Mankind’s timeless fascination with silver stretches back millennia. As early as 700 B.C., the Mesopotamian merchants used silver as a form of exchange. Later, many other civilizations also came to recognize the inherent value of silver as a trading metal.
The ancient Greeks minted the drachma, which contained 1/8th ounce of silver; and in Rome, the basic coin was the denarius, weighing 1/7th ounce. And let’s not forget the English shilling “sterling,” originally denoting a specific weight of silver, which has come to mean excellence. In fact the words for “silver” and “money” are the same in at least 14 languages.
Silver or money is derived from the Ancient Greek: ργήντος – argēntos, gen. of ργήεις – argēeis, “white, shining” ). The Incas of Peru called it the “tears of the moon” because they were awed by silver’s strange gleam and the Chinese believed that a silver locket hung around a child’s neck would ward off evil spirits.
In recent years silver has grown to be regarded as the poor man’s gold. However we suspect silver will shake off this unfortunate shackle and give gold a “run for its money” as the old idiom goes.
There are key fundamental differences between gold and his poor cousin silver. Demand for gold is almost entirely from those holding for financial safety and protection of purchasing power and likewise from fabrication that preserves it. Gold is rarely if at all consumed. A base metal is the opposite, it is consumed. Like iron for example.
Here silver is unique, industry will consume it, and others will buy for financial gain and protection. Fluctuations in the price of gold primarily arise from changes in demand as annual mine supply is small compared to existing stockpiles; of the same magnitude as the small amount lost or consumed each year. Hence over ground supplies don’t change much.
Silver ounces come and go. Unlike gold silver’s active chemical properties lend it to practical industrial use that see much of it used beyond practical recovery. The uses for silver in modern industry are growing. It is the best conductor of both heat and electricity, the most reflective, and after gold the second most ductile and malleable element. It is used in photography, electrical applications, particularly in conductors, switches, contacts and fuses. Silver alloys are used in batteries as cathodes. As a bactericide, silver is used in water purification and air handling systems. Silver is also a natural biocide and is very effective against bacterial infections such as MRSA. New products using silver’s biocidal qualities are being developed each year; clothing, bandages, toothbrushes, door-knobs (flu-protection), keyboards, the list goes on growing.
Silver is much less rare than gold and as a consequence less effort goes into salvaging and protecting it. Annual mine production and consumption are large compared to existing stock piles, so price fluctuations in theory come from both these factors as well as investment demand.
….read mid page 3 – 11 HERE including these topics:
Silver supply demand imbalance
Money velocity rises leads to Silver rise
Exchange traded commodities are very cheap
SUMMARY of the most important Gold Silver ratios
.…start at mid page 3 – 11 HERE
Manipulating the Silver Market
If someone were manipulating the silver market, you would see exactly what has actually occurred in silver over the past several days.
To manipulate the price you would use your buying power and accumulate long positions until you force silver above resistance in the high $18.40s and thereby trigger all the buy-stops sitting there, including the one we placed. You would then sell your long positions into those buy-stops and keep selling until (1) you became short and (2) your selling drove prices lower.
I have just described exactly what has just taken place in silver. What we have seen is a classic textbook case of market manipulation. We have seen it so many times before in recent years, it is the reason I warned on 18 August: “Let’s see if silver can hold this level, particularly with option expiry coming soon.”
I expect that we will see the rest of this repetitive pattern of manipulation play out over the next few days until this month’s options expire. I also expect that silver will remain under $18 during this period.
There may in fact be another bout of selling pressure by the shorts to shake out some more weak-hands. It would give the manipulators an even bigger profit when they buy back on even lower prices the short positions they established on the breakout above $18.40. Consequently, I will not be surprised if the 2-year uptrend line in the following chart is broken this week.
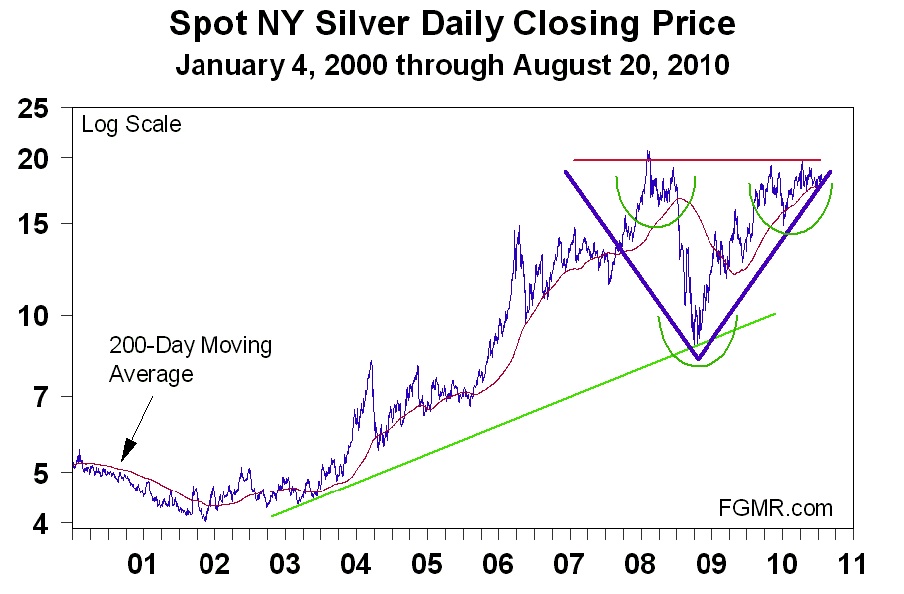
I don’t think that uptrend line will be broken, but don’t panic if it is. And don’t be distracted from the big picture – both technical and fundamental. Technically, silver has nearly completed a huge accumulation pattern, and the ‘head-and-shoulders’ pattern in the above chart is far more important than the 2-year uptrend line. Silver is approaching an important upside breakout. It is the breakout that I have been anticipating for months.
The fundamental picture for silver is just as bullish. Monetary debasement throughout the globe is causing astute people everywhere to carefully look for prudent alternatives. It is inevitable that they eventually discover what countless people have already discovered over the past decade – that gold and silver are safe-havens from monetary debasement.
Thus, everything remains in place for an upside explosion in silver. With each passing day, week and month we are getting closer. Be ready for that breakout by not losing sight of the big picture.
For my specific trading recommendations, see Trading.
About the Free Gold Money Report
James Turk began publishing the Freemarket Gold & Money Report in March 1987 as a subscription-based investment newsletter focusing primarily on precious metals and national currencies. In August 2009, the newsletter completed a total transformation to become a free, web-based commentary. Accordingly, its name was changed to the Free Gold Money Report.
The objective of this website is to be informative and educational. It aims to help readers better understand gold, money and currency through James Turk’s commentaries and insights.
About James Turk
James Turk is founder and chairman of GoldMoney, which provides a convenient and economical way to buy and sell gold, silver and platinum online using the digital gold currency for which he was awarded four US patents. He has specialized in international banking, finance and investments since graduating in 1969 from George Washington University with a B.A. degree in International Economics. He began his business career with The Chase Manhattan Bank (now J.P. Morgan Chase), which included assignments in Thailand, the Philippines and Hong Kong. In 1980 he joined the private investment and trading company of a prominent precious metals trader. He moved to the United Arab Emirates in December 1983 to be appointed Manager of the Commodity Department of the Abu Dhabi Investment Authority, a position he held until resigning in 1987 to begin FGMR.
James Turk has written several monographs on money and banking and is the co-author of The Coming Collapse of the Dollar (Doubleday, 2004), now available in a paperback version entitled The Collapse of the Dollar (www.dollarcollapse.com).
Equityclock.com is offering free access to a data base showing seasonal studies on individual stocks and sectors. The data base holds seasonality studies on over 1000 big and moderate cap securities and indices. Free services are available for this summer only. Enjoy while available!
The Stock Market Outlook for August 26th, 2010 HERE
also
Combining Seasonal Investing with Technical Analysis HERE
By definition, seasonal investing includes:
- A start date for an investment
- An end date
- Either price strength or weakness between the start and end dates for the chosen equity, sector, index or commodity.
…..as above, more HERE
Seasonality Myths
One of the greatest myths on the Street is that North American equity markets usually experience a “summer rally”. Traders frequently start talking in May about the possibility of a rally in the stock market in the June to August period. Talk by traders normally escalates during a period when North American equity markets are experiencing a short term correction. The message is “Don’t worry, be happy. The market will come back”. A long term study of the market confirms that a rally lasting three weeks or more inevitably happens during the three month summer period. However, traders fail to mention that the three week rally period has no consistency. Timing of the appearance of the three week rally is random and can appear at any time during the three month period. Of greater importance, traders fail to mention that virtually all three month periods during the year record at least one period of recovery lasting three weeks or more regardless of season.
Another myth is the expression “Sell in May and go away”. The myth originated from an actual period of seasonal strength in the base metal sector. Base metal prices as well as base metal equity prices tended to peak early in May and bottom near the end of September. The main reason was the annual operating shut down by base metal smelters in Europe in July and August for Europe’s extended holiday season. Demand by smelters for base metal concentrates slowed in May and recovered in September. Currently, base metal prices continue to show this seasonal pattern, but the pattern has been muted over the years. Market share of base metal smelter capacity in Europe has declined while market share in the Far East and South America has increased. Over the past decade, the “Sell in May and go away” phrase became adopted by the media, but with a slightly different twist. The phrase was transformed into expectation for weakness by broadly based North American equity indices such as the S&P 500 Index and the TSX Composite Index from the end of May to the end of September. The myth is not supported by fact. The S&P 500 Index and the TSX Composite Index has gained in five of the past ten periods from the end of May to the end of September. Unlike the period of seasonal strength by North American equity markets from the end of September to the end of April, performance in the May to September period is random. This period does not have a sufficient number of annual recurring events to influence equity markets.
Another myth is that the month of October is a weak and dangerous month for North American equity markets. The myth is based on the fact that substantial downdrafts in North American prices have occurred in the month of October. October 1929 and October 1987 are seared into the minds of traders. However, data during the past ten years suggests that fears of weakness in October no longer are founded. The S&P 500 Index has advanced in five of the past 10 periods and the TSX Composite Index has gained in seven of the past 10 periods. On the contrary! October frequently is the month of the year when important seasonal lows frequently are reached.
-
I know Mike is a very solid investor and respect his opinions very much. So if he says pay attention to this or that - I will.
~ Dale G.
-
I've started managing my own investments so view Michael's site as a one-stop shop from which to get information and perspectives.
~ Dave E.
-
Michael offers easy reading, honest, common sense information that anyone can use in a practical manner.
~ der_al.
-
A sane voice in a scrambled investment world.
~ Ed R.
Inside Edge Pro Contributors

Greg Weldon

Josef Schachter

Tyler Bollhorn

Ryan Irvine

Paul Beattie

Martin Straith

Patrick Ceresna

Mark Leibovit

James Thorne

Victor Adair