
Daily Updates
Below are the top 10 fastest-growing Gold/Silver stocks, UPDATED TODAY before 4:30 AM, based on the average long-term earnings growth rate estimated by Wall Street analysts.
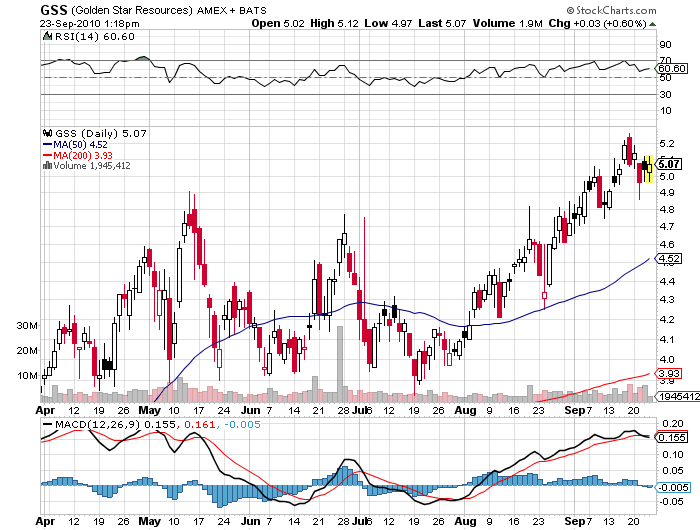
Golden Star Resources Ltd. (USA) (AMEX:GSS) is the 1st fastest-growing stock in this segment of the market. Its long-term annual EPS growth is expected to be 1931.0%. This number is based on the average estimate of 1 brokerage analyst(s).
Endeavour Silver Corp. (CAN) (AMEX:EXK) is the 2nd fastest-growing stock in this segment of the market. Its long-term annual EPS growth is expected to be 1619.0%. This number is based on the average estimate of 1 brokerage analyst(s).

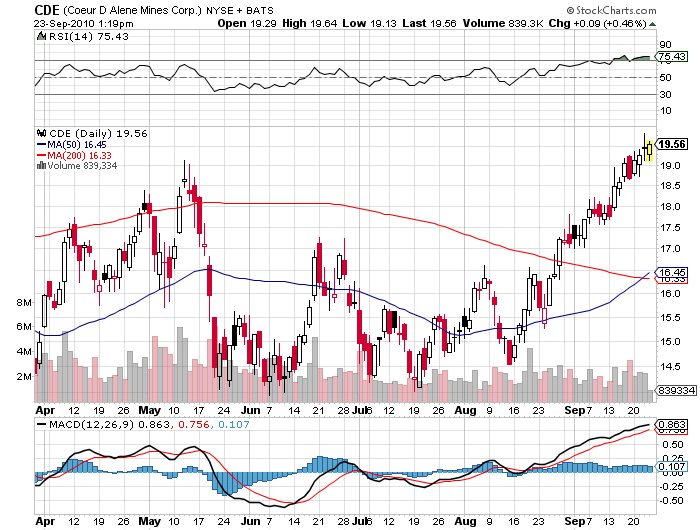
Coeur d’Alene Mines Corporation (NYSE:CDE) is the 3rd fastest-growing stock in this segment of the market. Its long-term annual EPS growth is expected to be 321.0%. This number is based on the average estimate of 1 brokerage analyst(s).
Randgold Resources Ltd. (ADR) (NASDAQ:GOLD) is the 4th fastest-growing stock in this segment of the market. Its long-term annual EPS growth is expected to be 181.8%. This number is based on the average estimate of 2 brokerage analyst(s).

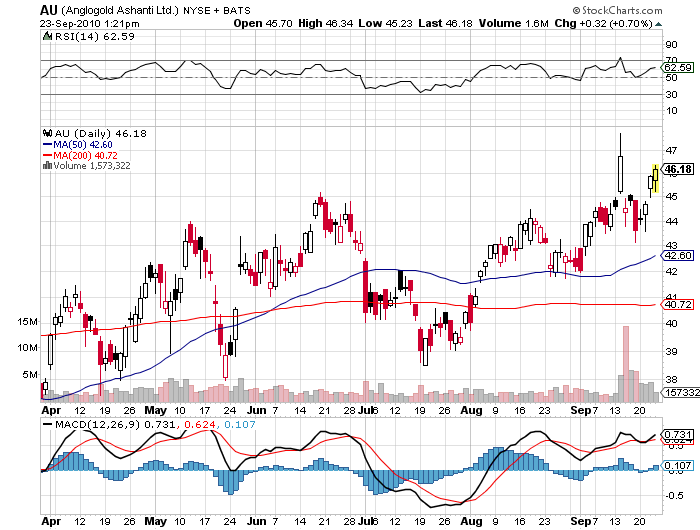
AngloGold Ashanti Limited (ADR) (NYSE:AU) is the 5th fastest-growing stock in this segment of the market. Its long-term annual EPS growth is expected to be 113.2%. This number is based on the average estimate of 1 brokerage analyst(s).
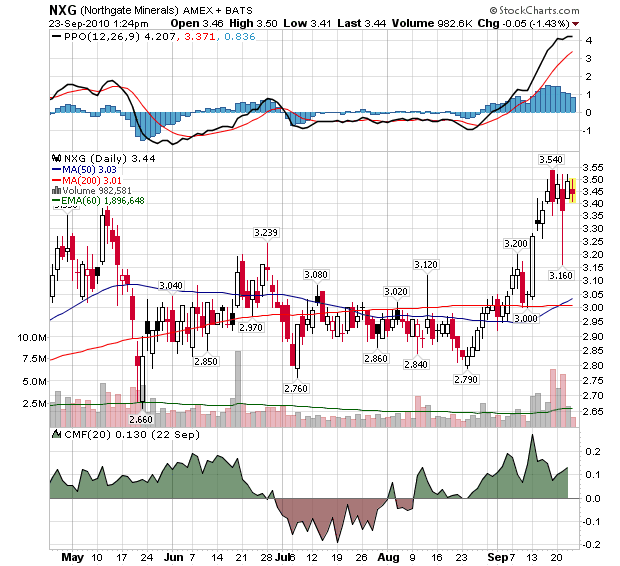
Northgate Minerals Corporation (USA) (AMEX:NXG) is the 6th fastest-growing stock in this segment of the market. Its long-term annual EPS growth is expected to be 106.7%. This number is based on the average estimate of 1 brokerage analyst(s).
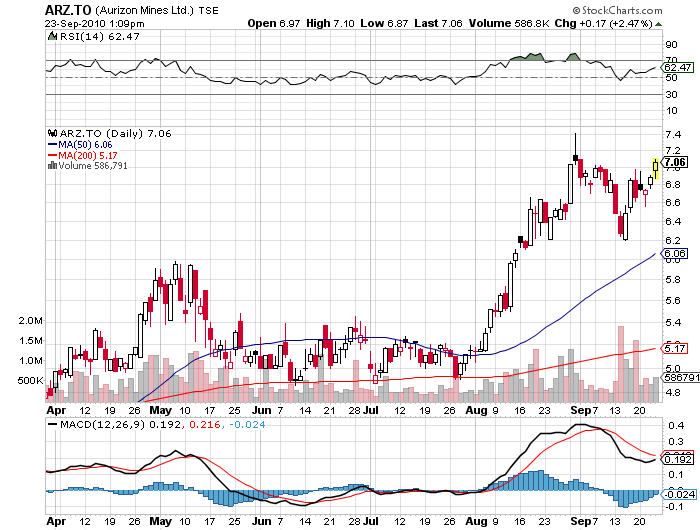
Aurizon Mines Ltd.(USA) (AMEX:AZK) is the 7th fastest-growing stock in this segment of the market. Its long-term annual EPS growth is expected to be 87.0%. This number is based on the average estimate of 1 brokerage analyst(s).
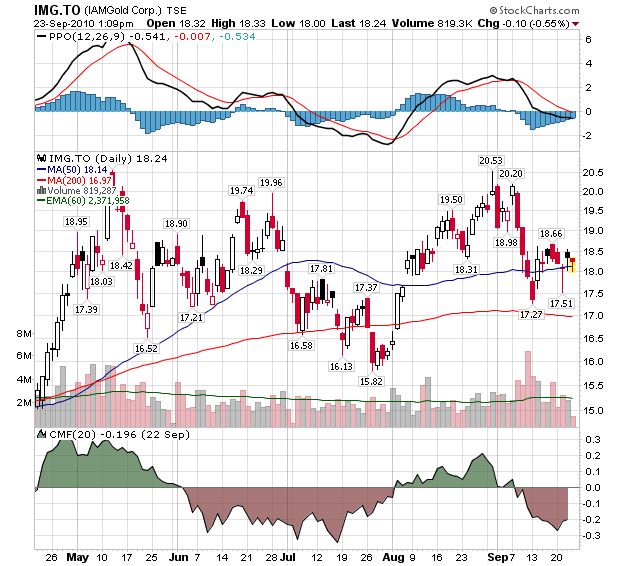
IAMGOLD Corporation (USA) (NYSE:IAG) is the 8th fastest-growing stock in this segment of the market. Its long-term annual EPS growth is expected to be 69.5%. This number is based on the average estimate of 2 brokerage analyst(s).
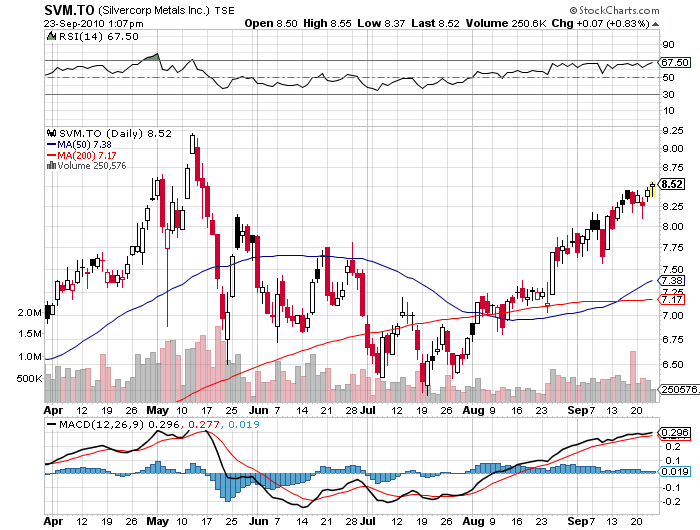
Silvercorp Metals Inc. (USA) (NYSE:SVM) is the 9th fastest-growing stock in this segment of the market. Its long-term annual EPS growth is expected to be 68.0%. This number is based on the average estimate of 1 brokerage analyst(s).
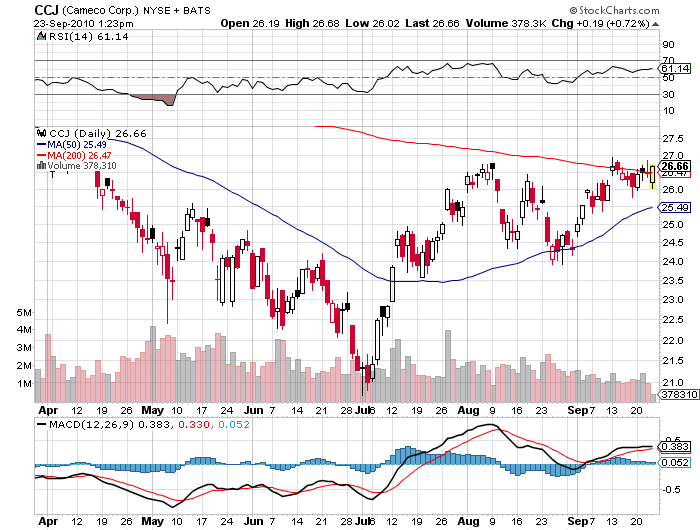
Cameco Corporation (USA) (NYSE:CCJ) is the 10th fastest-growing stock in this segment of the market. Its long-term annual EPS growth is expected to be 34.0%. This number is based on the average estimate of 2 brokerage analyst(s).
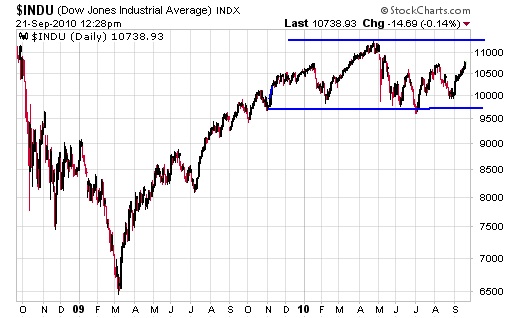
U.S. Stock Market – Lets face it the fundamentals are ugly and it’s hard to make a case for owning general equities in this environment. Yet technically the picture isn’t half as bad. Despite all the predictions (and emails to me) predicting an imminent crash, the market has held its own. Yours truly isn’t surprised at this because it’s been my belief we would stay in a trading range where we end up net not going anywhere fast (but moving towards the bottom of the range as Election Day grows near was a thought).
Please look at the above chart and notice from the June/July period to now, the DJIA has traced out a ‘W-like” formation. We’re right up against a neckline one could draw with that formation and a break above it would be bullish. This formation is somewhat diluted due to weak volume but mustn’t be totally disregarded.
I agree with those who say there’s no fundamental reason to own U.S. equities in any significant size but after 25+ years in this game, I learned (sometimes the hard way) never to totally disregard technical patterns that fly in the face of fundamentals. The next several days bare watching.
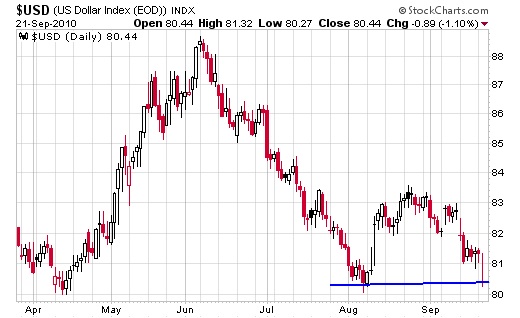
U.S. Dollar Index – The little relief rally to the 84 area and then back to and eventually below 80 is playing out. Look for an acceleration to the downside if we get 3-4 consecutive days of closes below 80.

Gold – A few weeks ago I mentioned how gold was trading in a well-defined and bullish uptrend channel. It has continued to do so. With option expiration’s next week and well within my 2010 target of psychological resistance of $1,300, I would prefer we not hit the next payment level for our “Tokyo Rose” Relief Fund for a few days.
While we continue to have lots of negative comment about gold from the usual suspects, it’s interesting to note that new bullish enthusiasm is emerging. The gold perma-bears worse enemy is such strong physical buying that overrides the games they play on the Crimenex (Comex). Remember, they made win an occasional paper battle but they lost the war hundreds of dollars ago.
Oil and Natural Gas remain totally non-interesting to me from either side.
On Major Moves, Peter Grandich has been very right and not only saved many investors fortunes, but expanded them dramatically. On November 3, 2007 at the MoneyTalks Survival Conference, Peter Grandich of the Grandich Letter warned that “an unprecedented economic tsunami will hit American beginning in 2008”. Peter advised publicly to short the US market two days from the top in October, 2007 and stayed short until the last week of October, 2008. He began to buy stocks in March 7th, 2009. He also bought oil and oil related investments near the lows after the dive from $147.
….go to visit Peter’s Website
To HERE Peter speak and others speak on Trading go HERE: 
For Income and Diversification, Have You Considered International Bond ETFs?
In these turbulent times, plenty of investors just want steady income. Others realize they need to look outside the U.S. as they ride out the storm. Yet in a world where some once-stable economies are starting to look like emerging markets, they also see the need for diversification.
Here’s an answer that ought to satisfy both needs: International bond exchange traded funds (ETFs). These offer a quick, easy way to round out your income portfolio with an asset class you may not have considered.
So today we’ll begin with a closer look at …
Bonds from Around the World
When you loan your money to someone — which is what you are doing when you buy any kind of bond — you expect to get a return on your investment. This is called the interest rate or yield, and is determined mainly by the amount of risk you’re taking.
If you loan your money to someone whom you are pretty sure will be around to pay you back, your return will be lower.
But when you loan your money to someone who may disappear before repaying you, you demand a higher interest rate. This is why people with no cash and no steady income get raked over the coals by lenders.
The same principle applies to governments and companies …
The U.S. government is a good example. Treasury bond interest rates are lower than just about everything else because the federal government isn’t going anywhere.
On the other hand, those that are considered riskier have to pay more when they borrow. For instance, nations like Greece with very high spending and a crumbling tax base are considered high-risk borrowers.

And some nations are in between. They aren’t nuclear superpowers like the U.S. — but they’re still relatively stable. Brazil, Poland, South Africa, and Malaysia are good examples. Their bonds have a good balance of limited risk and attractive reward.
Currencies Add to the Allure
With international bonds you also have an added twist: Currency values. You’re starting with dollars, and eventually you’ll need to withdraw dollars, too. Therefore, if you buy bonds denominated in a foreign currency and that currency appreciates against the dollar, your return will be higher. But any losses can be aggravated if the dollar gains on your chosen currency while you are in it.
As a lender, you have to find a balance between lower risk, lower return assets and riskier assets with potentially higher returns. The exact answer depends on your particular goals.
If international bonds look like a good fit for you, then ETFs are an excellent way to participate! You get a quick, inexpensive portfolio with one easy trade. Here are a few of the ETFs in this category you may want to consider:
- iShares JPMorgan USD Emerging Markets Bond (EMB) is the biggest international bond ETF and one of the most heavily traded by U.S. investors. True to its name, EMB holds government bonds from emerging market nations — but only bonds that are issued in U.S. dollar terms. That means this ETF has limited currency risk.
- Market Vectors Emerging Markets Local Currency Bond (EMLC) and WisdomTree Emerging Markets Local Debt (ELD) are a lot like EMB but with a huge difference: Both are composed of bonds issued in local currencies. By adding foreign currency exposure to the bond exposure, these two ETFs are doubly risky. But if the U.S. dollar declines, they could outperform as well.
- SPDR Barclays International Treasury Bond (BWX) sounds similar to EMB, but in fact there are big differences between the two. BWX has a broader scope and thus includes bonds from developed market nations like Japan, U.K., and Germany. These bonds are also issued in their local currencies. Whether this is helpful or not can vary. Over the last year, BWX severely lagged the performance of EMB because of weakness in the euro and British pound.
- SPDR DB International Government Inflation Protected Bond (WIP) is an interesting twist on this theme. WIP holds inflation-protected government securities from around the world. These are bonds that have an adjustment factor to compensate investors for any increase in the issuing country’s inflation benchmark.
- PowerShares International Corporate Bond (PICB) and SPDR Barclays International Corporate Bond (IBND) hold higher-yielding investment grade bonds issued by international companies rather than governments. Unfortunately, both these ETFs are quite small and illiquid. I hope this niche grows because it could be very useful in building balanced global portfolios.
One other innovation I’d love to see, but which doesn’t exist yet, is an international “junk bond” ETF. My guess is that at least one sponsor is working on the idea, although none have filed with the SEC for such a fund yet.
Several more international bond ETFs are out there, but the ones listed above cover most of the current menu. Take a closer look. With ETFs like these, you can transform your fund holdings into a worldwide portfolio.
Best wishes,
Ron
This investment news is brought to you by Money and Markets. Money and Markets is a free daily investment newsletter from Martin D. Weiss and Weiss Research analysts offering the latest investing news and financial insights for the stock market, including tips and advice on investing in gold, energy and oil. Dr. Weiss is a leader in the fields of investing, interest rates, financial safety and economic forecasting. To view archives or subscribe, visit http://www.moneyandmarkets.com.
Are stocks telling us it’s time to get short?
When do bear markets end?
No, this isn’t a trick question. Some people say the answer is “complicated,” yet I assure you that it is not. In fact, the end of a large bear market includes many indicators that are downright quantifiable.
The simplest answer to the question amounts to a nine-word sentence. But first allow me to show what the end of a bear market is by describing what it is not.
It is NOT the end of a bear market when:
- Mutual fund cash holdings fall to just 3.4%, the lowest level in 60 years (previous extreme lows came in 2000 and 2007)
- The Dow Industrials have a 2.7% annual dividend yield (a lower percentage than 1929)
- A major sentiment indicator shows 24.3% bears (fewer than Oct. 2007)
- TRIN readings since the May 6 flash crash register .25 or lower for 21 trading days (readings this low indicate “buying panics”)
- The market sees trading volume rise during declines but not during rallies (which was true during the summer months and into September)
- The city of Atlanta has a 21.2% commercial vacancy rate (2nd highest of major U.S. markets), yet owners of troubled properties claim to “remain optimistic”
- This year has seen the sale of $4.4 billion in bonds which are tied to subprime auto loans (already more than 2x sales in 2009)
- All the above (and more) is true, but the nation’s financial newspaper of record posts a mid-day stock market summary with a quote from a top fund manager who says, “This as optimistic as I have been this year.”
When we’re at or near the end of a bear market, the list above will read as a mirror-opposite: Mutual fund cash holdings, for example, will be up at record high levels. And at a true major bear market low, no investor will purchase a bond linked to subprime auto loans — because no SANE issuer will dream of bringing such a toxic security to market!
This environment cannot be the end of a bear market. So here I offer the simple nine-word sentence — a major bear market ends when:
Everyone who is going to sell has done so.
At the end of a bear market, selling is exhausted; prices hit stunning long-term lows; buyers create an obvious bull trend. Alas, dear reader, that is not today’s market. The facts show terrible fundamentals; buyers now assume absurd levels of risk; media reports reflect a wild optimism based upon …
… Nothing.
Please look again at what the end of a bear market is NOT — it comes directly from just a few of the facts and evidence you’ll find in the September issue of Bob Prechter’s Elliott Wave Theorist. More important still is the context Bob provides — complete with the insights, analysis and forecasts that he alone can deliver.
My colleagues at EWI have put together a special offer for you; it’s not available on the public pages of our website. Until Friday, Sept. 24, you can start a 2-week trial to the Financial Forecast Service. Follow this link to learn more.
Thanks for reading,
-
I know Mike is a very solid investor and respect his opinions very much. So if he says pay attention to this or that - I will.
~ Dale G.
-
I've started managing my own investments so view Michael's site as a one-stop shop from which to get information and perspectives.
~ Dave E.
-
Michael offers easy reading, honest, common sense information that anyone can use in a practical manner.
~ der_al.
-
A sane voice in a scrambled investment world.
~ Ed R.
Inside Edge Pro Contributors

Greg Weldon

Josef Schachter

Tyler Bollhorn

Ryan Irvine

Paul Beattie

Martin Straith

Patrick Ceresna

Mark Leibovit

James Thorne

Victor Adair