
Daily Updates
The Hera Research Newsletter (HRN) is delighted to present the following powerful interview with noted speaker and best selling author Dr. Marc Faber, whose newsletter, The Gloom Boom & Doom Report, highlights unusual investment opportunities. Dr. Faber is a popular speaker at investment seminars and conferences around the world and is best known for his contrarian investment approach
The Russians might be tapped out of one of their most precious natural resources…
Palladium.
And now that the country won’t be able to supply the market, palladium prices could be headed for an explosive increase.
For investors, there’s a small window of opportunity to get in before prices really start to take off.
Palladium: A new precious metal investment angle
Even though it’s considered a “precious metal,” palladium is not used for jewelry as much as gold and silver are.
Rather, the white metal is primarily used in consumer and industrial goods.
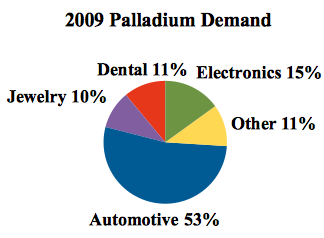
Palladium is often found in electronics — cell phones, LCD TVs, laptops, iPods, DVD players, monitors… There’s no doubt that you have several electronic devices nearby, as you read this, that are filled with palladium.
But the primary application for palladium is in the manufacturing of automobile catalytic converters, which convert up to 90% of harmful gases from auto exhaust (like carbon monoxide) into less harmful substances.
In fact half of annual worldwide palladium supplies go into the production of autocatalysts.
As such, palladium demand is generally correlated to the health of the global auto industry, which has strongly rebounded this year.
Vehicle sales in every one of the top ten auto markets in the world are increasing:
- The U.S. auto market, where sales have climbed 8.4% in the first eight months of 2010 to almost 7.7 million units.
- China, the largest car market in the world, increased auto sales by 39.0% in the January-August 2010 period to 11.6 million unitss.
- Domestic monthly sales of new cars, trucks, and buses in Japan, the world’s #3 auto market, increased 46.7% in August 2010 from a year earlier — the highest monthly gain since 1972. This was the 13th straight month of increased auto sales in the country.
Overall, global light vehicle production is expected to increase 60% through 2016.
Take a look:
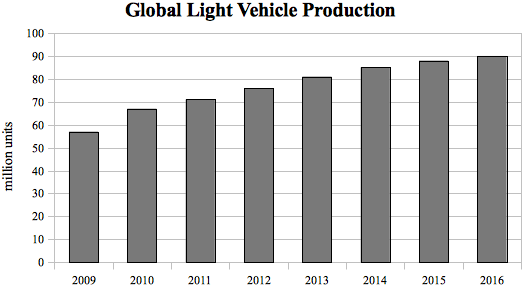
As the global auto industry continues to recover, the demand for palladium will increase with the growing demand for catalytic converters.
The recovery of the global auto industry will push the demand for palladium higher.
But the world’s palladium resources are extremely limited. About 80% of the global palladium supply comes from just two countries: South Africa and Russia.
The largest palladium reserves in the world are in the Bushveld Complex in South Africa.
But half of the global supply of palladium comes from just three sources in Russia:
- Norilsk Nickel (OTCBB: NILSY)
- the Russian State Precious Metals and Gemstones Repository (Gokhran)
- the Russian Central Bank
Norilsk Nickel is the largest palladium producer in the world. Each year, the company produces about 2.5 million ounces of palladium — enough to satisfy a whopping 40% of total global demand.
But Norilsk’s palladium production isn’t enough to meet rapidly growing demand from the auto industry, so Russia fills the deficit from Gokran and the Russian Central Bank.
However, industry insiders are now suggesting that there will be no sales from Russia’s palladium stockpiles in 2011, indicating that the country’s supplies are nearing depletion.
Russia’s giant palladium stockpiles nearly dried up
Director of Norilsk Nickel Anton Berlin noted in a presentation given at ETF Securities Ltd. that the consensus is there will be no sales of palladium from the Russian state stockpile next year.
The actual level of Russia’s palladium stockpiles is a state secret, so Mr. Berlin had to be careful with his responses during the presentation…
He did point out that palladium sales from Russian stockpiles have been falling year after year. And he mentioned that stockpile sales are now a fraction of historic values — a clear indicator that Russia’s palladium reserves are approaching depletion.
Two years ago, the Russian government announced that it would begin limiting sales of palladium from the country’s inventories. Now it’s clear why.
Without Russian stockpiles to help feed supply, global demand will be more dependent on mine production.
But with the majority of resources concentrated into two potentially unreliable regions, increasing production to meet demand is nearly impossible.
Norilsk Nickel has published production plans as far out as 2025, and there are no plans for any substantial increase in palladium production.
South Africa is actively looking to increase palladium production by boosting the platinum: palladium production ratio from 2.1:1 to 1.9:1.
The issue here is that rising production costs are discouraging miners to focus production on palladium, which they can only sell at a third of the price of platinum.
The only other country in the world with tangible upside in terms of palladium production is Zimbabwe, but the security and political risk inherent in working in Zimbabwe is not ideal.
There is, however, one other region that has the potential to become a major palladium producer…
And it’s right here in North America.
Lake Superior’s $1.9 trillion secret
On the Northwestern shores of Lake Superior, bordering Ontario and Minnesota, the small port town of Thunder Bay is home to just over 100,000 people.
It’s been long known that just 50 kilometers north of Thunder Bay, geologic structures are similar to those of the Russian giant Norilsk-Talnakh deposits — the largest nickel-copper-palladium deposits in the world.
For decades, there has been one major setback with the minerals found at Thunder Bay…
Up until recently, explorers only found low-grade ore that was often uneconomical to process.
However, modern mineral exploration technology has led the way for the discovery of several new high-grade deposits in the past few years.
These deposits currently have estimated resources of:
- 15.6 billion pounds of nickel
- 501.4 billion pounds of copper
- 32.9 million ounces of platinum
- 37.4 million ounces of palladium
In total, these resources would be worth nearly $1.9 trillion out of the ground.
The entire region now has significant potential to be a major North American nickel-copper-platinum-palladium camp, as recent discoveries have demonstrated the presence of high-grade mineralization.
Major players in the area include Rio Tinto (NYSE: RTP), Marathon PGM (TSX: MAR), and North American Palladium (AMEX: PAL).
There are a handful of smaller companies exploring and developing similar nickel-copper-platinum-palladium projects — including one that I’m particularly excited about…
It’s a junior exploration and development mineral company with over 100,000 hectares, and it’s located smack-dab in between the two largest palladium deposits in North America.
To the west is North American Palladium’s Lac des Iles Mine, one of the largest palladium mines in North America. Lac des Iles has 3.7 million ounces of palladium resources and is projected to produce 140,000 ounces next year.
To the east is Marathon PGM’s Marathon Mine — containing 2.4 million ounces of palladium reserves plus 3.0 million ounces of palladium resources. It was just bought by Stillwater Mining (NYSW: SWC) for $118 million.
Take a look for yourself:
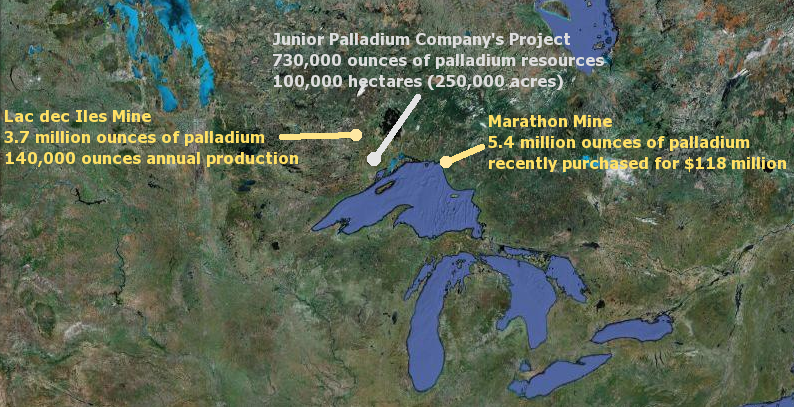
These are two of the most important palladium mines in North America.
Every junior palladium explorer wants land around them.
This junior company has already made the discovery of a palladium deposit on one of its many mining claims of 730,000 ounces of palladium-equivalent resources…
But the company is actively working to upgrade and increase its palladium resource base.
The target: 2.6 million ounces of palladium-equivalent resources.
And it’s worth 12.6 times more than the company’s current market cap.
This means that — once this company becomes resource-heavy and properly valued — share prices could increase 1,163%.
And that’s just at current palladium prices!
The last time palladium was entering a similar bull market, prices rapidly surged from $160 to over $1,100 an ounce — a 588% increase!
Fortunately, palladium prices have pulled back quite a bit, allowing for a buying opportunity. And if we have a similar bull market for palladium, prices could hit $3,438 an ounce!
With palladium prices nearing $3,500 an ounce, the investment gains from this small stock will start to increase exponentially…
I’ve already taken up too much time here. There’s a lot more to this story that I want you to hear.
I haven’t even begun to touch on how palladium prices are about to be forced higher by the global auto industry’s “big switch.”
In fact I just updated my latest report — one that I put together for an investment buddy up in New York.
I’m going to publish this report for paid subscribers of my Underground Profits investment advisory and to the Wealth Daily website next week.
But you can check out this report before I do that — by simply clicking HERE or copying and pasting the following link into your internet browser’s address bar: https://www.angelnexus.com/o/web/23365
Good Investing,

Luke Burgess
Editor, Wealth Daily
Investment Director, Hard Money Millionaire and Underground Profits
Perception Rules Reality
Stockscores.com Perspectives for the week ending September 26, 2010
One Liners
In this week’s issue:
Weekly Commentary
Strategy of the Week
Stocks That Meet The Featured Strategy
![]()
What moves stock price? Information filtered by the psychology of the market defines the market’s perception of a company’s fundamentals. It is the perception of fundamentals that determines stock price, and it is changes in the perception that leads to changes in price.
There are many investors and market experts who base investment decisions on fundamentals alone. They apply scientific analysis to the financial reality of a company’s business to arrive at the value of their stock. If this logical value of the stock is higher than the price the stock trades at, the stock is deemed worthy of purchase.
This analysis process leaves little room for the artful interpretation of value. Fundamental analysis is either black or white, leaving little room for the color of reality.
What make the financial markets colorful are the characters, motives and moods that taint the process of logical deduction. A stock whose fundamental value is $20 may only trade at $10 because a large investor has lots of stock to sell, a group of short sellers may have the stock gripped in fear, or investors may simply not like the color of the story.
There is an art to predicting stock price change.
It is not enough to know what the fundamentals will be tomorrow, it is also important to know how the market will judge those fundamentals. It seems obvious that a company announcing positive news will go up in price, yet we as investors have often seen the opposite happen.
Investors will judge fundamentals not only on their merit, but also on how they relate to expectations. Sometimes, fundamental change will be ignored in favor of more pressing macro economic issues.
Suppose you are told that a mining company will announce the discovery of a significant gold discovery in two days. In anticipation of news, and based on your privileged information, you buy the stock. You are excited by the prospect of what will be easy money, to materialize when the news is made public.
Two days later, the news is announced and you watch the stock with excited anticipation. But instead of jumping higher and higher, it goes up for a couple of minutes, and then suddenly begins a free fall lower. Your expectation of quick and easy profit quickly and easily turns to loss.
You can not understand why, it seems to make no logical sense.
Here are some of the possible reasons why the trade did not work:
1. The stock market is not fair. The inside information that you received two days before the news was obtained by others weeks earlier, and the stock already priced in its value. Your stock has been going up in anticipation of news for some time.
(continued below)
- Get the StockSchool Pro Free

Open and Fund a brokerage account with DisnatDirect and receive the StockSchool Pro home study course free, including special Pro level access through the DisnatDirect client website. Offer only available to Canadian residents. For information, click HERE
2. Expectations rarely live up to reality. Investors have a wonderful imagination, and the visions of those who were buying the stock in anticipation of the news pushed the stock beyond what the news was worth.
3. Without a reason to own, investors will sell. Many short term investors bought this stock in anticipation of news. When the news came out, so went the reason for owning the stock. Investors who buy in anticipation of news often sell when it is released.
4. The exit door is only so big. When a stock starts to do what investors don’t expect it to do, investors panic and all try to get out at once. This creates emotional selling that has no regard for fundamentals.
5. The tipster has motives different than yours. Believe it or not, the only person who cares about your money is you. Whoever gave you the “inside” information is only concerned about their money, and probably encouraged you to buy the stock because they already had.
6. Every stock correlates to the market. If the market is going down and pessimistic, buying a stock is like trying to paddle up stream. Some can succeed, but most eventually go with the flow.
Do not ever judge a stock through scientific analysis of fundamentals alone. You must always ask, what does the market think? How will the market judge this company? What effect will the mood of the market have on the perception of fundamentals?
Fundamentals don’t matter, only the perception of fundamentals is important.
![]()
This week, I ran one of my old and reliable Market Scans, the Stockscores Simple. This strategy seeks stocks that have Sentiment Stockscores of 60 or higher and Signal Stockscores of 80 or higher. I then inspect the charts, looking for breaks through resistance from periods of sideways trading.
I did this process this weekend and found the following:
![]()
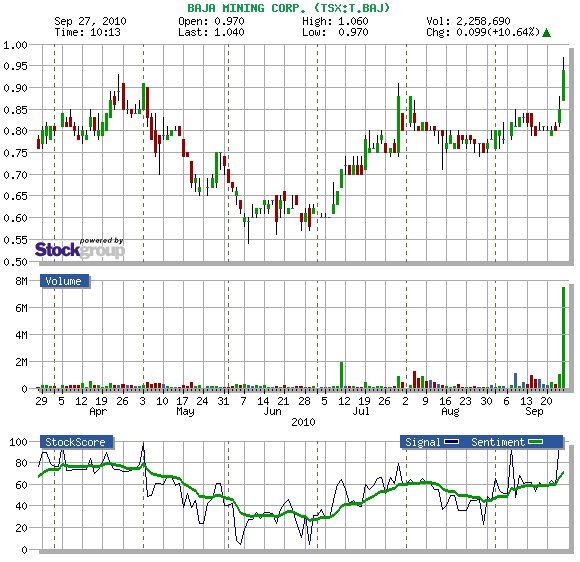
1. T.BAJ
T.BAJ broke to new multi-year highs on Friday with strong volume out of an ascending triangle pattern. Support is at $0.79 and Friday’s close at $0.94 gives this trade $0.15 a share in risk. The five year weekly chart shows the next area of major resistance to be $1.60, giving about $0.65 of upside for $0.15 of downside, making this a trade worth considering.
References
Get the Stockscore on any of over 20,000 North American stocks.
Background on the theories used by Stockscores.
Strategies that can help you find new opportunities.
Scan the market using extensive filter criteria.
Build a portfolio of stocks and view a slide show of their charts.
See which sectors are leading the market, and their components.
Click HERE for the Speaker Lineup and to Purchase the video if you want to learn from some of the worlds best traders including Tyler Bollhorn.

Tyler Bollhorn started trading the stock market with $3,000 in capital, some borrowed from his credit card, when he was just 19 years old. As he worked through the Business program at the University of Calgary, he constantly followed the market and traded stocks. Upon graduation, he could not shake his addiction to the market, and so he continued to trade and study the market by day, while working as a DJ at night. From his 600 square foot basement suite that he shared with his brother, Mr. Bollhorn pursued his dream of making his living buying and selling stocks.
Slowly, he began to learn how the market works, and more importantly, how to consistently make money from it. He realized that the stock market is not fair, and that a small group of people make most of the money while the general public suffers. Eventually, he found some of the key ingredients to success, and turned $30,000 in to half a million dollars in only 3 months. His career as a stock trader had finally flourished.
Much of Mr Bollhorn’s work was pioneering, so he had to create his own tools to identify opportunities. With a vision of making the research process simpler and more effective, he created the Stockscores Approach to trading, and partnered with Stockgroup in the creation of the Stockscores.com web site. He found that he enjoyed teaching others how the market works almost as much as trading it, and he has since taught hundreds of traders how to apply the Stockscores Approach to the market.
Disclaimer
This is not an investment advisory, and should not be used to make investment decisions. Information in Stockscores Perspectives is often opinionated and should be considered for information purposes only. No stock exchange anywhere has approved or disapproved of the information contained herein. There is no express or implied solicitation to buy or sell securities. The writers and editors of Perspectives may have positions in the stocks discussed above and may trade in the stocks mentioned. Don’t consider buying or selling any stock without conducting your own due diligence.
SP500 Internals, Dollar & Gold Pre-Week Analysis
After a fierce equities rally on Friday, which I figured would happen, just not that strong; I have to wonder if there is some event or major decision in the works we don’t know about?
Friday’s rally could be something simpler like window dressing by the funds. This is when the funds buy up all the top performing stocks for month end reporting. They do this so that their investors think they are on the ball and know what they are doing. Window dressing will end Monday and from there we could see some profit taking (selling) start. But for all we know Obama could be extending the tax cuts for everyone or cutting payroll taxes etc…
It would only take one of these events to trigger a sharp up move in the market and that could be what Friday’s move was anticipating. That being said volume has remained light and during low volume session the market has a tendency to move higher. Sell offs in the market require strong volume to pull the market down, so until volume picks up there could still be higher prices just around the corner.
Let’s take a look at some charts…
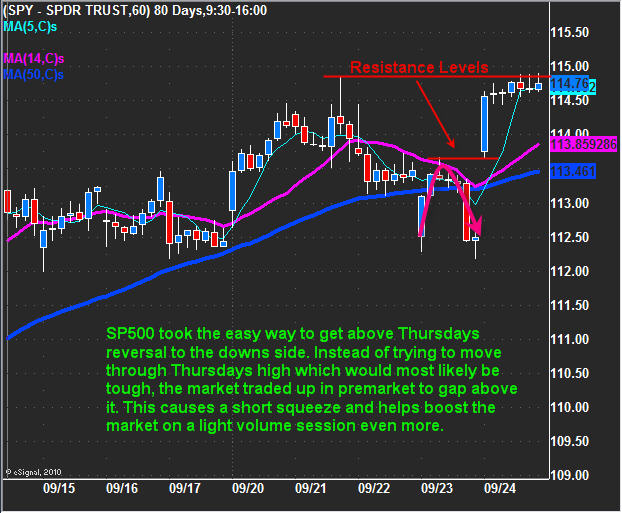
SPY – SP500 60 Minute Intraday Chart
Last week we saw the market reverse to the down side with a strong end of say sell off. That set the tone for some follow through selling and for any bounces to be sold into. That being said, the market always has a way of surprising traders and it did just that on Friday gapping above Thursday’s reversal high causing shorts to cover and the typical end of week light volume drift to help hold prices up.
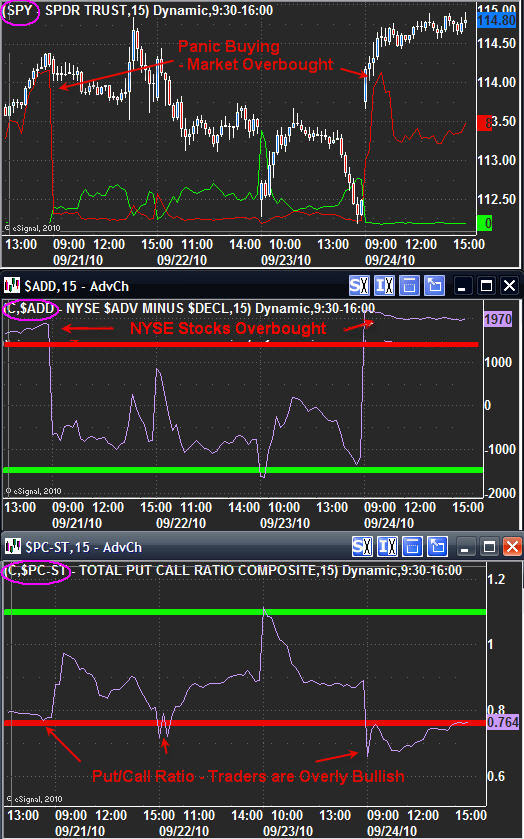
NYSE Market Internals – 15 Minute Chart
I like to follow some market internals to help understand if investors are becoming fearful or greedy. It also helps me gauge if the market is over bought or oversold on any given day.
These three charts below show some interesting data.
Top Chart – This indicator shows me if the majority of shares traded are bought or sold. When the red line spikes up and trades above 5 then I know the majority of traders are buying over covering their shorts. I call this panic buying because traders are buying in fear that the market will continue higher and they will miss the train. When everyone is buying you know a pullback is most likely to occur.
Middle Chart – This is the NYSE advance/decline line. When this indicator is below -1500 then the market is over sold and bottom pickers/value buyers will step in and nibble at stocks. But when this indicator is trading over 1500 then you know the market is overbought and there should be some profit taking starting any time soon.
Bottom Chart – This is the put/call ratio and this tells us how many people are buying calls vs put options. When this indicator is below 0.80 level more traders are bullish and buying leverage. My theory is if they are buying leverage for higher prices, then they have already bought all their stocks and now want to add some leverage for more profits. When I see the majority of traders bullish then I an sure to tighten my stops (if long) as top my be forming.
Putting the charts together – When each of these charts are trading in the red zone know I must be cautious for any long positions because the market just may be starting to top. Or a short term correction may occur.
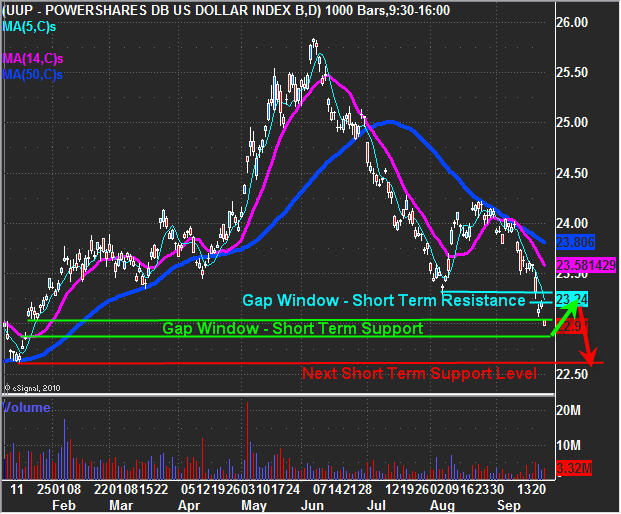
UUP – US Dollar Daily Chart
The US dollar has been under some serious pressure with all the talk about quantitative easing (printing money). Obviously the more the Fed’s print the less value the dollar will have. The chart below shows a green gap window which I think once it is filled should put the dollar in a oversold condition for a short term swing trade bounce before heading back down. A bounce in the dollar will put pressure on equities, gold and oil.
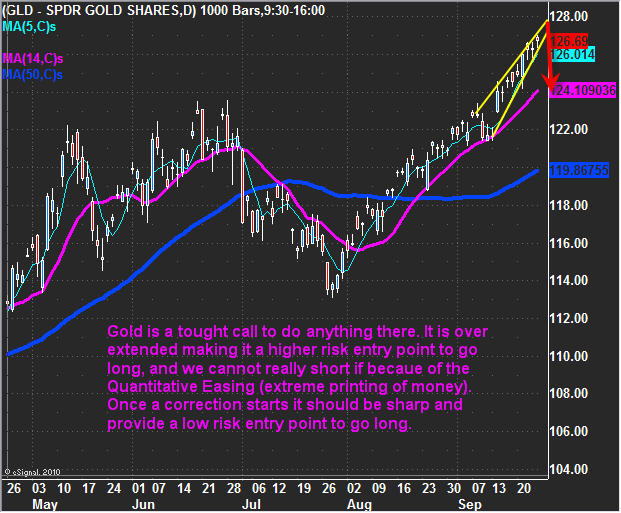
GLD – Gold Daily Chart
Gold continues to grind its way up. This move is looking very long in the teeth and pullback will most likely be sharp.
Weekend Trading Conclusion:
In short, equities and gold continue to grind their way higher while the US dollar continues its grind lower. When I say the market is grinding I am implying the market is over extended and a reversal any day should occur.
Financial stocks like Goldman (GS) which typically leads the market has been strongly underperforming over the past week. Insiders were selling GS very strongly which is strange and makes me wonder what’s up there? With the financial stocks underperforming it sure looks like a market reversal is just around the corner.
If Friday’s rally was simply window dressing by the funds then it should end on Monday and with any luck we will see a sharp reversal to the down side early this week.
You can get my ETF and Commodity Trading Signals if you become a subscriber of my newsletter. These free reports will continue to come on a weekly basis; however, instead of covering 3-5 investments at a time, I’ll be covering only 1. Newsletter subscribers will be getting more analysis that’s actionable. I’ve also decided to add video analysis as it allows me toe get more into across to you quicker and is more educational, and I’ll be covering more of the market to include currencies, bonds and sectors. Before everyone’s emails were answered personally, but now my focus is on building a strong group of traders and they will receive direct personal responses regarding trade ideas and analysis going forward.
Let the volatility and volume return!
Chris Vermeulen
www.TheGoldAndOilGuy.com
Get More Free Reports and Trade Ideas Here for Free: FREE SIGN-UP
A precious metals note today, in honor of gold breaking $1,300/oz (briefly) this morning.
Some of the buying that’s propelled gold lately is from investors who want to hold metal as currency. Having something tangible in your pocket provides insurance if another financial catastrophe descends on the world.
JP Morgan recognizes this demand. On Wednesday, JPM announced it will open its first precious metals storage vault in Asia.
The facility will be located in Singapore, near Changi Airport (just in case you want to grab your gold and fly). The stated goal is to provide precious metals storage for “corporate, institutional and retail” clients.
Some of the people using this facility will be investors from outside Asia, looking to geographically diversify their gold holdings. Many investors are leery of keeping all their gold in one basket, just in case governments get confiscatory.
Perhaps more interestingly, the new facility will allow local Asian investors to get more involved in owning physical metal. Recently, the Singapore Mercantile Exchange announced the launch of a physically-settled gold contract that will be delivered at the JP Morgan vault.
But will gold be the number one choice in Singapore? Asia has always been a little different when it comes to precious metals. Many Asians prefer platinum as “catastrophe insurance”.
Look at Japan. On the Tokyo Commodity Exchange (TOCOM), open interest in gold amounts to 3.5 million ounces. Or about 5% of the 60 million ounces in open interest seen on the NYMEX exchange in New York.
With platinum, Japan’s percentage of global trade is much higher. Open platinum interest on TOCOM is 840,000 ounces. This is 45% of the NYMEX open interest in platinum, which currently stands at 1.9 million ounces.
As options like the new JP Morgan Singapore vault come available to Asian investors, it will be interesting to see what metal they choose. If they follow the Japanese example, this could become an important new source of demand for both platinum and gold.
Here’s to the other precious metal,
Dave Forest
dforest@piercepoints.com
To subscribe to Pierce Points please click here: www.piercepoints.com
Pierce Points mailing address:
Suite 627
#105 150 Crowfoot Cr. NW
Calgary, Alberta
T3G 3T2
Bio: Dave Forest’s analysis on the natural resources sector has been featured on BNN, Kitco.com, Financial Sense and the Daily Reckoning. He has been a recent speaker at conferences in Calgary, Chicago, Las Vegas, Toronto and Vancouver. He is a professional geologist and formerly advised a worldwide client base on oil/gas, mining and renewable energy at Casey Research LLC. Dave currently serves as managing director of Notela Resource Advisors Ltd.
Note:
The information provided in this newsletter is based on the independent research of Dave Forest and Notela Resource Advisors Ltd. and is intended solely for informative purposes and is not to be construed, under any circumstances, by implication or otherwise, as an offer to sell or a solicitation to buy or trade any securities or commodities named herein. Information contained in this newsletter is obtained from sources believed to be reliable, but is in no way assured. All materials and related graphics provided in this newsletter and any other materials which are referenced herein are provided “as is” without warranty of any kind, either express or implied. No assurance of any kind is implied or possible where projections of future conditions are attempted. Readers using the information contained herein are solely responsible for verifying the accuracy thereof and for their own actions and investment decisions. Neither Dave Forest nor Notela Resource Advisors Ltd., make any representations about the suitability of the information delivered in this newsletter or any other materials that are referenced herein for any purpose whatsoever. The information contained in this newsletter does not constitute investment advice and neither Dave Forest nor Notela Resource Advisors Ltd. are registered with any securities regulatory authority to provide investment advice. Readers are cautioned to consult with a qualified registered securities adviser prior to making any investment decisions. The information contained in this newsletter has not been reviewed or authorized by any of the companies mentioned herein.
-
I know Mike is a very solid investor and respect his opinions very much. So if he says pay attention to this or that - I will.
~ Dale G.
-
I've started managing my own investments so view Michael's site as a one-stop shop from which to get information and perspectives.
~ Dave E.
-
Michael offers easy reading, honest, common sense information that anyone can use in a practical manner.
~ der_al.
-
A sane voice in a scrambled investment world.
~ Ed R.
Inside Edge Pro Contributors

Greg Weldon

Josef Schachter

Tyler Bollhorn

Ryan Irvine

Paul Beattie

Martin Straith

Patrick Ceresna

Mark Leibovit

James Thorne

Victor Adair