
Timing & trends
“Sentiment against gold is so bearish that I thought gold could have struck a capitulation low last week.” – Comment extracted from the writing below by the legendary 89 year old Richard Russell. Russell has been writing about markets for 60 years. He has lived through depressions and booms, through good times and bad, through war and peace. He was educated at Rutgers and received his BA at NYU. Russell flew as a combat bombardier on B-25 Mitchell Bombers with the 12th Air Force during World War II.and is widely known as the Godfather of Newsletter writers. Since the advent of the internet he has written daily and delivers his subscribers an extraordinary value for the market experience that they get and the pittance that he charges (for Trial see below). Russell’s stunning comment below:
“Friday ended with a late sell-off in the Dow, and some fireworks in the gold area. The real gold action was in the mining shares, which, because they are highly leveraged, tend to lead the actual price of gold bullion.
It’s notable that nobody talks or writes any more about the price movement in the market. 99% of everything written about the market has to do with the news and how it might affect the market. As a result, I feel all alone in writing about the action of the stock averages, and its implications.
For instance, I’ve described the “box” or the trading range that we now find the Dow in. What are the implications of a Dow break out above or below the trading range? In the meantime, what are the Transports and the A-D line doing? I search Barron’s for a column or even a paragraph on the price action but not a word. It’s all endless conjectures regarding what the Fed may or may not do.
When I first started Dow Theory Letters in 1958, technical analysis was unknown, and most market people called technical analysis “voodoo.” I feel as though I’m back in 1958 again.
………………………………….
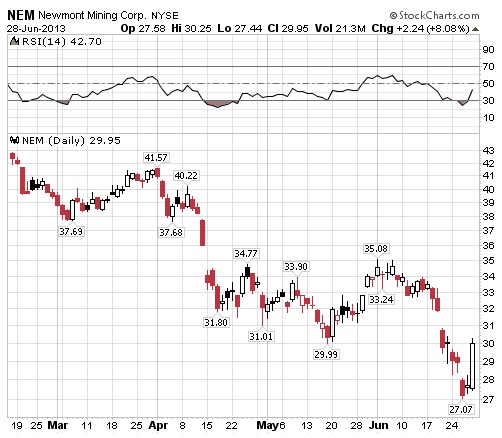
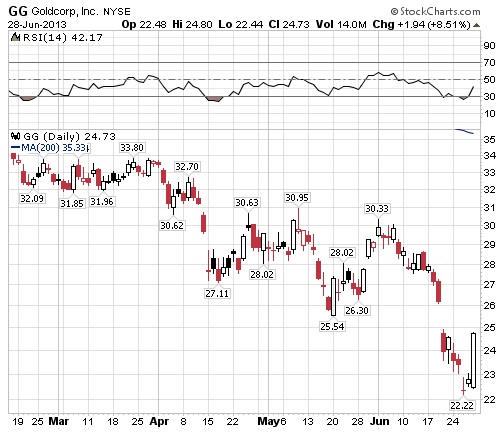
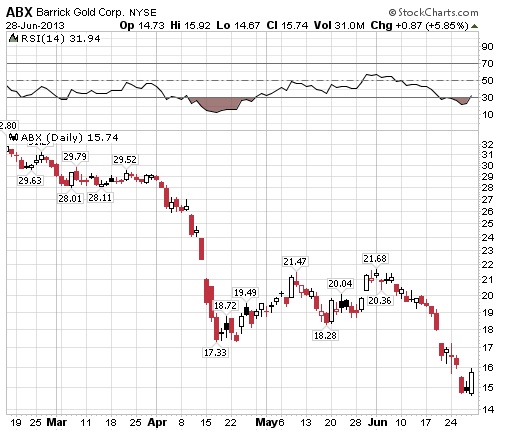
Next, I want to talk about another forbidden and hated subject — gold and gold miners (my, how gold is despised these days).
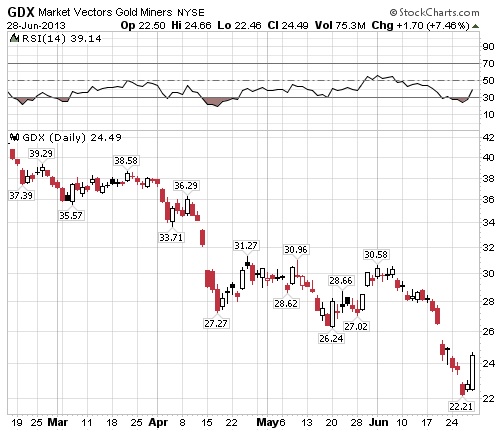
I am going to show charts of some representative gold miners, and you’ll notice that RSI (relative strength) is, or was, in almost all cases below 30 which puts them in the oversold area. And note the bullish action of last Friday, which almost nobody has commented on.

Below, the ARCA “gold bugs” Index
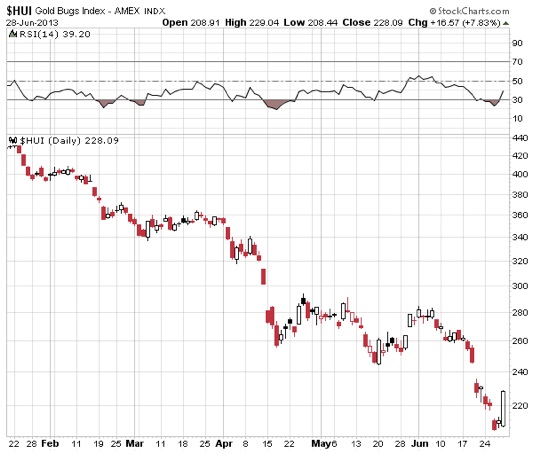
The AMEX gold miners index
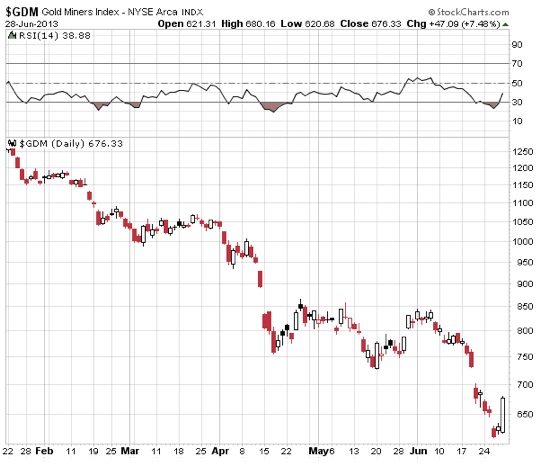
What’s significant is that all these gold items saw RSI in the oversold (below 30) area, and all surged higher on Friday. Also, anti-precious metals sentiment was so black-bearish last week that I thought, along with RSI below 30, that we might, at last, have struck a true bottom in the precious metals. Of course, it’s always possible that after Friday’s explosion, the gold miners may back off this week and test last week’s lows.
I thought it significant that when gold was declining, there was no end of publicity about the “dreadful action” of gold. But when the gold miners surged on Friday — not a word appeared about the bullish action of gold and the gold miners, NOT a word!
If true, that gold has seen its lows, then adventurous subscribers might buy some out-of-the money gold calls. If gold and silver head higher, you’ll make money with the calls, and all you can lose is the original price of the calls you buy. Check with your broker.
………………………………….
Gold was up 32.00 to 1255.70 (on Monday) and the whole gold universe closed higher. Gold is so hated that it could rally over $1500, and nobody would notice it. Sentiment against gold is so bearish that I thought gold could have struck a capitulation low last week. Another bearish piece in today’s issue of USA Today. Talk about rising on a stairway of hatred, you’re seeing it now in gold!”
Richard Russell’s Dow Theory Letters, which he publishes daily for a small annual fee can be subscribed too HERE.
About Richard Russell
Russell began publishing Dow Theory Letters in 1958, and he has been writing the Letters ever since (never once having skipped a Letter). Dow Theory Letters is the oldest service continuously written by one person in the business.
Russell gained wide recognition via a series of over 30 Dow Theory and technical articles that he wrote for Barron’s during the late-’50s through the ’90s. Through Barron’s and via word of mouth, he gained a wide following. Russell was the first (in 1960) to recommend gold stocks. He called the top of the 1949-’66 bull market. And almost to the day he called the bottom of the great 1972-’74 bear market, and the beginning of the great bull market which started in December 1974.
The Letters, published every three weeks, cover the US stock market, foreign markets, bonds, precious metals, commodities, economics –plus Russell’s widely-followed comments and observations and stock market philosophy.
In 1989 Russell took over Julian Snyder’s well-known advisory service, “International Moneyline”, a service which Mr. Synder ran from Switzerland. Then, in 1998 Russell took over the Zweig Forecast from famed market analyst, Martin Zweig. Russell has written articles and been quoted in such publications as Bloomberg magazine, Barron’s, Time, Newsweek, Money Magazine, the Wall Street Journal, the New York Times, Reuters, and others. Subscribers to Dow Theory Letters number over 12,000, hailing from all 50 states and dozens of overseas counties.
A native New Yorker (born in 1924) Russell has lived through depressions and booms, through good times and bad, through war and peace. He was educated at Rutgers and received his BA at NYU. Russell flew as a combat bombardier on B-25 Mitchell Bombers with the 12th Air Force during World War II.
One of the favorite features of the Letter is Russell’s daily Primary Trend Index (PTI), which is a proprietary index which has been included in the Letters since 1971. The PTI has been an amazingly accurate and useful guide to the trend of the market, and it often actually differs with Russell’s opinions. But Russell always defers to his PTI. Says Russell, “The PTI is a lot smarter than I am. It’s a great ego-deflator, as far as I’m concerned, and I’ve learned never to fight it.”
Letters are published and mailed every three weeks. We offer a TRIAL (two consecutive up-to-date issues) for $1.00 (same price that was originally charged in 1958). Trials, please one time only. Mail your $1.00 check to: Dow Theory Letters, PO Box 1759, La Jolla, CA 92038 (annual cost of a subscription is $300, tax deductible if ordered through your business).
IMPORTANT: As an added plus for subscribers, the latest Primary Trend Index (PTI) figure for the day will be posted on our web site — posting will take place a few hours after the close of the market. Also included will be Russell’s comments and observations on the day’s action along with critical market data. Each subscriber will be issued a private user name and password for entrance to the members area of the website.
Investors Intelligence is the organization that monitors almost ALL market letters and then releases their widely-followed “percentage of bullish or bearish advisory services.” This is what Investors Intelligence says about Richard Russell’s Dow Theory Letters: “Richard Russell is by far the most interesting writer of all the services we get.” Feb. 19, 1999.
Below are two of the most widely read articles published by Dow Theory Letters over the past 40 years. Request for these pieces have been received from dozens of organizations. Click on the titles to read the articles.

This report focuses on the positioning of the largest, best funded and presumably the best informed traders of gold futures – the traders classed by the CFTC as “commercial.”
Commercial traders include producers, processors, refiners, bullion merchants, jewelry manufacturers, physical bullion management firms, mercenary swap dealers, etc., and the bullion-trading banks many of them end up trading through on the COMEX bourse. Commercials are the people involved in the gold trade who predominantly use futures to hedge their price risk.
As of this June 28 report (data as of Tuesday, June 25), the commercial hedgers had their least net short (least number of net hedges) for gold as a percentage of the total COMEX open interest (9%) since December, 2001, which coincidentally was the last time commercial traders as a group were net long gold futures. Gold changed hands for $270 the ounce back then, by the way. So one might conclude that with gold in the $1270s last Tuesday, the combined commercial traders of gold futures’ expectations that the gold price would fall further than it already has is equivalent to when gold was trading in the $270s (not a misprint), three months after the 9-11 terrorist attacks in New York, Washington D.C. and Pennsylvania.
That is to say that the commercials are not positioning for further gold weakness if their net futures positioning is any guide. Much more in the video embedded below for convenience.
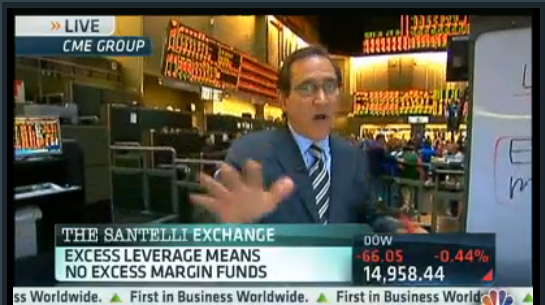 click on image or HERE to listen to Santellii’s comments on leverages and outflows.
Transcript: (Ed Note the 3 min video is superior to the transcript)
Courtney, thanks. Let’s go from the New York Stock exchange to the Santelli Exchange. over to you, Rick.
Listen, i have to continue to talk about the deleveraging because it is the topic du jour. even with the big Blackhawk celebration, a lot of the talk continues to be exactly what happened, why did it happen, when it happened, how important was that?
In order to try to pick or help you viewers or listeners get an idea where interest rates may go, where equities may go, where leverage may go or not go ever again, we have to understand what happened. and let’s start in a very simple place, leverage. i’ll tell you why this is so fascinating a conversation i had with a couple of my sources yesterday. That in the world of hyperleverage, there isn’t going to be any money left for excess margin. In other words, it’s counterintuitive that the trading community, investors, funds, have a certain amount of leverage on and it’s not the same everywhere but it’s still rather large. What is excess margin?Excess margin means you have some money laying around,whether it’s your Gold position, Bond position, S&P, or ETF, whatever it is, that when the position starts to work against you and you need to pony up more money, where does that money come from?
That is at the epicenter, in a simple way, of what may have been the catalyst for much of what we’ve seen.
Now, i know you always hear me talking about the Fed, the FOMC, Ben Bernanke and that the markets still have their moments of power, but i do have to say the other big conversation the last 24 hours is no matter what you think about all of those topics, that Ben just happened to be the guy that we all identified, everybody seems to identify with being the culprit. Somehow as to the catalyst. I’m not so sure that’s true. i think in leverage, no excess funds, things have a way to work in reverse in an aggressive fashion but it’s even more interesting.everybody wants to talk about the great rotation. Now, you could go to CNBC, they will have a boat load of stories about the exact numbers. i’m going to round out. There’s been basically record outflows for the last month or so in the bond world, just the last week it’s been rather large. You could break it down into taxable, non-taxable, municipals, whatever. But here is the key, equities and equity etfs are also seeing outflows. This really needs to be thought through. as much as everybody wants that to be true, it doesn’t seem to be true, and this has to figure in because you could be the biggest bond guy in the world and you can see all the flows, but in the end the real key is the inflows and that’s what we’re not seeing there. Back to you.
Well put, rick. Very well put on a week where we’re watching flows carefully, thanks a lot.
Stocks managed their third session higher as of Thursday June 27th and its too late to jump onto that move. Major indexes and leading stocks have rebounded into resistance along with a few key moving averages. The next 1-3 days favor a pause or pullback at the least simply because of the selling momentum and multiple resistance levels being tested. It is only natural for traders and investors to pull some money off the table or short at these levels.
Stepping back seven days and looking at the overall stock market we have seen a substantial drop in prices across the board. A Ton of stocks have formed their first impulse thrust to the downside which is typically what happens when a stock market is in a topping process (Stage 3 Distribution). The type of damage we had cannot be fixed overnight. This will be a process if it is to resolve to the upside and price action will remain wild (volatile).
Major Points to Be Aware Of:
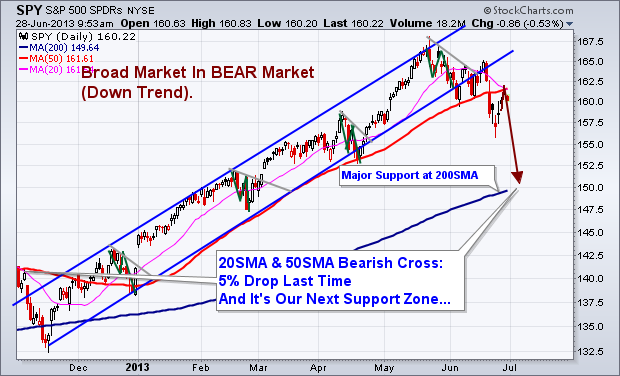
1. 20 Simple Moving Average is crossing below the 50SMA. Last time this took place it triggered a 5% drop in the SP500.
2. Price has bounced for three consecutive days. This typically puts the odds in favor for a pullback.
3. Price bounced and hit it’s head on the 20 and 50 moving averages on Thursday (RESISTANCE).
4. Market Time Cycles are in a decline phase meaning there will be a negative bias and seller will be actively pulling price lower on bounces.
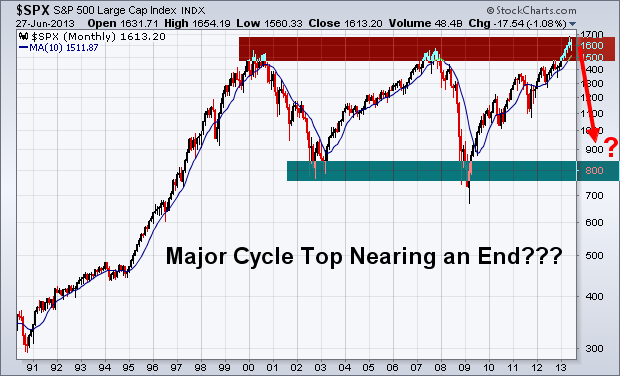
5. Major Long Term Chart looks favorable for a bear market to start which may last 12 months. If so this is just the beginning of some scary yet highly profitable potential trades in the coming year. Stocks fall 3-7 times faster than they rise…
Daily SP500 Trend & Analysis Chart:
Long Term SP500 Trend Chart:
BEARISH SP500 Price & Volume – 60 Minute Intraday Chart:
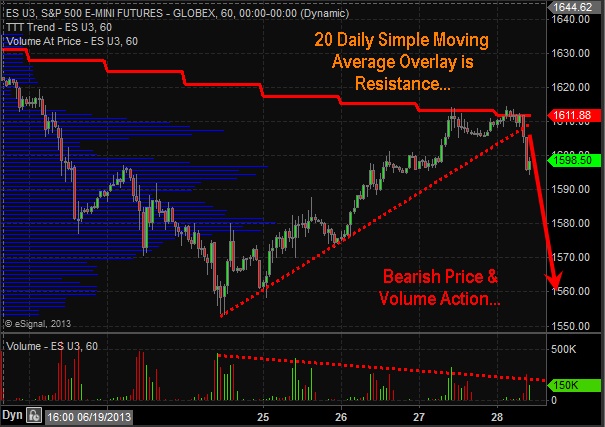
Looking at these charts from a long term, intermediate and short term basis the odds are favoring lower prices. Being short stocks or buying inverse ETF’s is the current play for the market. But analysis and trends are subject to change depending on price and volume action each week. Do not get your heart set on the BIG picture outlook of a yearlong selloff. That could prove to be dangerous. We take this market one bar or candlestick at a time and trade based on current short term analysis.
Get My Trade Alerts & Pre-Market Video Analysis Every Day: www.GoldAndOilGuy.com
Chris Vermeulen
The new edition of the “In GOLD We TRUST” report is out. In his 7th report precious metals analyst Ronald Stoeferle takes an holistic view on the latest developments in the gold market. Mr. Stoeferle has set up his own gold fund recently at Incrementum Liechtenstein AG.
This edition of the report is characterized by a focus on the monetary aspect(s) of gold, a subject which remains highly underexposed in almost every report of major financial institutions. Because of the unprecedented global monetary policy experiments the need for monetary insurance has never been greater. The consensus could be convinced that the gold bull market has ended but In GOLD we Trust 2013 points to the fundamental arguments why the gold bull market remains intact.
Furthermore, this edition is the first which contains a quantitative model of the gold price. The model justifies a considerable risk premium to current price levels, even if small probabilities of occurrence of extreme scenarios are modeled. Based on conservative assumptions, the long-term price target is $2,230.
……read report and view charts HERE

-
I know Mike is a very solid investor and respect his opinions very much. So if he says pay attention to this or that - I will.
~ Dale G.
-
I've started managing my own investments so view Michael's site as a one-stop shop from which to get information and perspectives.
~ Dave E.
-
Michael offers easy reading, honest, common sense information that anyone can use in a practical manner.
~ der_al.
-
A sane voice in a scrambled investment world.
~ Ed R.
Inside Edge Pro Contributors

Greg Weldon

Josef Schachter

Tyler Bollhorn

Ryan Irvine

Paul Beattie

Martin Straith

Patrick Ceresna

Mark Leibovit

James Thorne

Victor Adair