
Timing & trends
Dennis Gartman is the man behind The Gartman Letter, a daily newsletter discussing global capital markets. For more than 20 years, The Gartman Letter has tackled the political, economic and social trends shaping the world’s markets, and Gartman himself is a frequent guest on CNBC, Bloomberg and other financial media outlets. HardAssetsInvestor Managing Editor Sumit Roy recently caught up with Gartman to discuss the latest outlook on financial markets and commodities, including gold and oil.
Dennis Gartman: Technicals Say Gold Could Hit $900
HardAssetsInvestor: What do you think about the recent concerns in the U.S. regarding the Fed potentially winding down QE later this year, and the consequent spike in long-term interest rates?
Dennis Gartman: The economy absolutely can continue to grow with somewhat tighter monetary conditions. In fact, I think the economy can grow a lot better without the Fed’s help. The Fed’s help back in 2008 was to be lauded; it was fantastic. They did exactly the right thing. In 2009 and ’10, the first rounds of QE were probably still to be lauded. They probably did the right thing; however, they overstayed their welcome. They’ve created a bit of confusion. And confusion breeds contempt, as I like to say.
The Fed understands it has to get itself out of the box that it has put itself in. The way to do that is slowly, over time. I find it amusing that people are already responding as if the Fed has already begun to tighten. We have to remember, the Fed is going to continuously add reserves to the system until middle of 2014. It will just be that they are adding at a lesser pace. It’s not as if they have taken anything out of the system. I think the markets have overreacted.
…..read the whole interview HERE

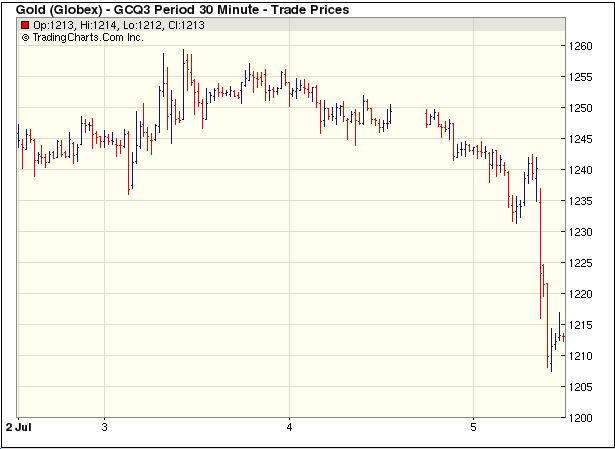
“I think this is very much a calm before the storm … the U.S. is out today and the focus is all on non-farm payrolls tomorrow, which I think is potentially the storm – if the data comes in line with expectation there may be more selling for gold” – Quote from the article below, published before the Unemployment number came out
Gold’s Price Moves from the European Perspective
by Przemyslaw Radomski – Sunshine Profits
Despite the lack of trading activity in the United States due to the Independence Day celebrations, yesterday’s session in Europe was very interesting. The players on the foreign exchange market have provided plenty of thrills. Without a doubt, the ECB President’s announcement was fuel for further dynamic declines in the euro. Draghi said the bank expected its key interest rates to remain at current or lower levels for an extended period. The ECB left its main interest rates unchanged as expected at record lows of 0.5 percent. Market reaction was swift and pronounced. The European currencydropped to a five-week low against the dollar.
Another important event was the statement by the Bank of England, which signaled that it won’t be raising interest rates anytime soon, lifting the FTSE 100 and putting big pressure on the British pound which fell 1.2%.
“I think this is very much a calm before the storm … the U.S. is out today and the focus is all on non-farm payrolls tomorrow, which I think is potentially the storm – if the data comes in line with expectation there may be more selling for gold,” Jonathan Butler, precious metals strategist at Mitsubishi, added.
According to Reuters, Friday’s U.S. non-farm payrolls report is expected to show the economy created 165,000 jobs last month. The data could affect when the Federal Reserve will begin tapering off its $85 billion monthly bond-buying stimulus program.
Gold posted its biggest quarterly loss on record in the April-June period, down 23 percent. Selling was exacerbated by comments from the Fed Chairman Ben Bernanke last month that the U.S. economy was recovering strongly enough for the central bank to begin pulling back on its stimulus in the next few months.
This would support a rise in interest rates, making gold less attractive.
Since we know the important news from Europe and the economic calendar, let’s summarize gold’s current situation. The yellow metal has increased since hitting its lowest price in almost three years at $1,180 last Friday, but many traders view those gains as a typical short-term rally that follows a significant decline. Is that true? Will we see a further decline? Let’s take a look at the charts and try to find the answers. At the beginning let’s take a look at the long-term gold chart and check the current situation in gold (click on chart for larger image)

In this week’s very long-term gold chart, we see that prices moved close to the lower border of the declining trend channel. This price level was not quite reached, but gold’s price is very close to it, and it seems that prices will decline once again. Gold has been trading sideways below an important resistance line, the first Fibonacci retracement level, verifying this breakdown. With a verified breakdown and the declining trend channel in place, we have a bearish outlook at this time.
Gold could initially decline to the lower border of the trend channel and if it does, a pullback will likely follow. However, since the support line is declining, the support is currently lower than last week – at about $1,150. The strongest support is seen slightly below the $1,100 level where two major support lines intersect.
Therefore, from this perspective, the situation remains bearish for the short term and it doesn’t look so optimistic. However, if we want to have a more complete picture of the situation, let’s take a look at the chart from the non-USD perspective.
Gold viewed from this perspective showed very little change this week as prices moved higher, then lower, and are within 2% or so of where they were a week ago. No significant support level has been reached, so declines could very well continue here.
As we previously mentioned, yesterday the British pound depreciated strongly against the U.S. dollar which means an increase of the strength of the U.S. dollar. Unfortunately, such a development could have negative consequences for gold. In light of this information, we think that another interesting chart may provide important clues about further price movements is the chart of gold from the perspective of the British pound.
Gold priced in British pounds reveals a recent double breakdown. This is a breakdown below two important support levels, in this case the rising long-term support line and the first Fibonacci retracement level on the full bull market.
This is an important breakdown and, at this time, the next significant support line is slightly below the 7 level in this chart. Clearly another significant decline could be seen here. This is similar to what we saw last week when gold moved lower, and we could see a similar move once again later on in the month.
Since we are already in Europe, we think that we can’t forget to take a look at the current situation of the European currency. Thus, to make the European perspective complete let’s see what has changed recently in the Euro Index chart.
In this week’s Euro Index chart, we see that the head-and-shoulders pattern remains in place. The Euro declined once again this week, and it seems to be completing the pattern. The chances for this formation to be invalidated are growing increasingly slim. If the European currency continues to decline and the formation is indeed completed, this may lead to further strength in the U.S. dollar and medium-term weakness in precious metals. From this point of view, this chart is still bearish.
Summing up, gold pulled back this week but the move to the upside did not invalidate the most important resistance levels. From the European point of view, the outlook and trend remain bearish for the short term. The immediate-term could see some strength, but with support lines relatively far away, the next big move will likely be to the downside.
Please note that these are very volatile times for gold investors and the situation may quickly change (become bullish) if we see strong moves up in the USD Index without a meaningful decline in gold and bearish indications from other markets.
Thank you for reading. Have a great and profitable week!
Przemyslaw Radomski, CFA
Founder, Editor-in-chief
Gold Investment & Silver Investment Website – SunshineProfits.com
* * * * *
Disclaimer
All essays, research and information found above represent analyses and opinions of Przemyslaw Radomski, CFA and Sunshine Profits’ associates only. As such, it may prove wrong and be a subject to change without notice. Opinions and analyses were based on data available to authors of respective essays at the time of writing. Although the information provided above is based on careful research and sources that are believed to be accurate, Przemyslaw Radomski, CFA and his associates do not guarantee the accuracy or thoroughness of the data or information reported. The opinions published above are neither an offer nor a recommendation to purchase or sell any securities. Mr. Radomski is not a Registered Securities Advisor. By reading Przemyslaw Radomski’s, CFA reports you fully agree that he will not be held responsible or liable for any decisions you make regarding any information provided in these reports. Investing, trading and speculation in any financial markets may involve high risk of loss. Przemyslaw Radomski, CFA, Sunshine Profits’ employees and affiliates as well as members of their families may have a short or long position in any securities, including those mentioned in any of the reports or essays, and may make additional purchases and/or sales of those securities without notice.
Produced by McIver Wealth Management Consulting Group
Mark Jasayko, CFA,MBA, Portfolio Manager with McIver Wealth Management of Richardson GMP in Vancouver.

 While most retail financial advisors today are counselling clients to remain fully allocated to risk markets near 6 year highs (they always do, at least until after big losses hit and then they will suggest some switching around) institutional managers, traditionally dubbed the “smart money” have become highly risk averse. See more here: Europe’s biggest asset manager favors cash
“Amundi, Europe’s biggest asset manager with almost $1 trillion of funds, said it increased cash holdings at the expense of equities and high-yielding bonds because global growth may be weaker than expected next year.
“Forecasters remain too optimistic about global growth for 2014,” Didier Borowski, head of strategy and economic research at Amundi, said in an interview in Geneva last week. “We have to be very cautious on risky assets in the short term.”
Amundi, which mainly invests on behalf of institutions, said diversified funds have as much as 55 percent of assets in cash as a weaker economic outlook deters riskier investments…
The Stoxx Europe 600 Index fell 8.2 percent since Bernanke spoke, while the MSCI World Index dropped 4.9 percent. Borowski said stocks may decline further if companies and analysts revise down their earnings expectations on weaker-than-expected growth in 2014.
The global economy is expected to grow 3 percent in 2014 compared with 2.13 percent this year, according to data compiled by Bloomberg……read more HERE
For the umpteenth time (actually the 3rd since June 2012) silver has given a buy signal according to my reading of the technical indicators.
Problem: How valuable is technical analysis (moving averages, oscillators, over-sold conditions etc.) when the silver and gold markets are dominated by computers (High Frequency Trading – HFT) and not human beings?
…..read more HERE

-
I know Mike is a very solid investor and respect his opinions very much. So if he says pay attention to this or that - I will.
~ Dale G.
-
I've started managing my own investments so view Michael's site as a one-stop shop from which to get information and perspectives.
~ Dave E.
-
Michael offers easy reading, honest, common sense information that anyone can use in a practical manner.
~ der_al.
-
A sane voice in a scrambled investment world.
~ Ed R.
Inside Edge Pro Contributors

Greg Weldon

Josef Schachter

Tyler Bollhorn

Ryan Irvine

Paul Beattie

Martin Straith

Patrick Ceresna

Mark Leibovit

James Thorne

Victor Adair