
Stocks & Equities
The expectation in the United States was for a 185K increase, while the print was 203K. Last month’s was revised modestly lower to 200K(from 204K). The unemployment rate dropped from 7.3% all the way down to only 7.0%.
S&P 500 Futures have shot back above 1800 on the news.
Drew Zimmerman
Investment & Commodities/Futures Advisor
604-664-2842 – Direct
604 664 2900 – Main
604 664 2666 – Fax
800 810 7022 – Toll Free

 Yesterday’s pullback came was blamed on concerns the Fed might taper its asset purchase program as early as this month following some better-than-expected initial claims and Q3 GDP data. The headline print for each certainly aided such thinking. Initial claims for the week ending November 30 checked in at just 298,000 (Briefing.com consensus 330,000) while the second estimate for Q3 GDP jumped to 3.6% (Briefing.com consensus 3.0%) from 2.8%.
The headlines had an undeniably encouraging feel to them. That was the first sub-300,000 print for initial claims since early September and the 3.6% growth in Q3 GDP was the strongest since the second quarter of 2010. Upon closer review, though, the headlines were a little misleading.
The Department of Labor acknowledged that seasonal adjustment problems biased the claims number lower (which means we are likely to see a higher print in subsequent weeks) while the change in private inventories accounted for 1.68 percentage points of Q3 GDP growth. Take the change in inventories out of the equation and real final sales were up just 1.9% versus 2.0% in the first estimate. Furthermore, the 1.4% growth rate in personal consumption expenditures was the lowest rate since the fourth quarter of 2009.
A big jump in inventories and a deceleration in personal spending isn’t exactly a combination befitting a robust growth picture. In that context, the tapering trade in our estimation probably had more to do today with the angst surrounding the November employment report on Friday than it did with a true read of today’s data.
Following the strong ADP Employment Change report on Wednesday, there is a presumption that the nonfarm payrolls number on Friday will also produce a positive surprise. The Briefing.com consensus estimate for nonfarm payrolls is set at 188,000 and at 200,000 for nonfarm private payrolls.
Given the four-day losing streak for the S&P 500, one shouldn’t be surprised if individual investors were a little less bullish this week. After last week’s surge in bullish sentiment, that is exactly what we saw. According to the weekly survey from the American Association of Individual Investors (AAII), bullish sentiment declined from 47.3% down to 42.64%. Perhaps the most surprising aspect of individual investor sentiment over the last few weeks is the fact that even after an eight week winning streak for the S&P 500, AAII’s measurement of bullish sentiment never increased above 50%.
While investors turned a little less bullish this week, they didn’t shift into the bearish camp. As shown in the lower chart, bearish sentiment fell this week as well. After coming in at a level of 28.25% last week, bearish sentiment declined to 27.55% this week. Neutral sentiment, on the other hand, saw an increase of 5.4 percentage points to 29.81%.
Friday’s action is sure to be dictated by the details of the November employment report and the direction long-term interest rates take in its wake.
IN THE NEWS:
———————————————
From Yale Hirsch:
My 1987 Stock Trader’s Almanac was dedicated to THE NEW PROGNOSTICATORS. Mark Leibovit was one of them. I evidently had insight as Timer Digest named Mark the “Number One Market Timer for the 10-year period ending in 2007.” For the 10 years ending 2009, he was #2 intermediate Market Timer. He is also their #1 Gold Market Timer for 2011. This book should be REQUIRED READING for anyone who trades.
——————————————–
Writing a book is an adventure. To begin with it is a toy, an amusement; then it is a mistress, and then a master, and then a tyrant.”
-Winston Churchill (British statesman, 1874-1965)
My book,”The Trader’s Book of Volume” (published by McGraw-Hill) is now available both in English and now CHINESE!
Here is the link to Traders Press:
http://www.invest-store.com/vrtrader/
Here is the link to Amazon.com:
http://tinyurl.com/3wms9q2
——————————————–
Check out the Debt Clock. It is ticking against all of us:
http://www.usdebtclock.org/index.html
VRTrader.com
P.O. Box 12665
Scottsdale, AZ 85267
Phone: 928-282-1275
Fax: 623-243-4174


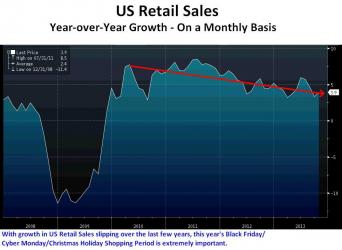
For anyone who still thinks that something other than the U.S. Federal Reserve’s experiment with Quantitative Easing is helping to lift U.S. stocks, the chart above should quickly dispel that.
Since the introduction of QE1 back in later 2008, the growth of the Fed’s balance sheet as a result of QE almost perfectly overlays a chart of the S&P 500.
And, we know that earnings are not driving stocks. U.S. non-financial company earnings have been almost flat for the last two years now. (The largest financial companies have received massive government subsidies, which explains most of their earnings)
Now that U.S. stocks are breaking their recent trend, it will be interesting to see the extent of this correction. If there is enough of a selloff, the graph above will start to exhibit a deviation between the amount of QE and stock prices. That might be an indictment of the lack of effectiveness of QE in putting the U.S. economy back on a long-term growth trajectory and in fixing U.S. unemployment. If the market does lose faith in QE, what will be the Fed’s Plan B?
The opinions expressed in this report are the opinions of the author and readers should not assume they reflect the opinions or recommendations of Richardson GMP Limited or its affiliates. Assumptions, opinions and estimates constitute the author’s judgment as of the date of this material and are subject to change without notice. We do not warrant the completeness or accuracy of this material, and it should not be relied upon as such. Before acting on any recommendation, you should consider whether it is suitable for your particular circumstances and, if necessary, seek professional advice. Past performance is not indicative of future results.
Richardson GMP Limited, Member Canadian Investor Protection Fund.
Richardson is a trade-mark of James Richardson & Sons, Limited. GMP is a registered trade-mark of GMP Securities L.P. Both used under license by Richardson GMP Limited.
It’s hard to be bearish in December.
This is the time of good cheer, dancing sugar plums, and brandy-spiked eggnog. It’s also the time of rising stock markets.
More so than any other month of the year, December has a bullish bias. Going back to 1950, stocks showed gains in December 47 out of 63 years. That’s 74% of the time. If we only go back to 1970, the bulls are 35 for 43 – an 81% win rate.
So like I said, it’s tough to be bearish during this time of year. But it’s also tough to overlook this…
The daily chart of the S&P 500 below shows the index breaking down from a bearish rising-wedge pattern.
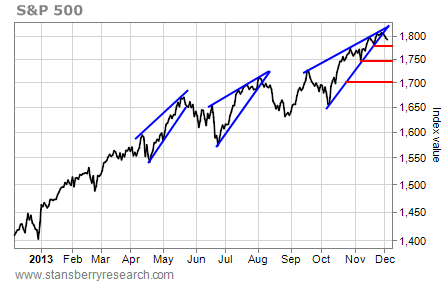
Previous breakdowns in May and August led to modest 6% and 4.4% pullbacks, respectively, over the following month. Something similar this time around would set a target for the index somewhere between 1,740 and 1,700.
Yesterday, the S&P 500 tested its first red support line at about 1,780. After falling for four straight days, stocks are oversold enough that they could bounce from this level over the short term.
However, any bounce that fails to rally the S&P 500 to a new all-time high above 1,813 will form a “lower high” on the chart. That’s a reversal pattern, and it increases the chances the next decline will take out support at 1,780 and spark a move toward one of the lower support lines.
So go ahead and be cheery. Be merry and full of goodwill. And be bullish if you like. But be careful, too. Given the look of this chart, stocks have more downside.
Best regards and good trading,
Jeff Clark
Further Reading:
Earlier this week, Jeff revealed another reason for caution: One specific thing happened within months of every single market peak of the last 41 years. And it might be happening again right now. Get all the details here.
One of the stock market’s most reliable indicators is also pointing to a reversal. “We now have a broad stock market sell signal,” Jeff writes. “And the first sign that at least a short-term top may be in place.” See the chart right here.
(Reuters) – World shares fell for a third day on Wednesday and gold dropped to a five-month low, as focus returned to whether the U.S. Federal Reserve will start to wind down its bond-buying stimulus as soon as this month or next.
The to-and-fro of when the Fed will begin to halt the flow of cheap dollars has dominated trading worldwide for months. A run of data ending in the main U.S. jobs indicator – non-farm payrolls – on Friday may yet tip the balance again.
Polls of analysts and traders still point firmly to the U.S. central bank holding fire until next March but some stronger data has reheated speculation it could move earlier.
That prompted investors to cash in gains from recent rallies, and despite a steadier morning, European stocks .FTEU3 were on the slide again as the Wall Street open neared, after suffering their biggest tumble since August on Tuesday.
A better-than-expected ADP jobs report, which showed U.S. private employers added a chunky 215,000 jobs in November, bolstered the feeling that payrolls on Friday may be strong.
But Johan Jooste, head of fund manager Julius Baer’s London investment office said it wasn’t necessarily the start of the Fed’s withdrawal that would drive the market’s reaction.
“The whole market has been focused on when tapering will start, but what I would ask (incoming Fed chief) Janet Yellen is when does she perceive it ending.
“If the Fed starts in Jan or March I’m not so sure that’s necessarily the big deal, but it’s a bigger deal if it ends it quickly,” Jooste added.
The worry is that the reduction in Fed support will be like a stab with a pin for recently inflated asset prices.
A sharp 2.2 percent fall for the Nikkei in Tokyo .N225 as it recoiled from a six-year high had led Asia lower overnight, and with Europe buckling again MSCI’s world share index extended its losses for the day to 0.5 percent. .MIWD00000PUS
Wall Street had been expected to open slightly higher after Tuesday’s falls but the robust data helped cement a turnaround in futures prices, with the Dow Jones industrial average.DJI the S&P 500 Index .SPX now expected to dip again. .N
In the FX market, the dollar remained lower against the yen and a basket of currencies.DXY but as the data pushed benchmark U.S. Treasury yields back above 2.8 percent, upwards pressure was starting to be felt.
ECB TIME
Ahead of the European Central Bank’s meeting on Thursday, mixed euro zone PMI data reinforced the differing fortunes of its main economies, though having only cut rates last month additional measures from the bank look unlikely for now.
Britain is currently one of Europe’s best performing economies, but high-flying sterling saw its wings clipped as growth in the dominant service sector slowed a little last month, breaking a run of upside data surprises.
The specter of cuts in the Fed’s bond-buying continued to cast a shadow over emerging market shares and currencies. They were among the hardest-hit when Fed Chairman Ben Bernanke first floated the prospect of “tapering” back in May.
MSCI’s emerging market .MSCIEF spent a third day in the red, while the Indonesian rupiah weakened 0.9 percent to 11,975 rupiah per dollar after earlier falling to 12,000 to match a near five-year low touched last week.
William de Vijlder, chief investment officer at BNP Paribas said that while further sell-offs were likely in EM assets, they shouldn’t be as dramatic as earlier in the year.
“We call it ‘tapering echoes’. With each echo you have, the intensity of the noise fades,” he said.
With Ukraine’s under-fire president out of the country, there was a temporary lull in the political tensions that have rattled its markets hard in recent days.
In Thailand were there has also been recent upheaval, the baht also stabilized at around 32.26 baht per dollar after the country’s navy chief ruled out a coup after days of anti-government protests.
AUSSIE, GOLD DOWN
Back in Europe, the euro began to back-pedal from $1.3550 as the dollar flexed its muscles again, having hit a two-month low against the Swiss franc following the euro zone data.
A buoyant Germany was not enough to stop the 17-nation euro zone’s private sector losing momentum in November, dragged backwards by a downturn in France – the bloc’s second biggest economy – and a continued recession in Italy.
Down under, the Australian dollar saw its biggest fall since July as it plunged to a three-month low of $0.9025 after data showed its economy running slower than expected.
Oil prices jumped ahead of this week’s OPEC meeting, with U.S. crude futures hitting a five-week high and Brent holding comfortably above $112 a barrel.
But gold and silver, which like stocks have benefited from the U.S. stimulus because of inflation fears, traded near five-month lows. Gold last stood at $1,213 per ounce while silver traded at $19.04, having slipped to $18.94 on Tuesday.
“There is definitely an attitude of wait-and-see in other assets and more selling pressure in gold,” Mitsubishi analyst Jonathan Butler said. “The next leg down is being awaited and the stimulus for that could be the (U.S. jobs) numbers on Friday.”

-
I know Mike is a very solid investor and respect his opinions very much. So if he says pay attention to this or that - I will.
~ Dale G.
-
I've started managing my own investments so view Michael's site as a one-stop shop from which to get information and perspectives.
~ Dave E.
-
Michael offers easy reading, honest, common sense information that anyone can use in a practical manner.
~ der_al.
-
A sane voice in a scrambled investment world.
~ Ed R.
Inside Edge Pro Contributors

Greg Weldon

Josef Schachter

Tyler Bollhorn

Ryan Irvine

Paul Beattie

Martin Straith

Patrick Ceresna

Mark Leibovit

James Thorne

Victor Adair