
Stocks & Equities
WEEKLY COMMENTARY
Stockscores Market Minutes Video
A strong stock in a strong sector has a greater chance for success. Learn how to use the Stockscores.com Sector Watch tool to focus on the right sectors with this week’s Market Minutes, watch the video on Youtube by clicking here.
There are two risk factors which contribute to a stock’s price performance. First, those factors directly related to the company’s business. Earnings, management, new products or services – these are termed Alpha factors and are what the market is interested in when seeking stocks that can beat the performance of the overall index or sector group.
The second factor is the market itself. All stocks have some correlation to what the overall market is doing because all companies are dependent on the general economy and investor psychology. The Beta factor is what guides most stocks most of the time.
My approach to the market is to focus on abnormal activity. This brings out the Alpha factor which is what allows a stock to beat the performance of the overall market. When stocks are trading abnormally, it is likely that there is something happening with their company fundamentals that deserves attention.
With this in mind, it is still important that respect the Beta factor. A gold miner that discovers Gold will not be rewarded as well as it should if the price of Gold is falling and there is a general sense of pessimism around Gold mining stocks. You have to pay attention to the health of the stock’s sector.
That makes Sector analysis an important part of the research process. You can use Stockscores.com to gauge the strength of a stock’s sector. If you find a stock you like, its investment quality is better if the sector is also strong.
For most large cap stocks, Stockscores will show the sector chart and rating. To see it, first pull up the stock chart by entering the symbol in the upper right of Stockscores.com. Below the large chart or beside the small chart you will see a Sector tab. Click on that to see the chart and Stockscores of the company’s sector. Give favor to the stocks that have a strong sector confirmation.
Want to see the ratings for all of the Sectors? Advanced and Pro Stockscores users can utilize the Sector Watch tool to see the Stockscores ratings for all sectors. Focus on the sectors with a Sentiment Stockscore of 60 or higher.
STRATEGY OF THE WEEK
Here is the scenario. You are a Canadian investor, retired or nearing retirement and looking for stocks that pay a yield but also have some potential for capital appreciation. Here is a scan that will help you find some good candidates:
Exchange = All Canadian
Sentiment Stockscores > 60 < 75
Pays Dividends – Checked
Yield > 2%
I ran this scan and found the following stocks that have good yields and good charts. Keep in mind that the yield amounts quoted are historical and are not guaranteed to be future yield.
STOCKS THAT MEET THE FEATURED STRATEGY
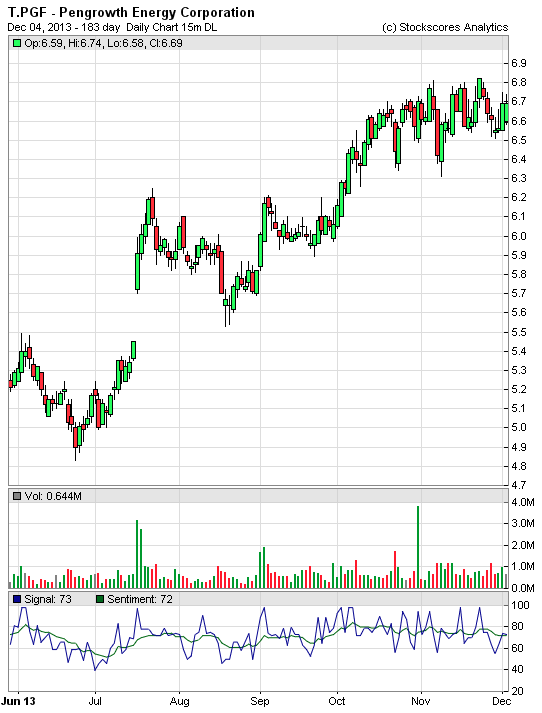
1. T.PGF
T.PGF has been on my feature list since it was at $6, it is now $6.69 and the historical yield is 7.17%. Rising bottoms over the past 7 months show investors are optimistic after a lengthy period of poor performance.
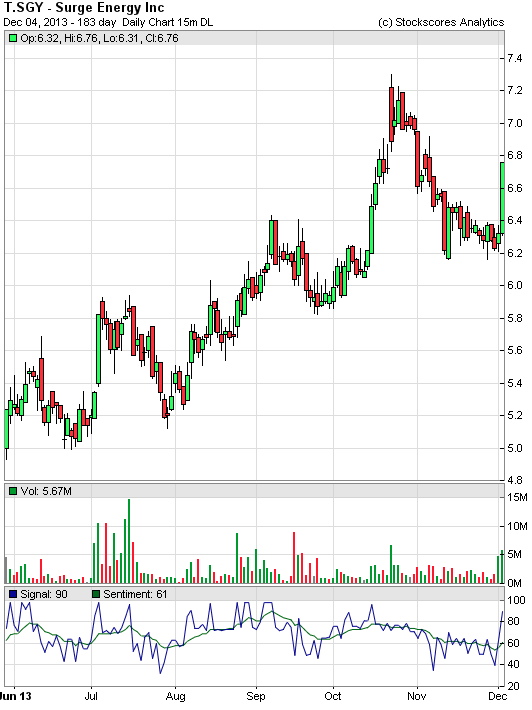
2. T.SGY
After a bad month of November, T.SGY has bounced and broken its pull back, appearing poised to continue the long term upward trend. Historical yield is 7.91%.
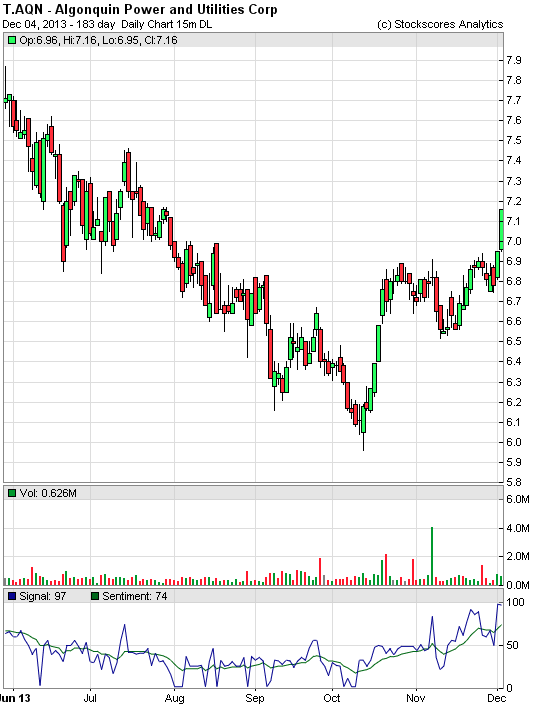
3. T.AQN
T.AQN recently saw its Sentiment Stockscores cross up and over the 60 threshold as it breaks higher from a rising bottom. Historical yield of 4.89%.
References
- Get the Stockscore on any of over 20,000 North American stocks.
- Background on the theories used by Stockscores.
- Strategies that can help you find new opportunities.
- Scan the market using extensive filter criteria.
- Build a portfolio of stocks and view a slide show of their charts.
- See which sectors are leading the market, and their components.
Disclaimer
This is not an investment advisory, and should not be used to make investment decisions. Information in Stockscores Perspectives is often opinionated and should be considered for information purposes only. No stock exchange anywhere has approved or disapproved of the information contained herein. There is no express or implied solicitation to buy or sell securities. The writers and editors of Perspectives may have positions in the stocks discussed above and may trade in the stocks mentioned. Don’t consider buying or selling any stock without conducting your own due diligence.

NEW YORK (MarketWatch) — U.S. stocks fell Tuesday, with the S&P 500 and the Dow Jones Industrial Average falling for a third straight day on uncertainty over when the Federal Reserve will begin to scale back stimulus and self-fulfilling fears the market was overdue for a pullback from record levels.
The Dow Jones Industrial Average dropped more than 100 points during the session before settling at 15,914.62, down 94.15 points, or 0.6%, taking it well below the psychologically important 16,000 level. The drop was the index’s biggest one-day decline since Nov. 7.
The S&P 500 lost 5.75 points, or 0.3%, to 1,795.15 and the Nasdaq Composite declined 8.06 points, or 0.2%, to 4,037.20.
“I hate to use the words, ‘we’re due,’ but we’ve gone straight up,” said J.J. Kinahan, chief derivatives strategist at TD Ameritrade in Chicago.
A decision by a Michigan judge to allow Detroit’s bankruptcy to proceed over the objections of unions and retirees helped trigger added selling pressure on concerns it could set a precedent for other municipalities, analysts said. The news served as an excuse for investors to “take a little bit off the table,” Kinahan said, while emphasizing that the scale of the pullback, which has seen the S&P 500 lose ground for three consecutive sessions, remains quite modest.
The index set a record close above 1,800 last week and is up nearly 26% year to date.
While this is a big week for economic data, with November nonfarm payrolls set for release on Friday, there were no major items on the calendar Tuesday aside from monthly auto sales.

Just as BMO (Bank of Montreal) had regained the pre-crisis 2007 highs (see chart above), an earnings report that looked good on the surface has hit the stock.
We continue to hold the stock for now. However, the BMO results may indicate a sea change in the direction of Canadian bank stocks as a whole. Even though the economy has been aided by low interest rates, things are getting punch-drunk on the liquidity and the absence of new economic growth catalysts (especially with China fading) is making it more difficult for financial services companies to find new solid areas of opportunity.
Bank of Montreal (BMO) is held in the McIver-Jasayko Model Portfolios as of December 3 2013. Comments about BMO are not intended as advice and do not constitute a recommendation to buy, sell, or hold.
The opinions expressed in this report are the opinions of the author and readers should not assume they reflect the opinions or recommendations of Richardson GMP Limited or its affiliates. Assumptions, opinions and estimates constitute the author’s judgment as of the date of this material and are subject to change without notice. We do not warrant the completeness or accuracy of this material, and it should not be relied upon as such. Before acting on any recommendation, you should consider whether it is suitable for your particular circumstances and, if necessary, seek professional advice. Past performance is not indicative of future results.
Richardson GMP Limited, Member Canadian Investor Protection Fund.
Richardson is a trade-mark of James Richardson & Sons, Limited. GMP is a registered trade-mark of GMP Securities L.P. Both used under license by Richardson GMP Limited.

U.S. stocks declined, giving the Standard & Poor’s 500 Index a third day of losses following its latest record, as investors await economic reports this week for clues on when the Federal Reserve will reduce stimulus.
Krispy Kreme Doughnuts Inc. (KKD) plunged 17 percent after quarterly revenue missed analysts’ estimates. Yum! Brands Inc., the owner of KFC and Pizza Hut, fell 2.2 percent after releasing a financial update that showed volatile Chinese sales. Apple Inc. (AAPL) rose 1.5 percent after buying data-analytics firm Topsy Labs Inc.
The S&P 500 declined 0.2 percent to 1,797.39 at 10:30 a.m. in New York. The Dow Jones Industrial Average dropped 60.48 points, or 0.4 percent, to 15,948.29. Trading in S&P 500 stocks was 3 percent above the 30-day average at this time of day.
“It’s really a mixed picture right now,” Dan Veru, the chief investment officer who helps oversee $4.5 billion at Palisade Capital Management LLC, said in a phone interview from Fort Lee, New Jersey. “In the absence of any bigger data, investors are grasping for these little bits of micro data in trying to develop a conclusion. Any market that’s appreciated as much as the stock market has this year is going to be vulnerable to sell-offs.”
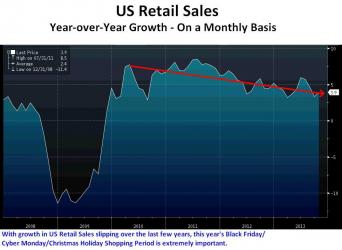
U.S. stocks fell yesterday as data showing manufacturing unexpectedly rose last month bolstered the case for the Fed to start curbing stimulus. A separate report indicated spending on a Black Friday weekend fell for the first time since 2009.
Data Watch
Data today indicated online sales on Cyber Monday rose 21 percent from a year ago for a single-day record. Reports on car sales indicated that Ford Motor Co. and Chrysler Group LLC registered November U.S. sales gains that exceeded analysts’ estimates as dealers boosted year-end promotions to trim rising vehicle inventory.
The Commerce Department will release data tomorrow on new home sales and the central bank will publish its Beige Book, which provides policy makers anecdotal accounts of business activity from the Fed districts. Reports on third-quarter gross domestic product and November non-farm payrolls are also due this week.
Central-bank policy makers are considering scaling back their monetary support “in coming months” if the economy improves as anticipated, according to minutes from their last meeting. They next meet on Dec. 17-18.
The S&P 500 has added 26 percent this year, challenging 2003 for the best annual gain in 15 years, after the Fed refrained from trimming its monthly bond purchases and corporate earnings have surpassed estimates.
DETROIT (Reuters) – Pickup trucks continued to drive a resurgence in U.S. vehicle sales in November as the Big Three Detroit automakers all exceeded analysts’ expectations.
Chrysler Group LLC, a unit of Fiat SpA (MIL:F), said Tuesday its U.S. vehicle sales in November jumped 16 percent to 142,275. General Motors Co (GM) said November sales climbed 14 percent to 212,060. Ford Motor Co (NYS:F) said its November sales rose 7 percent to 190,449.
The industry’s torrid sales pace in November reached an annual rate of 16 million vehicles, according to GM, the second highest for the year and well above last month’s annual rate of 15.2 million. Analysts polled by Thomson Reuters had estimated the seasonally adjusted annual sales rate in November was 15.75 million.
Big trucks were the best-selling vehicles at each of the Detroit automakers.
Ford’s industry-leading F-series pickup outsold all of the company’s passenger cars combined, rising 16 percent to 65,501. Combined sales of GM’s Chevrolet Silverado and GMC Sierra were up 15 percent at 48,748. Chrysler’s Ram pickup gained 22 percent to 29,635.
Volkswagen of America said its VW brand sales in November fell 16 percent to 30,727. VW does not sell pickup trucks in North America.
Industry researchers said manufacturers continued to provide ample incentives averaging $2,500 per vehicle and more in November.
“It’s pretty clear that the industry was super aggressive as we approached the holiday season (and) through the Thanksgiving weekend,” said Jonathan Browning, chief executive of VW of America.
(Reporting by Ben Klayman and Paul Lienert in Detroit; Editing by Gerald E. McCormick and Maureen Bavdek)

-
I know Mike is a very solid investor and respect his opinions very much. So if he says pay attention to this or that - I will.
~ Dale G.
-
I've started managing my own investments so view Michael's site as a one-stop shop from which to get information and perspectives.
~ Dave E.
-
Michael offers easy reading, honest, common sense information that anyone can use in a practical manner.
~ der_al.
-
A sane voice in a scrambled investment world.
~ Ed R.
Inside Edge Pro Contributors

Greg Weldon

Josef Schachter

Tyler Bollhorn

Ryan Irvine

Paul Beattie

Martin Straith

Patrick Ceresna

Mark Leibovit

James Thorne

Victor Adair