
It’s hard to be bearish in December.
This is the time of good cheer, dancing sugar plums, and brandy-spiked eggnog. It’s also the time of rising stock markets.
More so than any other month of the year, December has a bullish bias. Going back to 1950, stocks showed gains in December 47 out of 63 years. That’s 74% of the time. If we only go back to 1970, the bulls are 35 for 43 – an 81% win rate.
So like I said, it’s tough to be bearish during this time of year. But it’s also tough to overlook this…
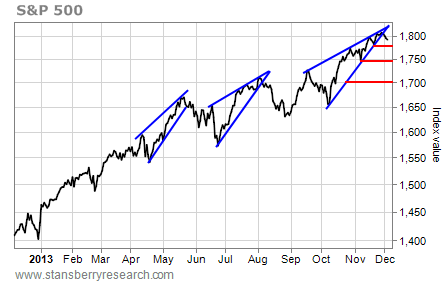
The daily chart of the S&P 500 below shows the index breaking down from a bearish rising-wedge pattern.

Previous breakdowns in May and August led to modest 6% and 4.4% pullbacks, respectively, over the following month. Something similar this time around would set a target for the index somewhere between 1,740 and 1,700.
Yesterday, the S&P 500 tested its first red support line at about 1,780. After falling for four straight days, stocks are oversold enough that they could bounce from this level over the short term.
However, any bounce that fails to rally the S&P 500 to a new all-time high above 1,813 will form a “lower high” on the chart. That’s a reversal pattern, and it increases the chances the next decline will take out support at 1,780 and spark a move toward one of the lower support lines.
So go ahead and be cheery. Be merry and full of goodwill. And be bullish if you like. But be careful, too. Given the look of this chart, stocks have more downside.
Best regards and good trading,
Jeff Clark
Further Reading:
Earlier this week, Jeff revealed another reason for caution: One specific thing happened within months of every single market peak of the last 41 years. And it might be happening again right now. Get all the details here.
One of the stock market’s most reliable indicators is also pointing to a reversal. “We now have a broad stock market sell signal,” Jeff writes. “And the first sign that at least a short-term top may be in place.” See the chart right here.


