
Real Estate
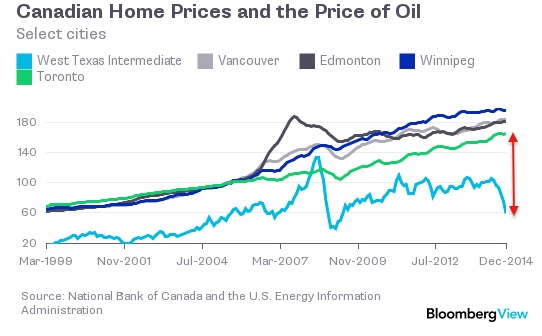 Don’t look now but slumping crude prices are hitting the Canadian housing market like a freight train. Energy accounts for 10% of Canadian GDP and around 25% of exports and the swift fall in oil prices is having a profound effect in the nation’s oil producing regions. Take Calgary for instance, where single-family home sales fell 34% last month. As the following chart shows, Alberta derives some 30% of its provincial revenues from energy royalties and as one TD analyst quoted by the Calgary Herald recently noted, “the effects of significantly lower oil prices had already turned up in resale activity, with sales in Calgary and Edmonton down more than 40 per cent and 30 per cent respectively, from October to January [and] as resale activity slows, prices usually follow.” …..full article & charts HERE
….related:
 Analyst: Canada’s Housing Market is ‘Loonie Tunes’
During a recent visit to Canada, (Mansharamani) “noticed a schizophrenic oscillation between housing exuberance and oil-price despair” and concluded that “Canada is now among the most vulnerable large economies in the world.”
Contributing to the impending burst bubble, according to Mansharamani, is rapidly rising household debt that far exceeds GDP, house prices that have continued their upward march, and the falling price of crude oil – all of which will be felt across the country.
….read more HERE
 A new book by financial adviser and author Hilliard MacBeth says that Canadian home prices are about to fall by nearly 50 per cent, leading to the biggest housing crash the country has ever seen – but its author says this could present an opportunity for well-financed investors.
“Investors who own properties with substantial equity can hang on without any trouble and they will see a new supply of renters who will be looking to rent after being burned as owners,” MacBeth, a portfolio manager at Richardson GMP in Edmonton told CREW.
….continue reading HERE
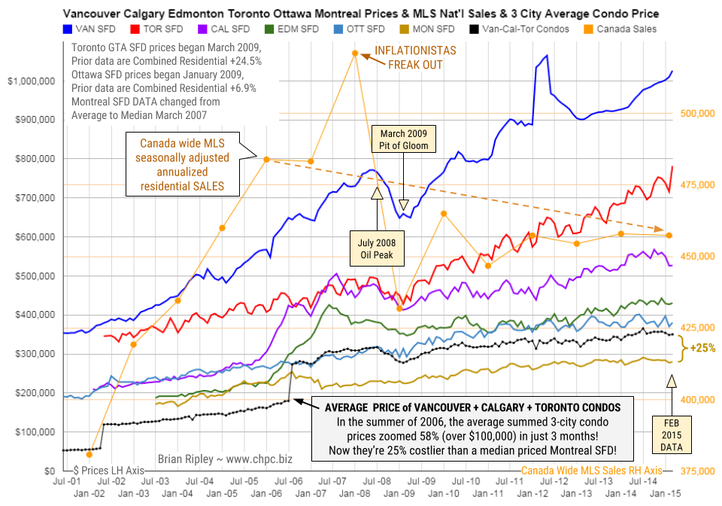
The chart above shows the average detached housing prices for Vancouver, Calgary, Edmonton, Toronto*, Ottawa* and
Montréal* (the six Canadian cities with over a million people) as well as the average of the sum of Vancouver, Calgary and Toronto condo (apartment) prices on the left axis. On the right axis is the seasonally adjusted annualized rate (SAAR) of MLS® Residential Sales across Canada.
In February 2015 the big city metros drew a divergent picture on price and volume. Toronto SFD prices broke out again to the upside for a new record peak and Vancouver SFD prices ticked up as well. The remaining metros traded flat or dropped on energy pricing anxiety (deflation).
Any price gains were accomplished against a 3 year overhead resistance in Canadian national residential housing sales volume.
Can the “posted retail” 5 year fixed rate mortgage low of 4.74% (+/-3% on the street) drive the hunger games into overtime in 2015?
Or is the continuing commodity crash signalling an upcoming major correction for Canadian housing? Your opinion is welcome.
Mattress money has gushed into condos with no respect for fundamentals or plan for contingencies that may be required if Pit of Gloom II develops and one must write off capital gains and or rely on employment earnings to subsidize negative yields.
The Canadian Real Estate
PLUNGE-O-METER
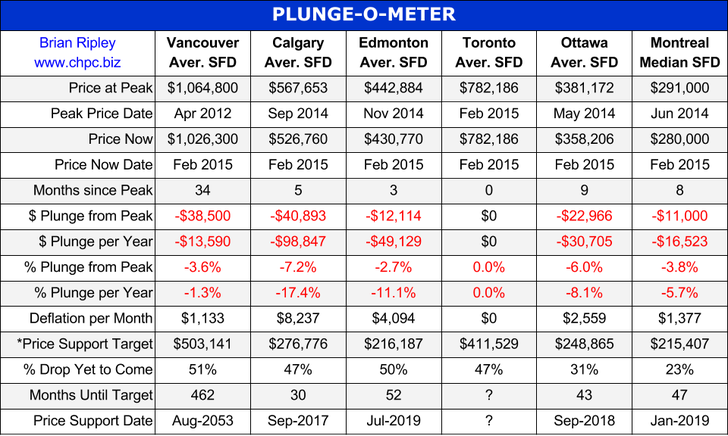
The Plunge-O-Meter tracks the dollar and percentage losses from the peak and projects when prices might find support. On the price chart in the spring of 2005 there was a 4-6 month plateau period while buyers and sellers twitched like a herd. When the credit spreads narrowed and the yield curve began its journey towards inversion, the commodity stampede began.
*The Price Support target represents prices at March 2005; the start of a 40 month period of ardent speculation in all commodities; then a full blown crash into the pit of gloom (March 2009); and then another 39 month rocket ship to the moon but then the crowd suddenly thinned out in April 2012. The revival of spirits erupted in 2013 as global money went short cash and long real estate on an inflation bet (see Whale Watching). Now we have a major divergence with Vancouver and Toronto going against the trend
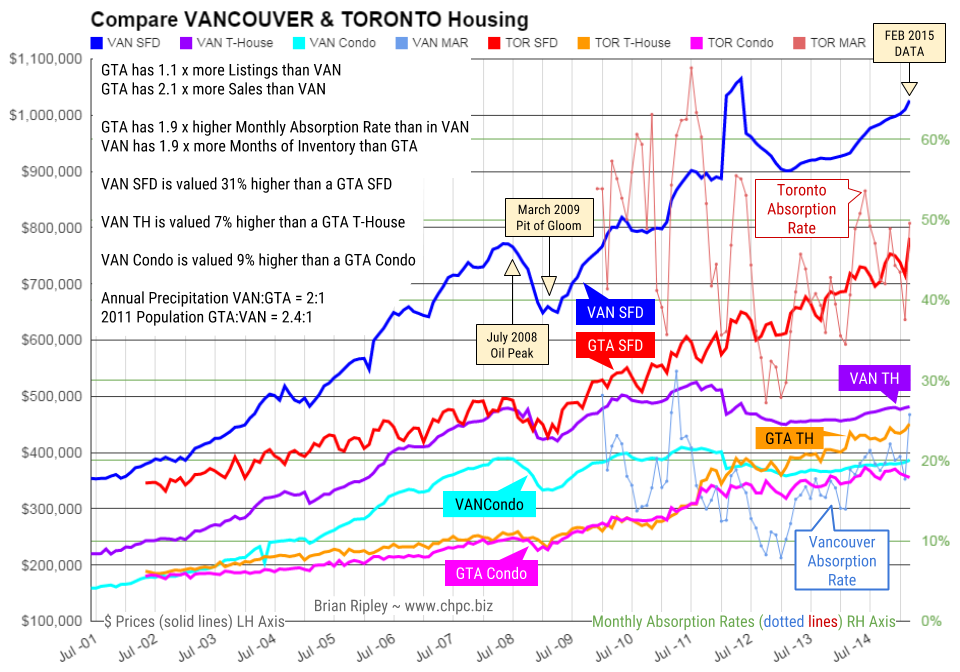
At the Vancouver peak in April 2012, Vancouver metro SFDs were an astounding 64% (1.6 times) more expensive than GTA comparables. But Toronto has been on a tear out of the March 2009 Pit of Gloom and the SFD price differential has shrunk to 31% (1.3x). Click on Chart for Larger Image
The chart above shows the average Detached Single Family Dwelling, Townhouse and Condo prices (solid plot lines) of both Vancouver and Toronto as well as the Monthly Absorption Rate (MAR = Sales/Listings dotted plot lines).
Higher Average Prices in Vancouver than GTA:
31% more for a SFD
7% more for a Town House
9% more for a Condo
More Listings & Sales in GTA than Vancouver:
1.1 x more Listings & 2.1 x more Sales
Monthly Absorption Rate GTA:VAN = 1.9:1
Ratio of SFD to Strata
1 VAN SFD = 2.1 VAN Town Houses
1 GTA SFD = 1.7 GTA Town Houses
1 VAN SFD = 2.7 VAN Condos
1 GTA SFD = 2.2 GTA Condos
Earners needed to buy an average SFD:
VAN = 3.6 and GTA = 2.7 earners
November 2014 Average Earnings:
BC = $47,024 /yr up 14% since Pit of Gloom
ON = $48,950 /yr up 14% since Pit of Gloom
2012 Census Household Median Earnings
VAN = $71,140/yr and GTA = $71,210/yr
January 2015 Unemployment Rate
VAN = 5.6% and GTA = 7.1%
Population 2011 Census
VAN = 2.3 mil or 803 /Km2
GTA = 5.6 mil or 945 /Km2
Annual Precipitation VAN/GTA = 2/1

-
I know Mike is a very solid investor and respect his opinions very much. So if he says pay attention to this or that - I will.
~ Dale G.
-
I've started managing my own investments so view Michael's site as a one-stop shop from which to get information and perspectives.
~ Dave E.
-
Michael offers easy reading, honest, common sense information that anyone can use in a practical manner.
~ der_al.
-
A sane voice in a scrambled investment world.
~ Ed R.
Inside Edge Pro Contributors

Greg Weldon

Josef Schachter

Tyler Bollhorn

Ryan Irvine

Paul Beattie

Martin Straith

Patrick Ceresna

Mark Leibovit

James Thorne

Victor Adair