

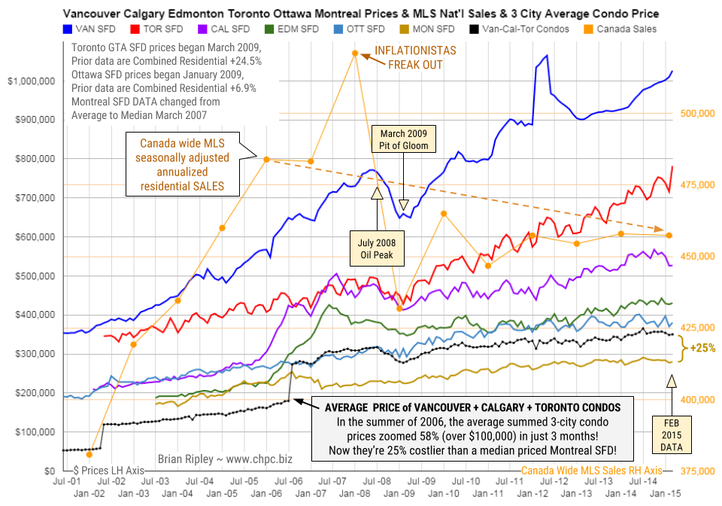
The chart above shows the average detached housing prices for Vancouver, Calgary, Edmonton, Toronto*, Ottawa* and
Montréal* (the six Canadian cities with over a million people) as well as the average of the sum of Vancouver, Calgary and Toronto condo (apartment) prices on the left axis. On the right axis is the seasonally adjusted annualized rate (SAAR) of MLS® Residential Sales across Canada.
In February 2015 the big city metros drew a divergent picture on price and volume. Toronto SFD prices broke out again to the upside for a new record peak and Vancouver SFD prices ticked up as well. The remaining metros traded flat or dropped on energy pricing anxiety (deflation).
Any price gains were accomplished against a 3 year overhead resistance in Canadian national residential housing sales volume.
Can the “posted retail” 5 year fixed rate mortgage low of 4.74% (+/-3% on the street) drive the hunger games into overtime in 2015?
Or is the continuing commodity crash signalling an upcoming major correction for Canadian housing? Your opinion is welcome.
Mattress money has gushed into condos with no respect for fundamentals or plan for contingencies that may be required if Pit of Gloom II develops and one must write off capital gains and or rely on employment earnings to subsidize negative yields.
The Canadian Real Estate
PLUNGE-O-METER
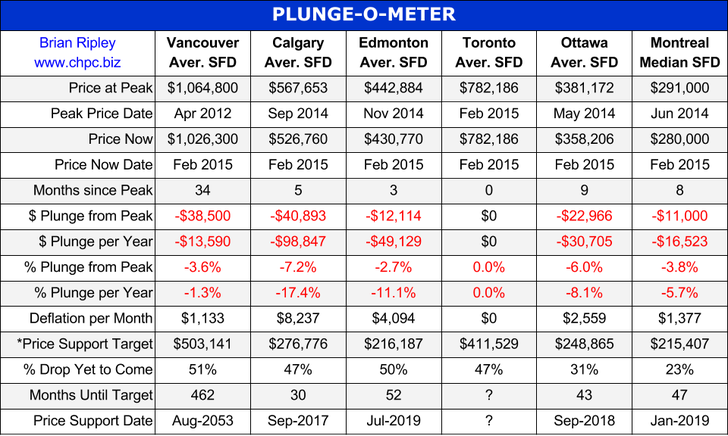
The Plunge-O-Meter tracks the dollar and percentage losses from the peak and projects when prices might find support. On the price chart in the spring of 2005 there was a 4-6 month plateau period while buyers and sellers twitched like a herd. When the credit spreads narrowed and the yield curve began its journey towards inversion, the commodity stampede began.
*The Price Support target represents prices at March 2005; the start of a 40 month period of ardent speculation in all commodities; then a full blown crash into the pit of gloom (March 2009); and then another 39 month rocket ship to the moon but then the crowd suddenly thinned out in April 2012. The revival of spirits erupted in 2013 as global money went short cash and long real estate on an inflation bet (see Whale Watching). Now we have a major divergence with Vancouver and Toronto going against the trend


