
Real Estate
In April 2015 Canada’s big city metro SFD prices all caught a bid with Toronto prices breaking out again to the upside for a new record peak. It’s all about the land that real estate sits on; big money is willing to pay a premium for sitting on it.

The chart above below the average detached housing prices for Vancouver, Calgary, Edmonton, Toronto*, Ottawa* and Montréal* (the six Canadian cities with over a million people) as well as the average of the sum of Vancouver, Calgary and Toronto condo (apartment) prices on the left axis. On the right axis is the seasonally adjusted annualized rate (SAAR) of MLS® Residential Sales across Canada.
Price gains were accomplished on a push higher in sales volume of the Canadian national MLS residential
annualized housing sales data. Trophy hunters are looking for well located SFD properties in hot markets and the hoi polloi want in before they are priced out.
Can the “posted retail” 5 year fixed rate mortgage low of 4.64% (sub-3% on the street) drive the hunger games into overtime in 2015? Or is the commodity crash signalling an upcoming major correction for Canadian housing? Your opinion is welcome.
Mattress money has gushed into condos with no respect for fundamentals or plan for contingencies that may be required if Pit of Gloom II develops and one must write off capital gains and or rely on employment earnings to subsidize negative yields.
It remains interesting to note that the combined average price of a Vancouver, Calgary & Toronto condo is currently 25% more expensive than a median priced Montreal SFD and note also that in the spring of 2006, those 3-City average condos zoomed 58% in price (over $100,000) in just three months as the buy side of the market freaked out over the inversion of the 10yr less the 2yr spread as it went negative (Yield Curve).
The inflationistas have made a big bet and it’s showing up in the supply of rentals.

In every inflating bubble, there’s usually two camps. The first group points out various metrics suggesting something is inherently unsustainable, while the second reiterates that this time, it is different.
After all, if everyone always agreed on these things, then no one would do the buying to perpetuate the bubble’s expansion. The Canadian housing bubble has been no exception to this, and the war of words is starting to heat up.
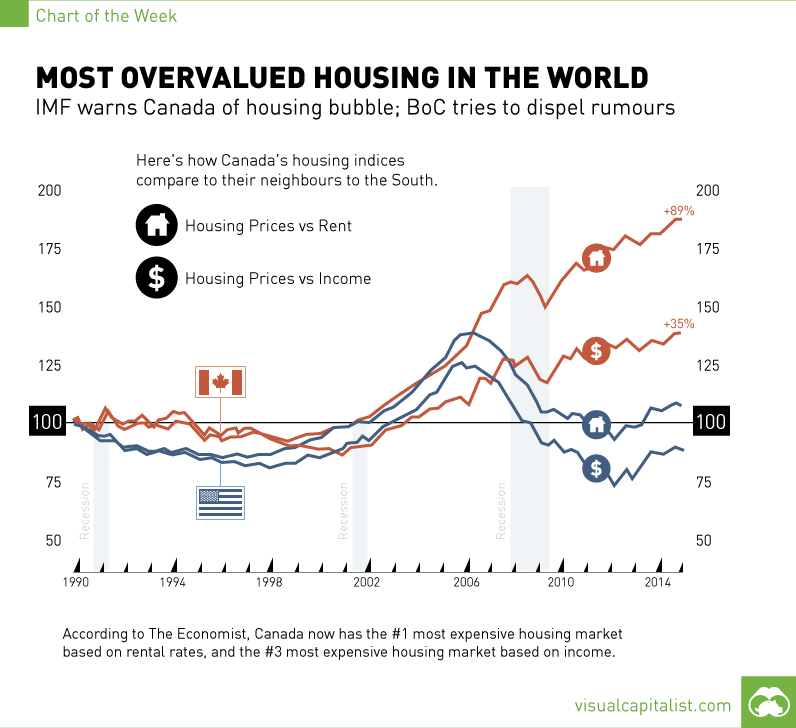
On one side of the ring, we have The Economist, that came out last week saying Canada has the most overvalued housing market in the world. After crunching the data in housing markets in 26 nations, The Economist has determined that Canada’s property market is the most overvalued in terms of rent prices (+89%), and the third most overvalued in terms of incomes (+35%). They have mentioned in the past that the market has looked bubbly for some time, but finally Canada is officially at the top of their list.
Of course, The Economist is not the only fighter on this side of the ring.
Just over a month ago, the IMF sounded a fresh alarm on Canada’s housing market by saying that household debt is well above that of other countries. Meanwhile, seven in ten mortgage lenders in Canada have expressed “concerns” that the real estate sector is in a bubble that could burst at any time. Deutsch Bank estimates the market is 63% overvalued and readily offers seven reasons why Canada is in trouble. Even hedge funds are starting to find ways to short the market in anticipation of an upcoming collapse. Canada’s housing situation could give rise to the world’s next Steve Eisman, Eugene Xu, or Greg Lippmann.
On the opposing side of the ring, who will contend that the Canadian housing market is just different this time? Hint: look to the banks and government.
Stephen Harper, Canada’s Prime Minister, has tried to dispel fears. He recently told a business audience in New York that he didn’t anticipate any housing crisis in Canada.
Just this week, the Bank of Canada also tried its best to deflate housing bubble fears. “We don’t believe we’re in a bubble,” says Stephen Poloz, the Bank’s Governor. “Our housing construction has stayed very much in line with our estimates of demographic demand.”
Poloz suggested that housing costs do not necessarily have to contract to match the incomes of Canadians. Instead, he expects growth in the economy to raise wages and make housing more affordable.
Strangely enough, by the Bank of Canada’s own estimate, the housing market is overvalued by as much as 30%. It is hard for housing to become more affordable when prices are rising in double digits in a year. Combine this with the fact that household debt rates keep setting new records, and one side of the fight might get tilted sooner than later.

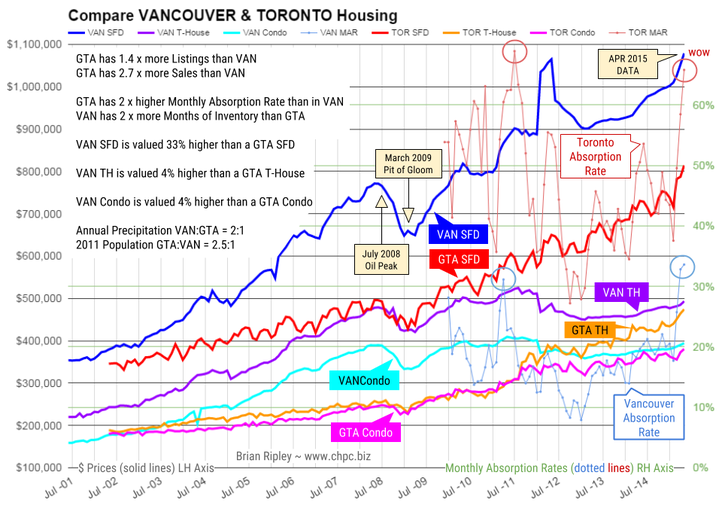
The chart above shows the average Single Family Dwelling, Townhouse and Condo prices (solid plot lines) of both Vancouver and Toronto as well as the Monthly Absorption Rate (MAR = Sales/Listings as dotted plot lines). At the Vancouver peak in April 2012, Vancouver metro SFDs were an astounding 64% (1.6 times) more expensive than GTA comparables. But Toronto has been on a tear out of the March 2009 Pit of Gloom and the SFD price differential has shrunk to 33% (1.3x) even with the current (April 2015) peak average SFD price in Vancouver.
…..for larger chart & to read more go HERE
 More than €2 trillion-worth of eurozone government bonds trade on a negative interest rate. It’s a bubble that is bound to end badly
Here’s an astonishing statistic; more than 30pc of all government debt in the eurozone – around €2 trillion of securities in total – is trading on a negative interest rate.
With the advent of European Central Bank quantitative easing, what began four months ago when 10-year Swiss yields turned negative for the first time has snowballed into a veritable avalanche of negative rates across European government bond markets. In the hunt for apparently “safe assets”, investors have thrown caution to the wind, and collectively determined to pay governments for the privilege of lending to them.
….read more HERE

-
I know Mike is a very solid investor and respect his opinions very much. So if he says pay attention to this or that - I will.
~ Dale G.
-
I've started managing my own investments so view Michael's site as a one-stop shop from which to get information and perspectives.
~ Dave E.
-
Michael offers easy reading, honest, common sense information that anyone can use in a practical manner.
~ der_al.
-
A sane voice in a scrambled investment world.
~ Ed R.
Inside Edge Pro Contributors

Greg Weldon

Josef Schachter

Tyler Bollhorn

Ryan Irvine

Paul Beattie

Martin Straith

Patrick Ceresna

Mark Leibovit

James Thorne

Victor Adair