

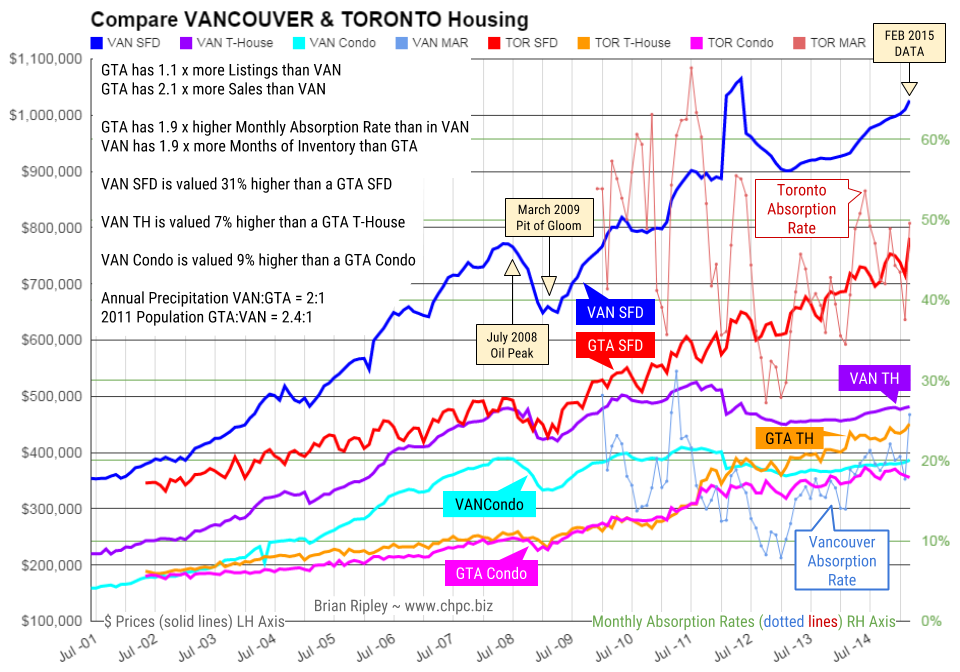
At the Vancouver peak in April 2012, Vancouver metro SFDs were an astounding 64% (1.6 times) more expensive than GTA comparables. But Toronto has been on a tear out of the March 2009 Pit of Gloom and the SFD price differential has shrunk to 31% (1.3x). Click on Chart for Larger Image
The chart above shows the average Detached Single Family Dwelling, Townhouse and Condo prices (solid plot lines) of both Vancouver and Toronto as well as the Monthly Absorption Rate (MAR = Sales/Listings dotted plot lines).
Higher Average Prices in Vancouver than GTA:
31% more for a SFD
7% more for a Town House
9% more for a Condo
More Listings & Sales in GTA than Vancouver:
1.1 x more Listings & 2.1 x more Sales
Monthly Absorption Rate GTA:VAN = 1.9:1
Ratio of SFD to Strata
1 VAN SFD = 2.1 VAN Town Houses
1 GTA SFD = 1.7 GTA Town Houses
1 VAN SFD = 2.7 VAN Condos
1 GTA SFD = 2.2 GTA Condos
Earners needed to buy an average SFD:
VAN = 3.6 and GTA = 2.7 earners
November 2014 Average Earnings:
BC = $47,024 /yr up 14% since Pit of Gloom
ON = $48,950 /yr up 14% since Pit of Gloom
2012 Census Household Median Earnings
VAN = $71,140/yr and GTA = $71,210/yr
January 2015 Unemployment Rate
VAN = 5.6% and GTA = 7.1%
Population 2011 Census
VAN = 2.3 mil or 803 /Km2
GTA = 5.6 mil or 945 /Km2
Annual Precipitation VAN/GTA = 2/1


