
Stocks & Equities
STOCK MARKET – ACTION ALERT – BULL – BUT THERE IS STILL CORRECTIVE RISK – TOO MANY BULLS OUT THERE AND I HAVE MY FINGER ON THE TRIGGER SHOULD A SELL SIGNAL APPEAR. THAT SAID, BERNANKE IS NOT LIKELY TO TRIGGER ANY PANIC.
Turnaround Tuesday triggered the anticipated rally try and today the world awaits word from ‘the man behind the curtain’. Bonds are selling off, investors are dangerously too optimistic, economic fundamentals remain at best questionable both here, in Europe and in China. Bottom line, though there are still higher technical targets in the major indexes, this is not a time to be betting on the long side except for trading purposes. I remain on a BUY signal only because a downtrend has not, as yet, been confirmed, but things could change quickly. My hunch is that a big downside surprise is on the horizon.
On Tuesday, the S&P notched its high at the open before spending the rest of the session in a steady retreat. The selling intensified during afternoon action, sending the S&P into the red as participants displayed caution ahead of tomorrow’s advance second quarter GDP report and the latest policy statement from the Federal Reserve.
The Conference Board’s Consumer Confidence Index weakened a bit in July, dropping from an upwardly revised 82.1 (from 81.4) in June to 80.3. TheBriefing.com consensus pegged the index at 81.6. The slight dip in confidence does not change the overall picture of an improving consumer base. The index likely fell back due to normal volatility after reaching a 5-year high in June. Furthermore, the University of Michigan Consumer Sentiment Index spiked to its highest level since 2007 in July, signaling that the drop in confidence was likely a non-event.
Separately, the May Case-Shiller 20-city Home Price Index rose 12.2% while a 10.5% increase had been expected by the Briefing.com consensus. This followed the previous month’s increase of 12.1%.
Today, the weekly MBA Mortgage Index will be reported at 7:00 ET and the July ADP Employment Change will be released at 8:15 ET. Second quarter GDP will be reported at 8:30 ET and the July Chicago PMI will cross the wires at 9:45 ET. The day will be topped off with the 14:00 ET release of the latest policy statement from the Federal Open Market Committee.
——————————————-
The Dow Industrials were down 1.38 at 15520.59. On Tuesday, July 23 the DJ touched a new record high of 15604.22 which was followed first by a Leibovit Negative Volume Reversal coincident with a 200 point intraday correction into Friday, July 26 into 15405.16. This defines the short-term trading range for the DJ. As a matter of reference, 14551.27 is major support under which downside potential could be another 1000 points.
——————————————–
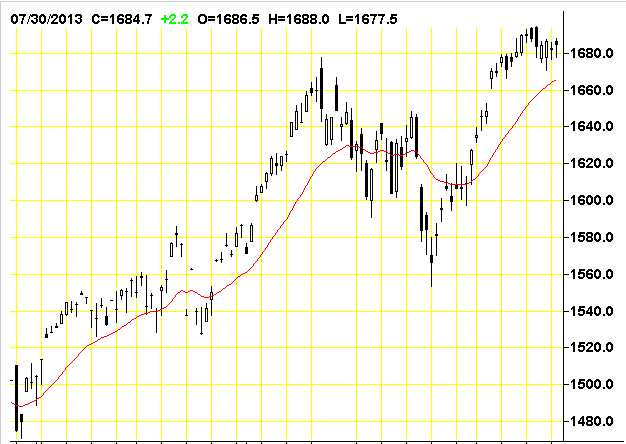
The S&P 500 was up .63 at 1685.96. A VR was posted on July 24 and the burden of proof is on the bulls to breakout into new high ground above 1698.78. The recent low was at 1560.33 on Monday, June 24. This establishes our short-term trading range. The next big upside target is 1730.00.
——————————————–
The Dow Transports were up 20.87 at 6421.82.. We declined from 6608.87 on July 19 to 6355.04 on July 25 – a 250 point decline – establishing the current trading range. On a bigger picture basis, a ‘theoretical’ bullish reverse ‘head and shoulders’ patterns have formed: 1) From July, 2011 to present and 2) May, 2008 to present. The upside measurements are astronomical anywhere from 2600 points from the former to 3400 points to the latter ABOVE CURRENT HIGHS! If this is true and if the Transports are indeed the market leader I believe it is, we have a long way to go in this bull market, but I don’t think that is happening now. In fact, we not see those numbers until the end of the decade.
——————————————
The Russell 2000 was up 2.85 at 1043.51. The Russell touched a new high at 1056.86 intraday on July 23.
——————————————
The Nasdaq Composite was up 17.33 at 3616.47 touching 3629.12 – both new bull market highs. Looks like we’re headed to my next near-term upside potential lies to 3800. Is Bernanke trying to get the Nasdaq back to the 2000 peak of 5000?
—————————————-
The CBOE Volatility Index (VIX), which measures the cost of using options as insurance against declines in the S&P 500 (i.e., the higher the number, the more fear in the marketplace) was up .67 at 13.39. The VIX touched 21.91 intraday on Monday, June 24 – the highest high since the March 15 low of 11.21 – the lowest level since February 2007. It was unchanged at on Friday. The higher we go in the VIX, the more likely a bear cycle is upon us.
—————————————–
Four f the nine market sectors were higher on Tuesday.
XLB -0.25% Materials
XLE -0.19% Energy
XLF -0.05% Financial
XLI +0.42% Industrial
XLK +0.51% Technology
XLP -0.10% Consumer Staples
XLU +0.33% Utilities
XLV +0.02% Health Care
XLY -0.25% Consumer Discretionary
———————————————
NYSE Advance/Decline 1958/2034.
NASDAQ Advance/Decline 1301/1199.
NYSE UP volume to DOWN volume was 15 to 17.
NASDAQ UP volume to DOWN volume was 11 to 5.
——————————————–
From the VRtrader.com website here is a link to World Market Indices:
http://www.vrtrader.com/vr_free/worldmarkets/index.asp


Yesterday we highlighted Newmont Mining as a potential buying opportunity in the gold sector. Today we take a look at another interesting situation.
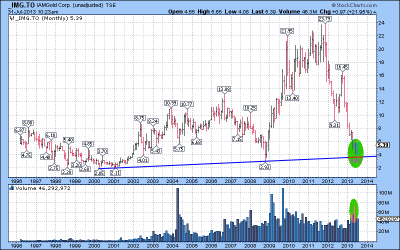
IAMGOLD (IMG.TO) is a leading mid-tier Canadian gold producer with a $2 billion market cap that operates six gold mines on three continents and also operates Niobec Inc. which is one of the world’s top three producers of niobium.
Similar to our Newmont analysis, examining the long-term monthly chart going back to 1996 there were two major lows, one at $2.05 in 2000 and the other at $2.93 in 2008. If we connect these lows you can see a long-term rising trend line that has now provided support at the $4.00 level which was the low on the stock in late June.
The recent low was also accompanied by an expansion in volume as the final sellers have liquidated their positions with new shareholders now in place. This month we have seen some renewed demand creating an inside bar on the monthly chart.
Since the stock peaked at $16.45 last October it has failed to trade above the previous months high? The June high was $5.78 and so far this month the high is $5.65. If we see some renewed strength and the shares can close above $5.65 in August we would become very bullish on IMG.
Again, we are see a great buying opportunity unfolding in a good quality gold producer with a dividend yield of 4.6%.
The information contained in this report was obtained from sources believed to be reliable, however, we cannot represent that it is accurate or complete. This report is provided as a general source of information and should not be considered personal investment advice or solicitation to buy or sell securities. The views expressed are those of the author and not necessarily those of Raymond James Ltd.

Here’s what to look for when the Federal Open Market Committee releases a statement at 2 p.m. tomorrow after a two-day meeting in Washington. Unlike last month, the policy-making panel will not release economic forecasts, and Chairman Ben S. Bernanke will not be briefing the press afterwards.
— Possible clarification in the statement on the likely path of the Fed’s bond buying, currently $85 billion a month. Bernanke said in a news conference on June 19 that the central bank may begin reducing the pace of purchases “later this year” and may end the program about the middle of 2014, assuming the economy performs as forecast by the Fed. By the time the program ends, unemployment will be around 7 percent, Bernanke said. The rate was 7.6 percent in June.
“We are looking for the FOMC to formalize a version of the guidelines for tapering QE laid out by Chairman Ben Bernanke,” Julia Coronado, chief economist for North America at BNP Paribas in New York, wrote in a research note. The statement will probably say that the committee expects to begin trimming the purchases later this year; that the reduction will come in “measured steps” if the economy continues to improve and inflation rises closer to the Fed’s target; and that the program will end when unemployment is around 7 percent, she said.
— An emphasis from the FOMC that it expects to pursue accommodative policy for the foreseeable future, even after the committee concludes its so-called quantitative easing program, according to Neal Soss and Dana Saporta, economists at Credit Suisse Group AG in New York. The FOMC has kept its benchmark interest rate near zero since December 2008.
Economist Survey
— No change in the pace of bond purchases. None of the 54 economists surveyed by Bloomberg July 18-22 expected the FOMC to begin paring asset purchases at the meeting ending tomorrow. Half predicted a dial-back of the program to $65 billion per month in September.
— An acknowledgement that low inflation has been more persistent than expected, which would “would be seen as dovish, as would a more explicit commitment to defend their inflation target from below,” according to a research note from Bank of America Corp. in New York. The Fed’s preferred price gauge showed that inflation was at 1 percent in May, compared with the central bank’s 2 percent target.
— Renewed dissents from St. Louis Fed President James Bullard and Kansas City’s Esther George, according to Michael Feroli, chief U.S. economist at JPMorgan Chase & Co. in New York. Bullard has repeatedly voiced concerns about low inflation, while George has said the Fed’s record accommodation risks leading to financial imbalances.
To contact the reporter on this story: Aki Ito in San Francisco at aito16@bloomberg.net.
To contact the editor responsible for this story: Christopher Wellisz at cwellisz@bloomberg.net
Given more than his normal 30-second soundbite on mainstream media, Marc Faber is able to discuss in considerably more detail his views on the massive growth in global financialization (when compared to real economies) noting that “one day, this financial bubble will have to adjust on the downside.” This will occur via either an inflationary burst or a collapse of the system. Simply put, “it’s gonna end one day,“either through war or financial collapse,” it will be very painful.” The Gloom, Boom, and Doom Report editor notes current asset valuations are driven by excess credit creation, printing money, and distorted market signals, and the unintended consequences of the effect on investor psychology are perfectly mis-timed. Faber concludes with a discussion of the inflationary impact of US monetary policy and where it is seen (and not seen) and the global social unrest implications of middle class discontent.
QE will not End with Ben Bernanke
Money Printing will End only when The System Breaks Down
 Dr. Faber asked if money printing would end and when:
Yes, until the system breaks down. My view would be that there will be money printing, and the problem with money printing is always that you don’t control where it goes to. Ideally, it would go into higher incomes of the middle class and of the working class, but this hasn’t really happened. The real wait is for the typical household or the medium household, they are going down. What is going up is basically selected asset markets, like the real estate market has recovered. In some areas, we’ve hit new highs. The stock market has gone up. But as you know, only very few people own stocks in the United States, so it doesn’t impact the wealth of the majority of people.
Marc Faber: I dont know what the End Game will be
SMN: But do you think that will be worth anything?
Marc Faber: I don’t know what the end game will be, and whether we’ll still be alive or whether we’ll be in wars or in revolutions as the worst. That’s why I want to hold some physical gold. There’s no point to hold physical gold somewhere in the sky. I would hold some physical gold in my proximity. In other words, I own some in Thailand and some in Hong Kong. I still have too much in Europe, but over time, I will move it to Asia.
….. in Sprott money News Interview: Click Here to watch the full interview >>>>>>


-
I know Mike is a very solid investor and respect his opinions very much. So if he says pay attention to this or that - I will.
~ Dale G.
-
I've started managing my own investments so view Michael's site as a one-stop shop from which to get information and perspectives.
~ Dave E.
-
Michael offers easy reading, honest, common sense information that anyone can use in a practical manner.
~ der_al.
-
A sane voice in a scrambled investment world.
~ Ed R.
Inside Edge Pro Contributors

Greg Weldon

Josef Schachter

Tyler Bollhorn

Ryan Irvine

Paul Beattie

Martin Straith

Patrick Ceresna

Mark Leibovit

James Thorne

Victor Adair