

STOCK MARKET – ACTION ALERT – BULL – BUT THERE IS STILL CORRECTIVE RISK – TOO MANY BULLS OUT THERE AND I HAVE MY FINGER ON THE TRIGGER SHOULD A SELL SIGNAL APPEAR. THAT SAID, BERNANKE IS NOT LIKELY TO TRIGGER ANY PANIC.
Turnaround Tuesday triggered the anticipated rally try and today the world awaits word from ‘the man behind the curtain’. Bonds are selling off, investors are dangerously too optimistic, economic fundamentals remain at best questionable both here, in Europe and in China. Bottom line, though there are still higher technical targets in the major indexes, this is not a time to be betting on the long side except for trading purposes. I remain on a BUY signal only because a downtrend has not, as yet, been confirmed, but things could change quickly. My hunch is that a big downside surprise is on the horizon.
On Tuesday, the S&P notched its high at the open before spending the rest of the session in a steady retreat. The selling intensified during afternoon action, sending the S&P into the red as participants displayed caution ahead of tomorrow’s advance second quarter GDP report and the latest policy statement from the Federal Reserve.
The Conference Board’s Consumer Confidence Index weakened a bit in July, dropping from an upwardly revised 82.1 (from 81.4) in June to 80.3. TheBriefing.com consensus pegged the index at 81.6. The slight dip in confidence does not change the overall picture of an improving consumer base. The index likely fell back due to normal volatility after reaching a 5-year high in June. Furthermore, the University of Michigan Consumer Sentiment Index spiked to its highest level since 2007 in July, signaling that the drop in confidence was likely a non-event.
Separately, the May Case-Shiller 20-city Home Price Index rose 12.2% while a 10.5% increase had been expected by the Briefing.com consensus. This followed the previous month’s increase of 12.1%.
Today, the weekly MBA Mortgage Index will be reported at 7:00 ET and the July ADP Employment Change will be released at 8:15 ET. Second quarter GDP will be reported at 8:30 ET and the July Chicago PMI will cross the wires at 9:45 ET. The day will be topped off with the 14:00 ET release of the latest policy statement from the Federal Open Market Committee.
——————————————-
The Dow Industrials were down 1.38 at 15520.59. On Tuesday, July 23 the DJ touched a new record high of 15604.22 which was followed first by a Leibovit Negative Volume Reversal coincident with a 200 point intraday correction into Friday, July 26 into 15405.16. This defines the short-term trading range for the DJ. As a matter of reference, 14551.27 is major support under which downside potential could be another 1000 points.
——————————————–
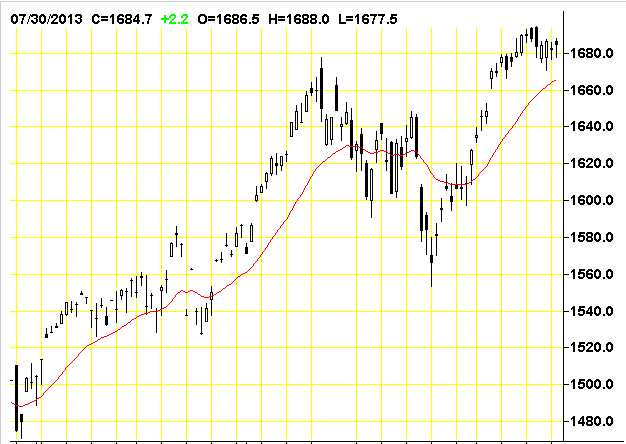
The S&P 500 was up .63 at 1685.96. A VR was posted on July 24 and the burden of proof is on the bulls to breakout into new high ground above 1698.78. The recent low was at 1560.33 on Monday, June 24. This establishes our short-term trading range. The next big upside target is 1730.00.
——————————————–
The Dow Transports were up 20.87 at 6421.82.. We declined from 6608.87 on July 19 to 6355.04 on July 25 – a 250 point decline – establishing the current trading range. On a bigger picture basis, a ‘theoretical’ bullish reverse ‘head and shoulders’ patterns have formed: 1) From July, 2011 to present and 2) May, 2008 to present. The upside measurements are astronomical anywhere from 2600 points from the former to 3400 points to the latter ABOVE CURRENT HIGHS! If this is true and if the Transports are indeed the market leader I believe it is, we have a long way to go in this bull market, but I don’t think that is happening now. In fact, we not see those numbers until the end of the decade.
——————————————
The Russell 2000 was up 2.85 at 1043.51. The Russell touched a new high at 1056.86 intraday on July 23.
——————————————
The Nasdaq Composite was up 17.33 at 3616.47 touching 3629.12 – both new bull market highs. Looks like we’re headed to my next near-term upside potential lies to 3800. Is Bernanke trying to get the Nasdaq back to the 2000 peak of 5000?
—————————————-
The CBOE Volatility Index (VIX), which measures the cost of using options as insurance against declines in the S&P 500 (i.e., the higher the number, the more fear in the marketplace) was up .67 at 13.39. The VIX touched 21.91 intraday on Monday, June 24 – the highest high since the March 15 low of 11.21 – the lowest level since February 2007. It was unchanged at on Friday. The higher we go in the VIX, the more likely a bear cycle is upon us.
—————————————–
Four f the nine market sectors were higher on Tuesday.
XLB -0.25% Materials
XLE -0.19% Energy
XLF -0.05% Financial
XLI +0.42% Industrial
XLK +0.51% Technology
XLP -0.10% Consumer Staples
XLU +0.33% Utilities
XLV +0.02% Health Care
XLY -0.25% Consumer Discretionary
———————————————
NYSE Advance/Decline 1958/2034.
NASDAQ Advance/Decline 1301/1199.
NYSE UP volume to DOWN volume was 15 to 17.
NASDAQ UP volume to DOWN volume was 11 to 5.
——————————————–
From the VRtrader.com website here is a link to World Market Indices:
http://www.vrtrader.com/vr_free/worldmarkets/index.asp


