
Energy & Commodities
West Texas Intermediate crude fell to the lowest level in almost four weeks before a government report that may show slowing U.S. economic growth.
Futures trimmed a monthly advance that would be the biggest since August. U.S. gross domestic product probably expanded at a 1 percent annualized rate in the second quarter, compared with 1.8 percent in the previous three months, according to a Bloomberg survey before data are released tomorrow. Confidence among U.S. consumers declined more than forecast in July. WTI’s discount to Brent widened to a three-week high.
Crude also slid as the dollar strengthened against its rivals, reducing oil’s investment appeal. The Bloomberg U.S. Dollar Index, which measures the greenback against 10 leading currencies, gained as much as 0.4 percent.
Implied volatility for at-the-money WTI options expiring in September was 22.3 percent, compared with 21.2 percent yesterday, data compiled by Bloomberg showed.
Electronic trading volume on the Nymex was 493,593 contracts as of 2:40 p.m. It totaled 428,816 contracts yesterday, 35 percent below the three-month average. Open interest was 1.84 million contracts.
….read more HERE


 One of Pimco’s top thinkers, market strategist and portfolio manager Tony Crescenzi defines three important takeaways from the chairman’s testimony (in his report to congress) that Pimco believes have shelf life.
With this week bringing a policy statement from the Federal Open Market Committee, as well as a jobs report, a GDP report, and a slew of other indicators its probably a good idea to…….
….review all 3 HERE
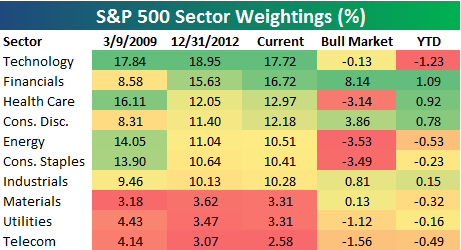
We’ve seen some pretty big moves in the weightings of sectors in the S&P 500 so far this year. Below is an updated look at S&P 500 sector weightings compared to where they stood at the start of the current bull market on March 9th, 2009 as well as at the end of 2012.
As shown below, the Technology sector remains the biggest in the S&P 500 at 17.72% of the index. The Financial sector ranks second at 16.72%, followed by Health Care (12.97%), Consumer Discretionary (12.18%) and Energy (10.51%). At the bottom of the list is Telecom Services at just 2.58% of the index. Materials and Utilities rank second to last at 3.31%.
The Financial sector has clearly made the biggest move of any sector in recent years. At the end of the financial crisis (start of the current bull), the Financial sector made up just 8.58% of the index. Since then it has nearly doubled its weighting up to 16.72%. This year alone, the Financial sector has added 1.09 percentage points to its weighting.
Health Care and Consumer Discretionary have also seen big jumps in their weightings this year, while the biggest losers have been Technology (-1.23%) and Energy (-0.53%).
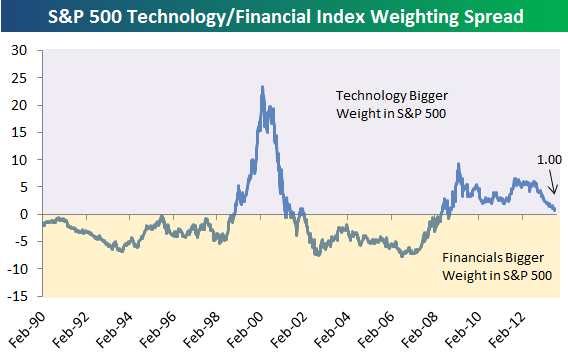
Below is a chart showing the spread between the weightings of the S&P 500 Technology and Financial sectors. When the spread is above 0, the Technology sector has a larger weighting than the Financial sector, and vice versa. As shown, after losing significant ground to Technology during the financial crisis, the Financial sector is just 1 percentage point below the weighting of Tech. If the recent trend continues, it won’t be long before Financials overtakes Technology as the biggest sector of the market once again.
Is this a good thing? The Financial sector exists so that all of the other sectors of the economy can function and grow. When the Financial sector becomes the biggest sector of the economy, it becomes worrisome that the whole system is out of whack. That’s certainly what happened a few years ago, and it didn’t end well!
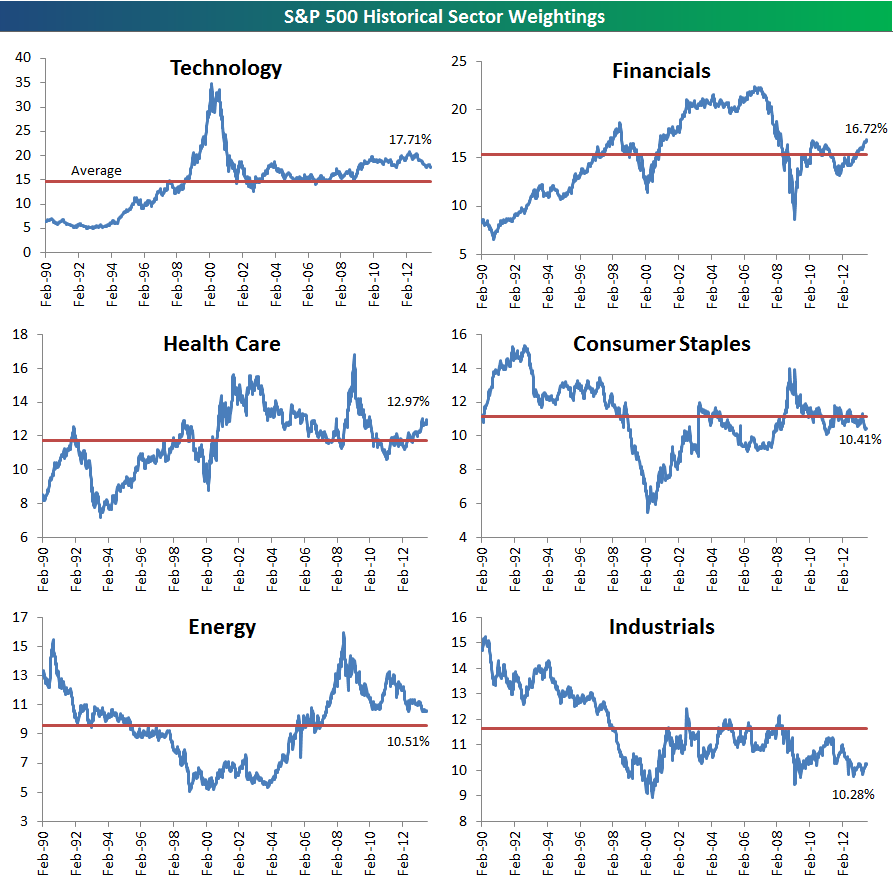
Below are charts showing the historical S&P 500 weightings for each of the ten sectors. In each chart, the red line represents the sector’s average S&P 500 weighting since 1990. At the moment, Technology, Financials, Health Care, Energy and Consumer Discretionary are above their historical averages, while Consumer Staples, Industrials, Materials, Utilities and Telecom Services are below their historical averages.
After hitting a multi-decade low in early 2009, the Consumer Discretionary sector has just moved back above its long-term average. On the flip side, it’s interesting that the three smallest sectors of the S&P 500 — Utilities, Materials and Telecom Services — are all below their long-term averages. Telecom Services has really faded this year, falling to its lowest weighting since 1990. Maybe it’s time to just combine it with another sector just as they did with the Transportation sector (merged with Industrials back in 2001)!
One of our most highly anticipated reports over at Bespoke Premium is our weekly “Bespoke 50” list of our 50 favorite growth stocks. To make the list of 50, a stock must have strong earnings growth prospects along with an attractive price chart based on Bespoke’s proprietary fundamental and technical analysis.
The Bespoke 50 has done very well since we launched the portfolio in March 2012. As shown below, the Bespoke 50 is up 63.1% since inception versus a gain of 24.8% for the S&P 500 “SPY” ETF. So far in 2013, the Bespoke 50 is up 43% versus a gain of 18.2% for the S&P 500.
“The Bespoke 50” is updated weekly every Thursday. If you’re interested in seeing Bespoke’s 50 favorite growth stocks, sign up for a 5-day free trial to Bespoke Premium today. For a limited time, enter “bespoke50” in the coupon code section of our Subscribe page to receive a 10% discount on your membership!


-
I know Mike is a very solid investor and respect his opinions very much. So if he says pay attention to this or that - I will.
~ Dale G.
-
I've started managing my own investments so view Michael's site as a one-stop shop from which to get information and perspectives.
~ Dave E.
-
Michael offers easy reading, honest, common sense information that anyone can use in a practical manner.
~ der_al.
-
A sane voice in a scrambled investment world.
~ Ed R.
Inside Edge Pro Contributors

Greg Weldon

Josef Schachter

Tyler Bollhorn

Ryan Irvine

Paul Beattie

Martin Straith

Patrick Ceresna

Mark Leibovit

James Thorne

Victor Adair