
Stocks & Equities
 ….Worse Than 2007.
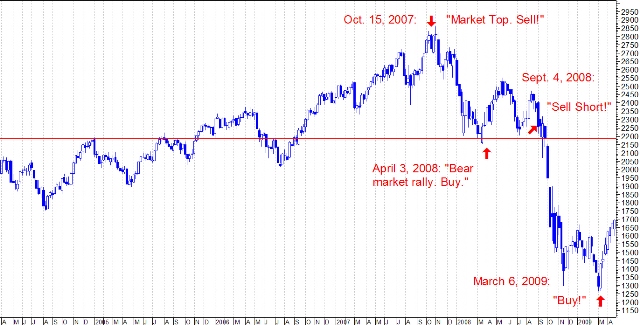
This predicition is coming from the man who successfully predicted the huge 54% 17 month Crash of 2008 when the Dow fell from its its peak of 14164 on October 9, 2007 to 6469 on March 6, 2009.
Click on image for larger view
Schiff: We’re Heading For A Crisis Worse Than 2007
Washington is engaged in a massive “campaign” to make Americans believe the economy is in recovery. But in reality the United States is at the brink of a devastating economic crash that will cause catastrophic market losses and impoverish millions.
Peter, the best-selling author and CEO of Euro Pacific Capital delivered this frightening warning to investors in a recent interview on CCTV.
“The problem with politicians is they don’t want to level with the voters and tell them how bad the economy really is and what the cure for the disease is,” Schiff said.
Click to view a larger image
The “disease” Schiff refers to is a toxic combination of our massive $16.4 trillion debt and the Fed’s continued devaluing of the dollar through its controversial 7-year long “easing” program.
The Fed is currently purchasing $85 billion a month in Treasury and mortgage bonds, a form of stimulus.
President Obama and like-minded politicians claim this stimulus has pushed the economy forward, boosting GDP and keeping inflation low.
But Schiff says “it’s another lie.”
In fact, according to Schiff, the government has done nothing more than create a “phony” economy that is “completely dependent on the ability to borrow more money that we can’t pay back.”
“The Fed knows that the U.S. economy is not recovering,” Schiff said. “It simply is being kept from collapse by artificially low interest rates and quantitative easing. As that support goes, the economy will implode.”
“The crisis is imminent,” Schiff said. “I don’t think Obama is going to finish his second term without the bottom dropping out. And stock market investors are oblivious to the problems.”
Schiff charged Washington with cooking the books on its latest GDP and inflation figures.
He cites the government’s recent move to raise GDP 3% by including items never calculated before and that “no other country on the planet counts.” These include such intangibles costs and royalties from books, magazines iTunes song and movies.
The Financial Times reported this strange maneuver as the “U.S. Economy’s “Hollywood Makeover.”
“That’s what the government does,” Schiff said. “Whenever they don’t like the results, they change the methodology for calculating those results.”
“Maybe some of our creditors will be dumb enough to believe the hype,” Schiff added.
“The fact is, Schiff said. “We’re broke. We owe trillions. Look at our budget deficit; look at the debt to GDP ratio, the unfunded liabilities. If we were in the Eurozone, they would kick us out.”
Schiff points out recent market gains, with the Dow topping 14,000 on its way to setting record highs, is yet another lie giving investors a false sense of security.
“It’s not that the stock market is gaining value… it’s that our money is losing value. And so if you have a debased currency… a devalued currency, the price of everything goes up. Stocks are no exception,” he said.
“I think we are heading for a worse economic crisis than we had in 2007,” Schiff said. “You’re going to have a collapse in the dollar…a huge spike in interest rates… and our whole economy, which is built on the foundation of cheap money, is going to topple when you pull the rug out from under it.”
In August 2006, when the Dow was hitting new highs nearly every day, Schiff said in an interview: “The United States is like the Titanic, and I’m here with the lifeboat trying to get people to leave the ship… I see a real financial crisis coming for the United States.”
Just over a year later, the meltdown that became the Great Recession began, just as Schiff predicted.
He also predicted the subprime mortgage bubble burst, nearly a year before the real estate market fully crashed.
His recent warnings, however, have been even more alarming. Will they also prove to be true?
In his most recent book, “The Real Crash” How to Save Yourself and Your Country“, Schiff writes that
when the “real crash” comes,” it will be worse than the Great Depression.
Unemployment will skyrocket, credit will dry up, and worse, the dollar will collapse completely, “wiping out all savings and sending consumer prices into the stratosphere.”
Schiff estimates this “cancer” could consume a trillion dollars from consumers this year.
“Today we’re the world’s greatest debtor nation. Companies, homeowners and banks are so highly leveraged, rising interest rates will be devastating.”
According to polls, the average American is indeed sensing danger. A recent survey found that 61% of Americans believe a catastrophe is looming – yet only 15% feel prepared for such a deeply troubling event.
Editor’s Note: As a service to Money Morning readers, we’ve arranged a way for you to get a copy of Peter Schiff’s new best-selling book, The Real Crash: How To Save Yourself And Your Country, for free, including shipping. The book shows in plain language exactly what economic dangers ordinary Americans face right now and how you can protect yourself. Please go here for your free copy.
Is Devastation The Ultimate Cure?
Despite its bleak outlook, Schiff’s book has become a real wake-up call for millions of readers.
While Schiff’s predictions can be grim, he also offers step-by-step solutions that average Americans can follow to protect their wealth, investments and savings.
According to Schiff, “the crash and what follows” can be beneficial. But only for those who understand beforehand what is happening and have time to prepare for the devastation.
“All we can do now is prepare for the crash,” Schiff said. “If we brace ourselves properly and control the impact, we will survive it.”

I’m getting so many questions from readers that I’ve decided to devote this week’s column to answering the most important ones. So let’s get started.
Q: Larry, you were right as rain about gold. It crashed this year and came close to one of your targets at the end of June. Is the bottom here yet?
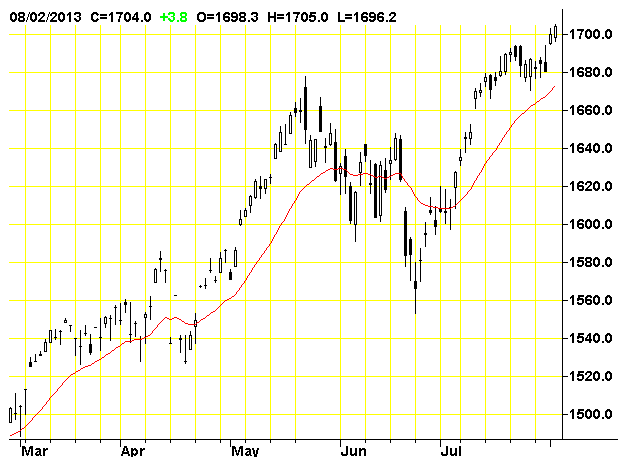
A: It’s too soon to say. But referring to the chart I presented last week, repeated here, as I had forewarned then, gold and silver should head lower almost  immediately, into late August/early September.
And indeed, the latest rally early last week has failed, and now both gold and silver are moving lower again.
So the question now is whether gold will hold its previous low at $1,178, or move lower to test major support at the $1,050 to $1,070 level.
Silver’s major long term support lies between $15 and $17.
If gold closes below $1,295.80 and then $1,262.50, new lows will likely be seen heading into September. That would be the final low.
If silver closes below $18.51 — highly likely based on my trading models — then new lows will be seen in that metal as well.
If neither of the above occurs during the month of August, there’s an excellent chance gold will merely retest its prior lows, then start to take off to the upside. It’s also possible gold will hold its prior low while silver makes a new low, and then both will go to the upside.
Click for a larger version of the chart
In short, neither metal is out of the woods yet, but they are making some good headway at establishing what should prove to be major lows out of which the next leg up will begin.
Q: Why isn’t inflation a big problem now? Everyone is expecting it, and the world’s central banks have certainly printed trillions of dollars of paper money.
A: As I’ve said all along, printing money by itself is not inflationary if the majority of investors and consumers don’t want to spend or borrow money. That’s been the case for years now as consumers, investors and businesses — the private sector — all retrench.
In addition, you need an important shift in confidence by the private sector. Until recently, the private sector showed a lot of confidence in the public sector, government, to solve the financial crisis. So, trillions of dollars were plowed back into government securities for safety.
But as we’ve recently seen, the private sector is losing confidence in government. Hence, the bond market is now starting to crumble and interest rates are surging. The private sector is starting to yank its money away from government.
That’s evidence that confidence in government is now declining. As that progresses, inflation will indeed tick higher and all the central bank money printing that’s been going on will finally come home to roost.
That said, inflation is coming. It’s right around the corner. But do not bet on hyperinflation in the U.S. That’s not going to happen. Our bond markets are too big and too deeply liquid and our economy too large for it to experience Weimar- or Zimbabwe-like inflation. Anyone telling you otherwise does not know what they are talking about or they are simply out to scare you.
Q: Where do your war cycles stand?
A: Precisely as forecast, they are ramping up big time. You can see it all over the world, in Egypt, in Asia between China and Japan, in social unrest in Europe, and in the latest news that a record 83 percent of Americans polled are dissatisfied with Congress. That, plus the National Security Agency (NSA) spying on all Americans, is soon going to lead to massive social unrest in this country.
The war cycles point up all the way into 2021, so fasten your seatbelts.
Q: You’ve been forecasting that the U.S. stock market will take a moonshot to Dow 21,000 — even as high as 31,000 — over the next few years. Is that forecast still on target?
A: Absolutely. There is no doubt in my mind we will see the Dow move to at least 21,000 by 2016, and probably much higher. And not despite turmoil in the world, but because of it. The Dow and other blue-chip-type stocks can and often do act just like gold, as a safe haven for capital and as an inflation hedge.
But the Dow has not yet completely broken out to the upside. A sharp, swift correction is overdue. When that comes, I will be giving the signal to back up the truck for stocks. But not until then.
Q: JPMorgan was fined for manipulating the energy market. Are such manipulations routine, and are they present in gold and silver?
A: Yes, it is routine. The big investment bankers are always attempting to manipulate markets. But here’s the important point: Manipulations never, ever change the destiny of the markets. They don’t change the trend, and they certainly cannot reverse major trends. All they do is increase volatility.
So don’t buy into the excuses, for instance, that if it weren’t for some manipulation, gold or silver would never have crashed this year. That’s pure baloney put out by inexperienced traders and analysts, and by dealers who want to blame some outside force to get you to believe that gold and silver’s decline isn’t real, and that if you simply dive into the markets you’ll make money.
Those people — and there are a lot of them —are just trying to line their pockets with fat dealer premiums and commissions, and at your expense.
Q: Comex gold inventories are at or near record lows. Isn’t that bullish for gold?
A: Not necessarily. Think about it. Suppose you own gold at a Comex warehouse and you simply want to store it somewhere else. So you take your gold out and ship it to a private vault in Switzerland. The Comex inventories go down, yet your gold isn’t going back on the market. There’s no net change.
 Or, suppose you’re a jewelry manufacturer and you take delivery of your Comex gold to produce and sell more jewelry. Comex inventory goes down, and your metal ends up on the market as supply, though in fabricated form.
In both cases, Comex inventories go down. In the first, there’s no net change overall in the supply of gold. In the latter, inventories are down but available supplies are up. They offset each other.
Bottom line: The fact that official Comex inventories may be extremely low means nothing. You have to analyze what’s happened to the metal to make the final determination as to whether it’s bullish, bearish or a net nothing.
This is similar to the manipulation discussion above, in the sense that way too many supposedly impartial analysts use low Comex inventories to conjure up a nice logical-sounding sales pitch.
But in reality, they haven’t done their homework, they’ve only looked at half the evidence — and usually their motive is, again, nothing more than to generate a nice commission off you by getting you to buy at almost always the wrong times and prices, and for the wrong reasons.
Q: Some time ago when Germany decided to remove its gold from the New York Federal Reserve’s vaults and start shipping it back home, you said it was bearish for gold. Everyone thought you were nuts. But I just read that Germany sold 25,000 ounces of its gold. Is that a sign of things to come, central bank gold sales?
A: Yes, I believe it is. Look, no matter what you hear, Western central banks have no use for gold and, instead, want to make it obsolete. They want to move the world to an electronic currency that can be fully tracked, traced and taxed.
So to them, gold is a dinosaur that needs to be put in the past, just like they did with silver in the 1960s.
In addition, Europe’s central banks, especially Germany, needs cash and liquidity to fight the European sovereign debt crisis. So you should indeed expect European central bank gold sales going forward.
But importantly, that does not mean gold will go down. It would be more like the period from 1978 to 1980 in the U.S. when our Treasury dumped millions of ounces of gold on the market, and yet gold prices soared.
Why? Because when central banks dump gold for cash, it’s a surefire sign that all is not well with government finances. Investors, always smarter than governments, move in and start buying up what the central banks are forced to dump.
That’s it for now. Stay tuned — my models are showing that this month and next will be pivotal for almost all markets, leading to major trends unfolding and a slew of new profit opportunities.
Best wishes,
Larry

 We have officially entered into uncharted territory. As the markets continue to surge higher, as earnings falter, valuations have once again reached extremes. As my friend Doug Short recently penned:
“Essentially we are in ‘uncharted’ territory. Never in history have we had 20+ P/E10 ratios with yields at the current level, although as I type this, the 10-year yield is at 2.69%, which is 1.26% above its all-time low set in July of last year. The closest we ever came to this in US history was a seven-month period from October 1936 to April 1937. During that timeframe the 10-year yield averaged 2.67%. How did the market fare? The S&P Composite hit an interim high (based on monthly averages of daily closes) in February 1937. The index plunged 44.9% over the next 15 months.
If we look to the Dow daily closes during that period, the index hit an interim high on March 3, 1937 and fell 49.1% to an interim trough on March 31, 1938 — 13 months later.
What can we conclude? As I said above, we’re in ‘uncharted’ territory. Despite increasing references to near term tapering of QE, many analysts assume that continued Fed easing will keep yields in the basement for a prolonged period, thus continuing to promote a risk-on skew to investment strategies despite weak fundamentals.
On the other hand, we could see a negative market reaction to a growing sense that Fed intervention has its downside, especially if Treasury yields continue to rise despite FOMC policy. The recent trend and volatility in the Nikkei in the wake of Japan’s massive monetary intervention could give investors second thoughts about US equities.
We are indeed living in interesting times.”
With the last comment I do readily agree. We live in interesting times, and much like “Alice In Wonderland,” we are indeed all mad here.
This week we will review the markets and our allocation models.
>> Read More. Download This Weeks Issue Here.
Lance Roberts is the General Partner & CEO of STA Wealth Management, Host of the “Streettalk Live” Daily Radio Show (streamed live at www.streettalklive.com), and Chief Editor of the X-Report and the Daily X-Change Blog.
Follow me on Twitter: @streettalklive

WASHINGTON (MarketWatch) — The U.S. central bank is closer to slowing down its $85 billion-a-month asset-purchase program in the wake of Friday’s unemployment data, Richard Fisher, president of the Dallas Fed Bank, said Monday. “With the unemployment rate having come down to 7.4%, I would say that the [Fed] is now closer to execution mode, pondering the right time to begin reducing its purchases, assuming there is no intervening reversal in economic momentum in coming months,” Fisher said in a speech to state retirement administrators in Portland, Ore. Fisher said he urged his colleagues at last week’s Fed policy meeting to “gird our loins to make our first move this fall.” But he didn’t specify whether he meant the policy committee’s next meeting in September or at the following meeting in October. The Dallas Fed president is not a voting member this year. He has opposed the third round of asset purchases, also known as quantitative easing. In his speech, Fisher said the Fed does not seem to have achieved much in terms of job creation with the trillions of dollars it’s poured into the economy.

Gold’s Price Moves from Different Perspectives
When we take into account last week’s events, it seems that the yellow metal is more sensitive to signs of tapering than any other asset. According to Reuters, gold slipped to a two-week low on Friday after falling through a key technical level near $1,300 as strong U.S. economic data raised fears that the Federal Reserve may start to taper its commodities-supportive stimulus measures. Losses pushed gold towards its worst weekly performance in a month. However, the shiny metal rebounded sharply from a low at $1,285 to $1,317 after weaker than expected US non-farm payrolls.
Does it mean that the Federal Reserve may have to push back plans to taper the current round of quantitative easing? A push-back of the plans is believed to be bearish for the US dollar and bullish for gold. Will we see a bullish scenario in the precious metals market? Or maybe recent gains are just a result of speculation and gold’s position will deteriorate?
In our previous essay we wrote that if you want to be an effective and profitable investor, you should look at the situation from different perspectives and make sure that the actions that you are about to take are really justified. That’s why in today’s essay we examine the gold chart from the European perspective and we check how gold stocks move relative to gold. Do they provide us with interesting clues as to the next possible moves in the entire sector? Let’s take a closer look at the charts below and find out for ourselves (charts courtesy by http://stockcharts.com).
We hit off with a short recap of what’s been going on with the Euro Index recently. After an invalidation of the bearish head-and-shoulders pattern on July 10, the European currency continued its rally throughout the next two weeks. Although the euro climbed up and improved its position, the buyers didn’t manage to push it above the 133 level on July 25. This psychological resistance level slowed the rally and triggered a consolidation.
At this point, it’s worth mentioning that this price action in the euro led to further weakness in the dollar. Although these changes should have had bullish implications for gold, the yellow metal didn’t move sharply above the highs it had established on July 23 and July 24. In the following days, metals declined even though the dollar moved lower which is a strong bearish sign.
Another bearish factor on the above chart is the declining resistance line based on the January top and the June peak. We saw its impact on the euro last Wednesday. The European currency touched this declining resistance line without breaking it. From this perspective, it seems that the top may very well be in, which is a bearish factor for the precious metals sector.
In the recent days, the Euro Index declined below the 132 level and is still trading below the previously mentioned 133 level. If the euro declines further, we might see another head-and-shoulders pattern on a smaller scale.
The combination of the psychological resistance level and the above-mentioned declining resistance line may have encouraged sellers to go short and thus trigger a correction. In this case, the Euro Index will likely bounce off the psychological resistance level at 133 once again. If we see such a bearish scenario, it would likely lead to a strengthening in the dollar which could then lead to medium-term weakness in precious metals.
Once we know the current situation in the European currency, let’s take a closer look at gold priced in the euro.
On the above chart, we see that the situation hasn’t changed much from what we saw in the previous weeks. Gold priced in euro remains below the 50-day moving average, which still serves as resistance. Moreover, the yellow metal didn’t break out above the previously broken, important long-term support line which turned into resistance.
Therefore, from the European perspective, the situation looks quite bearish for the short term and it doesn’t look too optimistic. However, if we want to have a more complete picture of the situation, we should examine another factor which is used to provide important signals for the precious metals market – the way gold stocks move relative to gold.
Let’s start with the HUI-to-gold ratio, which is one of the more interesting ratios there are on the precious metals market. After all, gold stocks used to lead gold both higher and lower for years (which wasn’t the case on a very short-term basis in the past few months).
On the above chart we see that the ratio moved above the 50-day moving average in the middle of the June. However, the breakout didn’t change the outlook. The gold-stocks-to-gold ratio still remains below the 2008 bottom. Despite the moves up we saw in July, the breakdown has not been invalidated and the downtrend still appears to be in play here. A downtrend in this ratio indicates that the gold stocks are underperforming gold, not outperforming it.
At this point, it’s worth mentioning that in the gold-stocks-to-gold ratio chart, we didn’t see a continuation of strength last week. Instead of further increases, we saw declines which resulted in a big drop in the HUI:gold ratio on Friday. In this way, the ratio moved below the 50-day moving average which now serves as resistance.
Before we summarize, let’s take a look at the GDX-to-GLD ratio chart.
In the medium-term miners-to-gold ratio chart, we initially saw a breakout above the declining resistance line. However, the RSI level was close to 70. When you take a closer look at the top of the chart, you will see that this level coincided with local peaks in the ratio this year, and the same was seen throughout the precious metals sector.
The following decline (we see it clearly on the above chart) is consistent with our previous observations. The fact that we did not see a huge drop in the recent days doesn’t mean that we won’t see one in the near future. We saw similar price action at the beginning of the June. After a slight decline, there was a major one.
In other words, the previous breakout (in June) was followed by a decline, so the current one is not as bullish as it might seem at first sight.
Summing up, the situation is quite bearish for the short term from the European perspective, and it doesn’t look too optimistic – especially when we take into account the combination of the psychological resistance level at 133 and the strong declining resistance line. The outlook for the mining stocks is also bearish and the trend is still down. The long-term breakdowns have not been invalidated and it seems that lower prices for the whole precious metals sector could follow soon.
Thank you for reading. Have a great and profitable week!
Przemyslaw Radomski, CFA
Founder, Editor-in-chief
Gold Investment & Gold Trading Website – SunshineProfits.com
* * * * *
Disclaimer
All essays, research and information found above represent analyses and opinions of Przemyslaw Radomski, CFA and Sunshine Profits’ associates only. As such, it may prove wrong and be a subject to change without notice. Opinions and analyses were based on data available to authors of respective essays at the time of writing. Although the information provided above is based on careful research and sources that are believed to be accurate, Przemyslaw Radomski, CFA and his associates do not guarantee the accuracy or thoroughness of the data or information reported. The opinions published above are neither an offer nor a recommendation to purchase or sell any securities. Mr. Radomski is not a Registered Securities Advisor. By reading Przemyslaw Radomski’s, CFA reports you fully agree that he will not be held responsible or liable for any decisions you make regarding any information provided in these reports. Investing, trading and speculation in any financial markets may involve high risk of loss. Przemyslaw Radomski, CFA, Sunshine Profits’ employees and affiliates as well as members of their families may have a short or long position in any securities, including those mentioned in any of the reports or essays, and may make additional purchases and/or sales of those securities without notice.

-
I know Mike is a very solid investor and respect his opinions very much. So if he says pay attention to this or that - I will.
~ Dale G.
-
I've started managing my own investments so view Michael's site as a one-stop shop from which to get information and perspectives.
~ Dave E.
-
Michael offers easy reading, honest, common sense information that anyone can use in a practical manner.
~ der_al.
-
A sane voice in a scrambled investment world.
~ Ed R.
Inside Edge Pro Contributors

Greg Weldon

Josef Schachter

Tyler Bollhorn

Ryan Irvine

Paul Beattie

Martin Straith

Patrick Ceresna

Mark Leibovit

James Thorne

Victor Adair