
Stocks & Equities
Can It Get Any Better Than This?
A Korean Black Swan?
Maine, Montana, San Antonio, and Bismarck
What in the world is going on?! As I write this letter from the Maine woods, the S&P 500 has just cleared 1,700 for the first time. The German DAX continues to set all-time highs above 8,400. The United Kingdom’s FTSE 100 is quickly approaching its 1999 record high of 6,930, and its mid-cap cousin, the FTSE 250, just broke through to its all-time level above 15,000. And last but not least, Japan’s Nikkei 225 is extending its gains once more, toward 14,500. This weekend I am sitting around with some of the smartest economic and trading minds in the country. At Leen’s Lodge, where we’re fishing and eating where our phones don’t work, the question on our minds is, how long can this run go on? The debates can get intense in a room full of strong opinions.
So, with a little help, I did some research on what our forward-looking prospects are for the markets. Let me take this opportunity to introduce a new name to readers, one that will become familiar over the next few years. I have gotten to know Worth Wray, a young economist (though I should say that, as I stare 64 in the face, a lot of people are looking young these days) who has really impressed me with the breadth of his knowledge and insights. He was the former portfolio strategist for my good friends at Salient down in Houston, and they were kind enough to let me entice him to come to Dallas to work with me. This is a big move for both of us, and I am finding that it’s one I should have undertaken a long time ago. Worth is really going to help me expand my abilities to do research and present my thoughts to you. I asked him a few questions, and he helped me tee up this week’s letter. Plus, we’ll look across the Pacific, and I’ll share some though ts I’ve had about an interesting black swan that could be developing in the Korean Peninsula. Let’s get started!
Can It Get Any Better Than This?
To many investors, developed markets appear healthier and stronger than they have in years. Major equity markets are rallying to record highs; corporate credit spreads are tight versus US Treasuries and getting tighter; and broad measures of volatility continue to fall to their lowest levels since 2007.
This kind of news would normally point to prosperity across the real economy and call for a celebration – but prices do not always reflect reality. Moreover, the combination of high and rising valuations, low volatility, and a weakening trend in real earnings growth is a proven recipe for poor long-term returns and market instability.
Let’s take the S&P 500 as an example. It returned roughly 42% from September 1, 2011, through August 1, 2013, as the VIX Index fell to its lowest levels since the global financial crisis. Over that time frame, real earnings declined slightly (down about 2% through Q1 2013 earnings season), while the trailing 12-month price-to-earnings (P/E) ratio jumped 44%, from 13.5x to 19.5x. That means the majority of the recent gains in US equity markets were driven by multiple expansion in spite of negative real earnings growth. This is a clear sign that sentiment, rather than fundamentals, is driving the markets higher.
Of course, the simple trailing 12-month P/E ratio can be misleading at critical turning points if you are trying to handicap the potential for long-term returns. For example, the collapse in real earnings during the global financial crisis sent the S&P 500’s trailing P/E multiple through the roof by March 2009. So, while trailing P/E is a useful tool for understanding what has already happened in the market, the “Shiller P/E” is far more useful for calculating a reasonable range of expected returns going forward. This approach won’t help you much with short-term market timing, but current valuations have historically proven extremely useful in forecasting long-term returns. In his bookIrrational Exuberance (2005), Robert Shiller of Yale University shows how this approach “confirms that long-term investors – investors who commit their money to an investment for ten full years – did do well when prices were low rel ative to earnings at the beginning of the ten years. Long-term investors would be well-advised, individually, to lower their exposure to the stock market when it is high … and to get into the market when it is low.”
As you can see in Figure 6, compared to the more common trailing 12-month P/E ratio in Figure 5, the Shiller P/E metric essentially smooths out the series and helps us avoid false signals by dividing the market’s current price by the average inflation-adjusted earnings of the past ten years. Historically, this range has peaked and given way to major market declines at around 29x on average (or 26x excluding the dot-com bubble), and it has bottomed in the mid-single digits. Not only does today’s Shiller P/E of 24x suggest a seriously overvalued market, but the rapid multiple expansion of the last two years in the absence of earnings growth suggests that this market is also seriously overbought.
John Hussman helps us keep current valuations in historical perspective:
The Shiller P/E is now 24.4, about the same level as August 1929, higher than December 1972, higher than August 1987, but less extreme than the level of 43 that was reached in March 2000 (a level that has been followed by more than 13 years of market returns within a fraction of a percent of the return on Treasury bills – and even then only by revisiting significantly overvalued levels today). The Shiller P/E is presently moderately below the level of 27 at the October 2007 market peak. It’s worth noting that the 2000-2001 recession is already out of the Shiller calculation. Moreover, looking closely at the data, the implied profit margin embedded in today’s Shiller P/E is 6.3%, compared with a historical average of only about 5.3%. At normal profit margins, the current Shiller P/E would be 29.
While it may be impossible to accurately predict when this policy-driven market will break, history suggests it would be very reasonable for the secular bear to eventually bottom at a P/E multiple between 5x and 10x, opening up one of the rare wealth-creation opportunities to deploy capital at truly cheap prices. Some of these technical details are rather dry, but I hope you’ll focus on the main idea: We are not talking about the potential for a modest 20% to 30% drawdown in the S&P 500. If history is any indication, we are talking about the potential for a 50%+ peak-to-trough drawdown and ten-year average annual returns as bad as -4.4%, according to the chart above from Cliff Asness at AQR. Such a result would fall in line with somewhat similar deleveraging periods such as the United States experienced in the 1930s and Japan has experienced since 1989. There is no way to sugarcoat it: too much equity risk can be unproductive and even destructive in this kind of economic environment.
But where there is danger, there is also opportunity. This is a terrific time to take some profits and diversify away from the growth-oriented risk factors that dominate most investors’ portfolios. Instead of concentrating risk in one asset class or one country, investors can boost returns and achieve more balance by taking a global view, by broadening the mix of core asset classes, and by weighting those return streams to achieve balance across potential economic outcomes (rather than trying to predict the future). Since equities and credit are essentially a directional bet on positive economic growth and benign inflation, you have a lot to gain from diversifying into other core market risks: commodities, which thrive when inflation, or more specifically expected inflation, is rising; and nominal safe-haven government bonds, which thrive as inflation gives way to deflation and the oth er assets typically decline. While each group of asset classes responds to economic conditions differently and exhibits low correlations to the others, each of them tends to offer similar risk-adjusted returns over long periods of time, thus warranting constant inclusion in any core portfolio.
It also makes sense to embrace truly diversifying alternative strategies that are either less correlated or negatively correlated. When valuations are expensive across the board, momentum-based strategies like managed futures can be a fantastic addition to a portfolio. Aside from government bonds, momentum is the only easily accessible strategy that tends to become more negatively correlated with broader markets during times of extreme stress and tends to deliver outsized returns when your other investments are losing money.
Of course, combining the asset classes into one portfolio is the hard part, but research going back to the early 1970s suggests that broadening this mix of core assets – so that you have some element of your portfolio that responds positively to every potential economic season – and managing the relative allocations to each economic scenario may be your biggest opportunity to add value in the investing process.
You have a lot to gain from diversifying as broadly as possible, eliminating unrewarded costs, reducing your reliance on equity risk, and reining in the emotional mistakes that often lead investors to dramatically underperform. Remember, in a world characterized by deleveraging, changing demographics in aging populations, financial repression, and increasingly experimental monetary policy, every basis point counts and anything can happen.
With that, let’s end our discussion with a few words of advice from the world’s largest and arguably most successful hedge fund manager, Ray Dalio:
What I’m trying to say is that for the average investor, what I would encourage them to do is to understand that there’s inflation and growth. It can go higher and lower and to have four different portfolios essentially that make up your entire portfolio that gets you balanced. Because in every generation, there is some period of time, there’s a ruinous asset class, that will destroy wealth and you don’t know which one that will be in your life time. So the best thing you can do is have a portfolio that is immune, that is well diversified. That is what we call an all-weather portfolio. That means you don’t have a concentration in that asset class that’s going to annihilate you and you don’t know which one it is.
A Korean Black Swan?
Last week I was in Newport, Rhode Island, at the Naval War College, where I participated in a summer study group focused on possible futures and how they might affect the strategy of the US Defense Department. The discussions were wide-ranging and mind-expanding, at least for me. As readers know, I believe that Japan has begun a long-term process of continually devaluing its currency. For reasons I have written about at length in previous letters, I think the yen could go to 200 to the dollar in the next five years. I don’t see a precipitous move, simply a steady erosion as Japan tries to bring back inflation and export its deflation.
While the yen at its current valuation is not a particular problem for the rest of the world, when it hits 120 we will start to see raised eyebrows and political speeches from the countries most affected. At 140 we could start to see serious reactions.
One of the countries that I think is put into a most difficult situation is South Korea. Their options for responding to a weakening yen are quite limited. If they respond by printing more of their own currency, they are likely to engender a debilitating inflation, which is of course not a good thing. Protectionism will have little real effect vis-à-vis Japan. Remember that the Japanese yen was 357 to the dollar about 40 years ago. The Japanese watched their currency rise by almost 400% in the decades since. The only real response available to them was to simply become more competitive and more productive as their currency got stronger, and to their great credit they did.
Honing their competitive edge may also be the only real option for South Korea. But it is not an easy one, of course, and you will hear lots of complaints from Korean politicians and businessmen. Not an easy environment, to be sure.
Now let’s shift our focus to North Korea. Everyone (including your humble analyst) is worried about the isolationist regime in North Korea having access to nuclear weapons and the ability to deliver them on missiles. But a few conversations I had this past week led me to think there is another scenario we should consider.
A side conversation at the study group began with an observation by a senior officer about the ability of the North Korean military to actually project power. As this information is nothing more than what you can find in the newspapers, I feel comfortable discussing it here. Everyone knows that North Koreans have been malnourished for multiple decades. Studies suggest that North Koreans may be up to three inches shorter than South Koreans and have diminished IQs because of malnourishment as children. The latter is a known effect on human beings anywhere who are subjected to a starvation diet. The North Korean population has suffered from severe diet restriction for decades.
How capable is the North Korean military of actually mounting an offensive when their soldiers are simply not physically able to withstand the pressures of combat? I was also able last week to visit with one of the great geopolitical strategists of our time, Professor Ian Bremmer of Columbia, who is the president and founder of Eurasia Group, with some 100 geopolitical analysts working for him. I shared with him my concerns about the Korean peninsula. He immediately said that he was more worried about the Korean peninsula than any other part of the world, including the Middle East. One of the interesting things that he shared is that an increasing number of cell phones are being smuggled into North Korea from China and that the North Koreans are beginning to get the real story about the world rather than just the propaganda fed to them by their government.
While there is little ability for the North Korean population to actually stage a revolution, as they do not have the weapons and hungry people really have difficulty mounting military operations, there is the possibility of the country becoming increasingly difficult to manage. Combine that with the potential for a disastrous food-production year, and the potential for the collapse of the government is not all that far-fetched.
There were not many people forecasting the collapse of the USSR in 1987. Yet as we look back, the confluence of causes that resulted in its collapse seems rather obvious. Probably, the current dictatorship will maintain its stranglehold on North Korea. That is the tendency with repression and tyranny – witness Cuba and any number of other countries. But one cannot dismiss the possibility of a collapse of the North Korean state.
If that were to happen it would be a humanitarian disaster. In the long run it might be better for the North Korean people, but in the short run it would be catastrophic. It is not unreasonable to expect that South Korea would have to do the bulk of the heavy lifting, especially after the first year or so. And should the world no longer have to focus on the ability of North Korea to create mischief with nuclear weapons, North Korea could soon become page 16 news.
No matter how positively you would want to view Korean unification, the process would be enormously expensive for South Korea. Assimilating a population long challenged by hardship into a new reality, not to mention incorporating it into a modern economic model, is a daunting challenge. I think the task would be more difficult and more expensive on a per-capita basis than the unification of Germany.
And this could happen while the attention of South Korea is focused on dealing with the devaluation of the yen and the need to become progressively more competitive to maintain its export and business model. There is also the possibility of massive refugee movements into China. That is a significantly different issue than worrying about a million-man army crossing the DMZ into South Korea.
I’m not saying this will happen, but it is a possibility we need to keep an eye on.
Maine, Montana, San Antonio, and Bismarck
I’m at Leen’s Lodge in Grand Lake Stream, Maine, at “Camp Kotok,” with about 50 people from all areas of the financial sector: money managers, traders, writers, real economists (as opposed to your humble analyst), financial media, Federal Reserve economists, and other guests. Old friends whose names are familiar to my readers have become regulars here – people like Paul McCulley, Barry Ritholtz, Jim Bianco, David Rosenberg, Mike McKee of Bloomberg, Bill Dunkelberg (chief economist of the National Federation of Independent Businesses), Phillipa Dunne of the Liscio Report, and others too numerous to mention. David Kotok of Cumberland Advisors organizes the event and masterfully crafts the mix of guests and the agenda for the long weekend. Some people have referred to this group as the Shadow Fed, but that is far too serious a moniker for what really happens here. This is one of the more fascin ating discussion groups I ever get to participate in, and I always learn a great deal. I should note that at least ten of our group are women, which makes it somewhat unusual for a financial-industry gathering, but it’s a trend I would like to see more of.
This is the seventh year I’ve attended, and each year I’ve come with my youngest son, Trey. He was 12 the first year we came and is now 19. He has grown up with these men and women. Being with my son each year has made this a very special week in my life. Each year’s event is an emotional and very personal measuring stick as I watch him grow up. The annual competition to see who among us will catch the most fish is a small part of the experience, but Trey does not let me forget that he has won for six years in a row. After our first rain-soaked half-day of fishing, I am ahead by one, but there are two more full days ahead. Watching him grow up here is very special. There is a part of me that hopes he catches at least one more fish than the old man. But I will never tell him that.
Grand Lake Stream is in the middle of Washington County, Maine, which is about the size of Connecticut yet has only 30,000 people. As it turns out, it is also the poorest county east of the Mississippi. Who knew? Local officials assure me that our gathering of economists is one of the biggest financial events for the area each year. In a few weeks they are going to announce what is a fascinating economic experiment. The state of Maine is going to make the entire county an enterprise zone. They are going to eliminate all taxes in the county – every last corporate, personal, and sales tax. As one former state official told me tonight, the state gets such a small amount of taxes from this county that eliminating the taxes won’t affect the state budget whatsoever. And the poverty here is quite real. I will give you an update, down the road, on whether the Washington County experiment makes a difference. My philosophical bet is that it will. In a few years the results will not be just philosophical but something we can all see.
As long as I keep getting an invitation to return, I intend to spend the first weekend of every August in Maine. It is truly a slice of heaven and one of the gatherings I most look forward to every year.
We go back home on Monday, and then the next week I’m off to Montana with Darrell Cain for a week to read, relax, and gather my thoughts. At the end of the month I go to San Antonio for the World Science Fiction Convention (WorldCon), where I get to play groupie for a few days. Then in the middle of the month I will go to Bismarck, North Dakota (details later), and hopefully make a side trip to South Dakota, which will allow me to finally say that I have been in all 50 states.
It is time to hit the send button, as the group is gathering for Lobster Night. Charles Driza, the owner of Leen’s Lodge, and his staff provide fabulous gourmet meals. And the conversation is even better. Have a great week and find a few friends and family to be with. That time is an investment where the valuation is always rising.
Your soaking up the beauty of Maine analyst,

John Mauldin
subscribers@MauldinEconomics.com
Copyright 2013 John Mauldin. All Rights Reserved.

When Federal Reserve officials speak, markets listen. And there will be a lot of listening this week.
“The most important events for the market this week are the Fed speakers,” said Bricklin Dwyer, an economist at BNP Paribas.
On Tuesday, Charles Evans, the president of the Chicago Fed, will sit down with reporters. On Wednesday, Philadelphia Fed President Charles Plosser and Cleveland Fed President Sandra Pianalto will take their turns in the spotlight.

European stocks advanced for a sixth day, the longest winning streak this year, as services output shrank at a slower pace than initially estimated last month. U.S. index futures were little changed, while Asian shares fell.
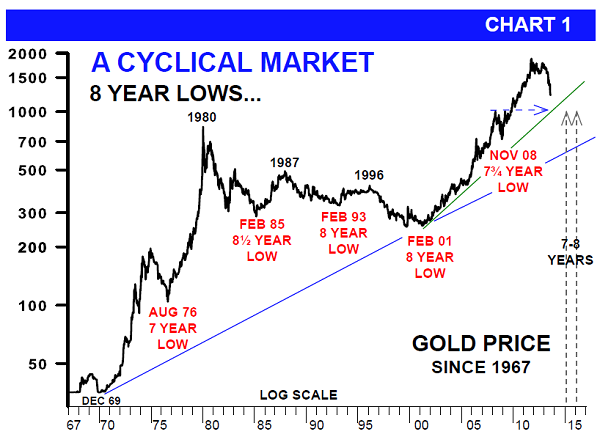
Given gold’s retreat during 2013, it would seem the Midas Metal’s best days are behind it, at least for a while.
But nothing is further from the truth. The strong demand for gold has not gone away.International investors, central banks and corporations are all looking to buy gold and these low Summer months are likely providing the best price.
Asian investors, especially in China and India, are buying coins and bullion like mad. Sales are up 22% annually in China and 52% in India.
Gold analyst Jim Willie said it best when he said, “The migration of gold from West to East is the grand story of the decade.” They know, as our dear friend Richard Russell recently reminded us, that gold and international power still go hand in hand.
Ed Note: Much more HERE including an explanation of this chart:

The Equities Bull Market is about to End & it will be a big Mess
Speaking to attendees at the fourth annual Innovative Alternative Investments conference in Denver yesterday, Jim Rogers said “I’ve never seen a bull market [in any asset class] that goes on forever,” Rogers said. “There may be one, but I’ve never heard of it.”
Speaking of the current bull market in U.S. equities, Rogers told advisors, “Enjoy it, but be prepared. I do know it will end, but not when. We’re getting close to the end.”
The day that happens won’t be a pretty one. “When it ends it will be a big mess,” he continued. “This will be worse than 2001 and 2008-2009.” – via The Financial Asvisor Magazine
GOLD : could fall to $900 an ounce, we have not had the final bottom yet
“Gold has gone up 12 years in a row, which is terribly unusual for any asset, so it would be an anomaly if there was not a correction.”Rogers believes the correction should be around 50% of the peak (which was $1,950 in September 2011), which is where he gets his $900 figure from.“I fully expect the bull market to end in a bubble some day, and some day is not here yet,”“if it falls or if it gets down [to $900], then I hope I will be smart enough to buy more.”I don’t think in a recent The Financial Times interview we’ve had the final bottom in gold but we must be nearing it in sugar. Sugar is down 75% from its all-time high – there’s not much in the world that is down 75%.” –
Jim Rogers on Commodities, The Agriculture Boom, & Perilous times ahead
Friday, July 26, 2013
Sunday, August 4, 2013
Jim Rogers: Bubbles can go on and on. Hard to tell when it pops
About Jim Rogers
 Jim Rogers started trading the stock market with $600 in 1968.In 1973 he formed the Quantum Fund with the legendary investor George Soros before retiring, a multi millionaire at the age of 37. Rogers and Soros helped steer the fund to a miraculous 4,200% return over the 10 year span of the fund while the S&P 500 returned just 47%.

-
I know Mike is a very solid investor and respect his opinions very much. So if he says pay attention to this or that - I will.
~ Dale G.
-
I've started managing my own investments so view Michael's site as a one-stop shop from which to get information and perspectives.
~ Dave E.
-
Michael offers easy reading, honest, common sense information that anyone can use in a practical manner.
~ der_al.
-
A sane voice in a scrambled investment world.
~ Ed R.
Inside Edge Pro Contributors

Greg Weldon

Josef Schachter

Tyler Bollhorn

Ryan Irvine

Paul Beattie

Martin Straith

Patrick Ceresna

Mark Leibovit

James Thorne

Victor Adair