
Currency
According to Reuters, gold is often seen as an inflation hedge (while it is really a system hedge in our opinion) and this safe-haven investment, has fallen nearly 20% this year on fears of an end to easy central bank money, which had propelled it to record highs in 2011.
On Wednesday, after the Fed said it would stick to its stimulus plan for now, the yellow metal gained more than 4%, leading the rally in commodities. Yesterday, gold rose to a new one-week high and extended the previous session’s rally, lifted by technical buying and short-covering.
What happened with the US dollar?
The USD Index lost over 1% and declined slightly above the 80 level on Wednesday. It’s worth noting that this is its biggest one-day slide in more than 2 months. Additionally, we saw such low values in February, well before Fed Chief Ben Bernanke first floated the idea of tapering the stimulus back in May.
Today, gold slipped a bit, but is still trading around $1,360 an ounce. Can the yellow metal climb higher in the near term? Will the dollar recover quickly? Can we find any guidance in the charts?
In today’s essay we’ll examine the US Dollar Index (from many perspectives and the long-term gold chart to see if there’s anything on the horizon that could drive gold prices higher or lower in the near future. We’ll start with the USD Index very long-term chart to put the following gold chart into perspective (charts courtesy by http://stockcharts.com.)
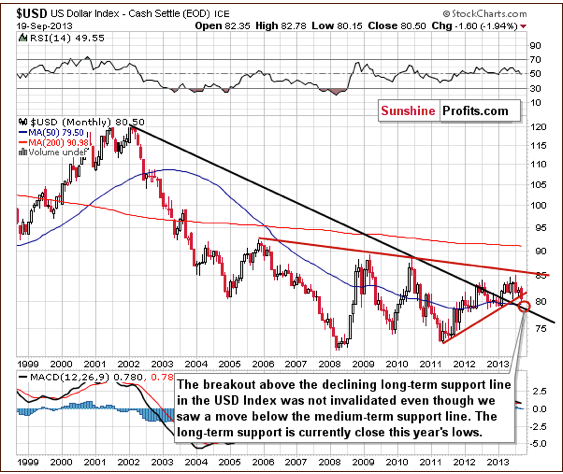
The situation in the long-term chart has changed (for the first time in several months), but the most important thing didn’t change. The long-term breakout above the declining long-term support line was not invalidated, even though the USD dropped heavily on Wednesday.
However, since the medium-term breakdown (below the support line marked with red) is visible from this perspective, we could see some short-term weakness anyway. Still, it seems that the long-term support line will stop the decline, so from the long-term perspective, it seems that the downside is quite limited.
Now, let’s examine the weekly chart.
On the above chart, we see the breakdown more clearly. The breakdown is unconfirmed at this point, and we could still see a reversal back above the previously-broken support/resistance line. It would be a powerful bullish signal, but it seems more likely that we will see another move lower first. This is due to the size of Wednesday’s move without a visible intra-day pullback.
The target area is quite unclear because of the multiple support lines, including the long-term support line seen on the previous chart. It seems that we could see the US Dollar Index in the 78-79 range before the bottom is in.
Again the exact price target is unclear.
Let’s check the short-term outlook.
On the short-term chart, we see that the target area is close to the 79 level. The present cyclical turning point makes the situation extreme and difficult to trade as we could see a powerful pullback immediately even if the target area isn’t reached.
Additionally, please note that even though the USD Index has declined heavily in September, we also have gold visibly lower than it was at the beginning of the month.
Is another move lower on a very short-term basis likely? It is – based on the True Seasonals pattern that has been working very well in the past few months.
Let’s take a closer look at our new tool.
Please note that we saw a visible decline prior to the first part of August after which we saw an upswing which lasted until early September. This has been followed by a significant decline, which is precisely what the True Seasonal patterns were suggesting.
Right now, they are suggesting another small move lower in the final part of this month.
Taking the previously mentioned support levels into account, it seems that the move lower could be more significant, but it will be approximately in tune with the True Seasonals pattern.
Please note that the quality of the prediction (green line in the lower part of the above chart) declines in the final part of the month, which means that a deviation (in the form of a bigger decline) is not unlikely.
Consequently, even though the direct impact that the USD Index is likely to have on gold is rather unclear at this time, it seems more likely than not that the impact will be bullish in the very near term (in the next several days).
Once we know the current situation in the U.S currency and the True Seasonal patterns’ suggestions on future movements in the dollar, let’s find out what happened during the recent days and check the current situation in gold.
(Click for Larger View)

On the long-term gold chart, we see that Wednesday’s rally was not as bullish as it seemed at first sight. In spite of the strong daily upward move, which pushed gold above $1,360, the situation hasn’t changed much from this perspective.
As you see on the above chart, gold verified the breakdown below the long-term resistance line created by the July 2005 and the October 2008 bottoms (taking intraday bottoms into account). At this point, it’s worth noting that there was an invalidation of the breakout above the 38.2% Fibonacci retracement level based on the September 2012 – June 2013 decline earlier this month. This was a bearish sign.
From this point of view, it seems that even if gold increases once again in the coming days and reaches the above-mentioned levels once again, the medium-term outlook will continue to be bearish.
Please note that in 2008, when gold moved higher before plunging for the final time, there were several intra-week attempts to move higher after which gold finally declined. Therefore, a double top pattern should not surprise us here. The same goes for a triple top.
Summing up, on Wednesday, we saw a substantial price move on the gold’s and the dollar’s charts. However, these moves were significant only on a very short-term basis. Examination of the above charts reveals that they didn’t change the long-term and the medium-term tendencies. Despite Wednesday’s strength, the downward trend in gold remains in place even though we could see some short-term strength shortly. Taking into account the long-term breakout in the US dollar, the long-term outlook for the USD Index remains bullish, even though we could see additional weakness in the very short term., as indicated i.a. by the True Seasonal charts.
Thank you for reading. Have a great and profitable week!
Przemyslaw Radomski, CFA
Founder, Editor-in-chief
Gold Price Projection Website – Sunshine Profits
* * * * *
Disclaimer
All essays, research and information found above represent analyses and opinions of Przemyslaw Radomski, CFA and Sunshine Profits’ associates only. As such, it may prove wrong and be a subject to change without notice. Opinions and analyses were based on data available to authors of respective essays at the time of writing. Although the information provided above is based on careful research and sources that are believed to be accurate, Przemyslaw Radomski, CFA and his associates do not guarantee the accuracy or thoroughness of the data or information reported. The opinions published above are neither an offer nor a recommendation to purchase or sell any securities. Mr. Radomski is not a Registered Securities Advisor. By reading Przemyslaw Radomski’s, CFA reports you fully agree that he will not be held responsible or liable for any decisions you make regarding any information provided in these reports. Investing, trading and speculation in any financial markets may involve high risk of loss. Przemyslaw Radomski, CFA, Sunshine Profits’ employees and affiliates as well as members of their families may have a short or long position in any securities, including those mentioned in any of the reports or essays, and may make additional purchases and/or sales of those securities without notice.

Despite a dramatic increase in the Fed’s balance sheet, the Producer and Consumer Price Indexes are subdued
Robert Prechter created this chart for a speech he gave to the Market Technicians Association in April 2013, which is reprinted in the July-August Elliott Wave Theorist. He used the chart to address the often-voiced fear that runaway inflation is just around the corner because, via quantitative easing, the Federal Reserve has been manufacturing new banknotes and swapping them for the debts of others – a process that inflates the supply of dollars.
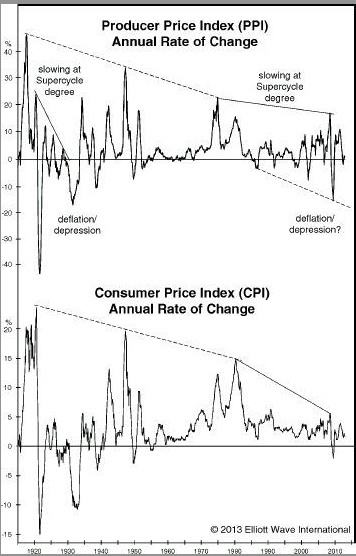
The Fed has been inflating the supply of dollars at a stunning 33% annual rate over the past five years. It plans to continue doing so at least through the end of this year and has kept open the possibility that it will do so indefinitely. This is the policy upon which those predicting runaway inflation are basing their arguments. With this dramatic a rise, it’s no wonder investors expect inflation and have aggressively positioned for it.
Look just about anywhere else, however, and you will see subtle evidence of deflationary pressures. Given knowledge only of the Fed’s inflating, many people would expect the Producer and Consumer Price Indexes to be rising at a rate of 33% annually. But, as you can see in [the chart], the PPI’s annual rate of change is stuck at zero and the CPI has been rising at only a 2% rate.
— The Elliott Wave Theorist, July-August 2013
Everyone else is talking about inflation, but deflation is the real threat they should be concerned with.
Elliott Wave International have created a report that spells out the dangers of deflation and you can have it on your screen with just a few clicks — free! See below for full details.
Learn Why Deflation Is the Biggest Threat to Your Money Right Now
Discover Robert Prechter’s views on the unfolding deflationary trend by reading the 90-page report, The Guide to Understanding Deflation. This guide will help you survive a major deflationary trend, and even equip you to prosper.
Plan and prepare for your financial future. Download Your Free 90-Page Deflation Survival Guide eBook >>


“There is a chance that this was a bull trap. If it’s down again tomorrow, then the chances of that increase.” – www.toddmarketforecast.com
Todd Market Forecast for Thursday September 19, 2013
Available Mon- Friday after 6:00 P.M. Eastern, 3:00 Pacific.
DOW – 40 on 500 net declines
NASDAQ COMP + 6 on 250 net declines
SHORT TERM TREND Bullish
INTERMEDIATE TERM TREND Bearish
STOCKS: Not much to say about today. It was a consolidation day and there was some profit taking. Some were saying that the economy remains weak, otherwise the Fed would have tapered.
There is a chance that this was a bull trap. If it’s down again tomorrow, then the chances of that increase. A bull trap is a high volume surge to new highs that marks a peak of sorts.
GOLD: Gold added a few dollars to yesterday’s explosion.
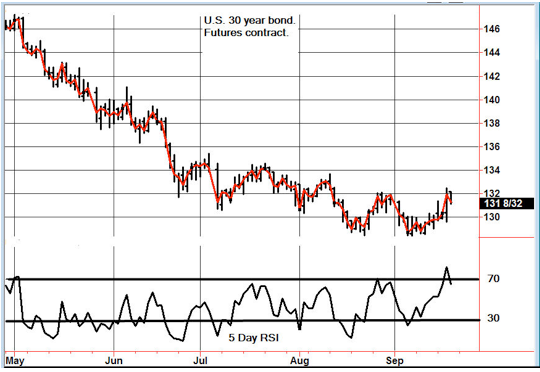
CHART: This is a very interesting chart. Bonds have been going down since May in spite of Fed buying. In other words, longer term interest rates are increasing regardless what the Fed wants. We’re going to go back on a sell for now. If bonds move to 133, it will push us back to the bullish camp.
TORONTO EXCHANGE: Toronto lost 5.
S&P\TSX Venture Comp: The Venture Comp was flat for the session.
BONDS: Bonds gave back some of yesterday’s sharp gains.
THE REST: The dollar collapsed. Silver, copper and crude oil were sharply higher.
BOTTOM LINE:
Our intermediate term systems are on a sell signal.
System 2 traders We are in cash. Stay there on Friday.
System 7 traders We are in cash. Stay there on Friday.
NEWS AND FUNDAMENTALS:
Initial claims were 309,000, less than the expected 341,000, but again, the data was not complete. The Philadelphia Fed Survey was 22.37, better than the expected 10.0. Existing home sales were 5.48 million, more than the expected 5.255 million.
———————————————————————————————————–
We’re moving back to a sell for bonds as of today September 19.
We’re on a sell for the dollar and a buy for the euro as of September 18.
We’re on a buy for gold as of September 18.
We’re on a buy on silver as of September 18.
We’re on a sell for crude oil as of August 29.
We’re on a sell for copper as of August 29.
We’re on a buy for the Toronto Stock Exchange as of August 23.
We are on a buy for the S&P\TSX Venture Comp. as of August 16.
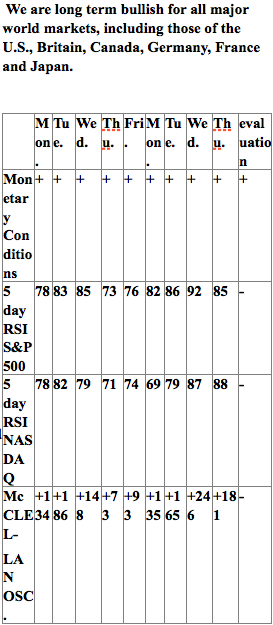 INDICATOR PARAMETERS
Monetary conditions (+2 means the Fed is actively dropping rates; +1 means a bias toward easing. 0 means neutral, -1 means a bias toward tightening, -2 means actively raising rates). RSI (30 or below is oversold, 80 or above is overbought). McClellan Oscillator ( minus 100 is oversold. Plus 100 is overbought). Composite Gauge (5 or below is negative, 13 or above is positive). Composite Gauge five day m.a. (8.0 or below is overbought. 13.0 or above is oversold). CBOE Put Call Ratio ( Below .80 is a negative. Above 1.00 is a positive). Volatility Index, VIX (low teens bearish, high twenties bullish), VIX % single day change. + 5 or greater bullish. -5 or less, bearish. VIX % change 5 day m.a. +3.0 or above bullish, -3.0 or below, bearish. Advances minus declines three day m.a.( +500 is bearish. – 500 is bullish). Supply Demand 5 day m.a. (.45 or below is a positive. .80 or above is a negative).
No guarantees are made. Traders can and do lose money. The publisher may take positions in recommended securities.
About The Todd Market Forecast
RANKED # 1 BY TIMER DIGEST
Timer Digest of Greenwich, CT monitors and ranks over 100 of the nation’s best known stock market advisory services.
Once per year in January, Timer Digest publishes the rankings of all services monitored for multiple time frames.
For the years 2003, 2004 and 2005, The Todd Market Forecast was rated # 1 for the preceding ten years. For the year 2006, we slipped to # 3 and in 2007, we were ranked # 5.
Our bond timing was rated # 1 for the years 1997, 2007 and 2008.
Gold timing was rated # 1 for 1997 and # 2 for 2006. Late word! We were rated # 1 for 2011.
We were # 1 in long term stock market timing for the years 1998 and 2004 and # 4 in 2010.
We provide daily commentary via e-mail for the stock market, gold, oil, bonds, currencies and stock index futures. We also publish a monthly newsletter.
Our approach is mainly technical in nature. We pay attention to chart patterns, volume, overbought – oversold indicators and market sentiment. However, consideration is also given to fundamentals such as interest rates, Fed policy, earnings and the economy.
We have two main approaches. First we seek to provide specific entry and exit points for conservative investors who utilize mutual funds and ETFs. We also give precise instructions for short term traders who utilize ETFs, Options and stock index futures.
Managed Accounts
In cooperation with Financial Growth Management, we offer a low risk bond income program. Your account would be managed through TD Ameritrade or Trust Company of America.
Your funds will be exchanged between high yield bond funds and money market funds based on a proprietary mathematical model. Our goal is to return 10-12% per year during a 3 to 5 year market cycle with very low risk.
If you would like more information, please contact Ray Hansen at 714 637 7784.
P.O. Box 4131
Crestline, CA 92325
ph: 909 338 8354
fax: 909 338 8354
toddmark

Yellen to Make Bernanke Look Like Hawk
“She will make Mr. Bernanke look like a hawk. She, in 2010, said if could vote for negative interest rates, in other words, you would have a deposit with the bank of $100,000 at the beginning of the year and at the end, you would only get $95,000 back, that she would be voting for that. And that basically her view will be to keep interest rates in real terms, in other words, inflation-adjusted. And don’t believe a minute the inflation figures published by the bureau of labor statistics. You live in New York. You should know very well how much costs of living are increasing every day. Now, the consequences of these monetary policies and artificially low interest rates is of course that the government becomes bigger and bigger and you have less and less freedom and you have people like Mr. De Blasio, who comes in and says let’s tax people who have high incomes more. And, of course, immediately, because in a democracy, there are more poor people than rich people, they all applaud and vote for him. That is the consequence.”
“We Are in ‘QE Unlimited”
“On September 14, 2012, when the Fed announced QE3, that was then extended into QE4, and now basically QE unlimited, the bond markets had peaked out. Interest rates had bottomed out on July 25, 2012–a year ago–at 1.43% on the 10-year Treasury note. Mr. Bernanke said at that time at a press conference, the objective of the Fed is to lower interest rates. Since then, they have doubled. Thank you very much. Great success.”


-
I know Mike is a very solid investor and respect his opinions very much. So if he says pay attention to this or that - I will.
~ Dale G.
-
I've started managing my own investments so view Michael's site as a one-stop shop from which to get information and perspectives.
~ Dave E.
-
Michael offers easy reading, honest, common sense information that anyone can use in a practical manner.
~ der_al.
-
A sane voice in a scrambled investment world.
~ Ed R.
Inside Edge Pro Contributors

Greg Weldon

Josef Schachter

Tyler Bollhorn

Ryan Irvine

Paul Beattie

Martin Straith

Patrick Ceresna

Mark Leibovit

James Thorne

Victor Adair