
Timing & trends
 Last week’s intense market action created a great limited risk trading opportunity…and may also have created an important Key Turn Date as markets surged on Wednesday but reversed hard Thursday/Friday. If gold and stocks take out last week’s lows we could see heavy selling.
….read more & view charts HERE


 …for the last 4 years , the FED fund rate was essentially at zero and we have massive money printing , monetary inflation so it creates a huge pool of liquidity , the problem is that this liquidity will not flow evenly everywhere in every sector of the economy and in every country , it can flow first into the NASDAQ stocks until March 200 then in the US Housing market then in commodities and gold and then in emerging markets , then you have one bubble after the other ….that is the problem of the money printing by central banks.
MARC FABER EXPLAINS HOW BUBBLES ARE CREATED BY THE CENTRAL BANKS
In terms of Investment, there is nothing Safe anymore
In terms of investment, there is nothing safe anymore. The US money-printing has distorted all asset prices while cash in the bank has not given you any return when inflation is adjusted. Inflation in Thailand is running at 10 per cent per annum. I don’t look at the government’s statistics. All governments around the world lie.
Marc Faber on Buying Government Bonds
Marc Faber Biggest Mistake (WSJ)

The Bottom Line
The correction in North American equity markets that started on August 2nd is proving to be a flat trend rather than a downtrend. Look for more of the same until well into October. Preferred strategy is to maintain a healthy cash position for possible entry into the favourable seasonal trade in October.
Economic News This Week
Canadian July Retail Sales to be released at 8:30 AM EDT on Tuesday are expected to increase 0.6% versus a decline of 0.6% in June.
July Case-Shiller 20 City Home Price Index to be released at 9:00 AM EDT on Tuesday is expected to increase to 12.5% from 12.1% on a year-over-year basis.
September Consumer Confidence to be released at 10:00 AM EDT on Tuesday is expected to slip to 80.3 from 81.5 in August
August Durable Goods Orders to be released at 8:30 AM EDT on Wednesday are expected to ease 0.1% versus a decline of 7.4% in July. Excluding Transportation, August Orders are expected to improve 1.1% versus a decline of 0.8% in July
August New Home Sales to be released at 10:00 AM EDT on Wednesday are expected to increase to 425,000 from 394,000 in July.
Weekly Jobless Claims to be released at 8:30 AM EDT on Thursday are expected to increase to 330,000 from 309,000 last week.
Third estimate of second quarter GDP to be released at 8:30 AM EDT on Thursday is expected to increase to 2.7% from the second estimate of 2.5%
August Personal Income to be released at 8:30 AM EDT on Friday is expected to increase 0.4% versus a gain of 0.1% in July.August Personal Spending is expected to increase 0.3% versus a 0.1% gain in July.
September Michigan Sentiment Index to be released at 9:55 AM EDT on Friday is expected to improve to 78.0 from 76.8 in August.
Equity Trends
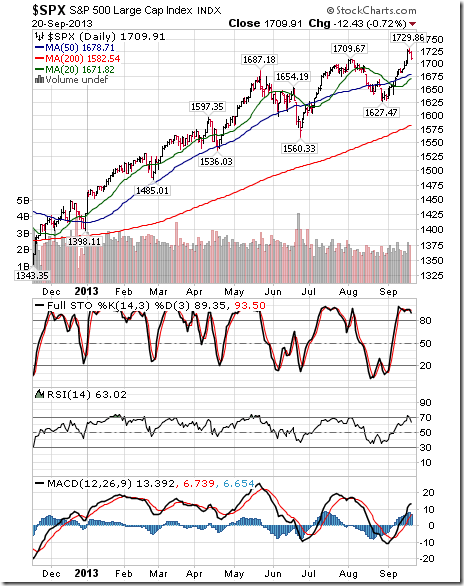
The S&P 500 Index added 21.92 points (1.30%) last week. Uptrend was confirmed when the Index moved above 1,709.91 to an all-time high. The Index remains above its 20 and 50 day moving averages. Short term momentum indicators are overbought and showing early signs of rolling over.
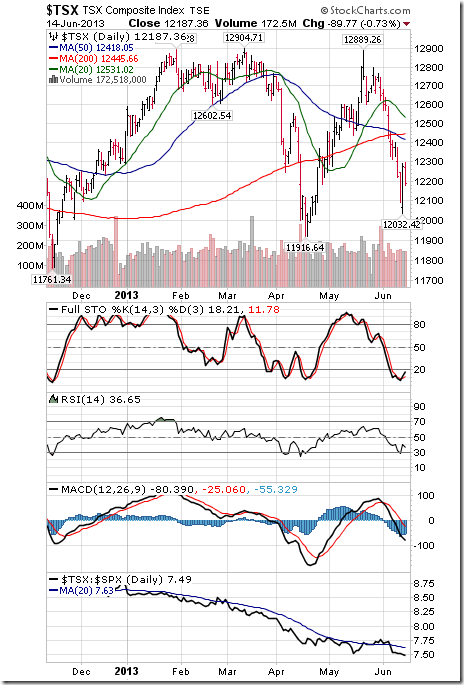
The TSX Composite Index added 83.07 points (0.65%) last week. Uptrend was confirmed on a move above 12,904.71 to reach a two year high. The Index remains above its 20 day moving average. Strength relative to the S&P 500 Index remained negative. Technical score remained at 2.0 out of 3.0. Short term momentum indicators are overbought and showing early signs of peaking.
The TSX Metals and Mining Index added 10.27 points (1.28%) last week. Trend remains up. The Index remains above its 20 day moving average. Strength relative to the S&P 500 Index remains neutral. Technical score remains at 2.5 out of 3.0. Short term momentum indicators are overbought.

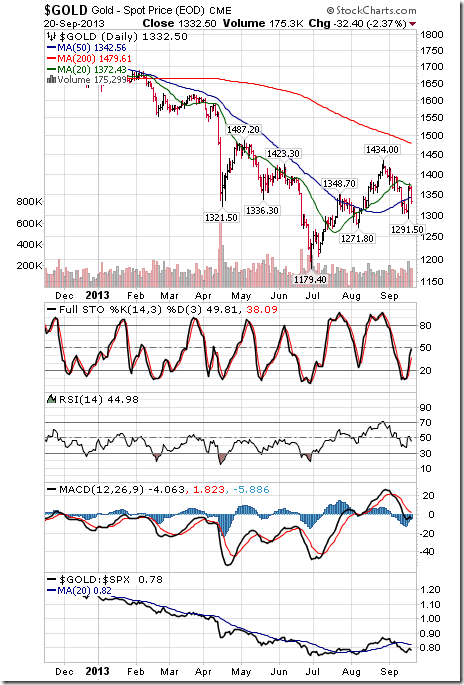
Gold added $23.90 per ounce (1.83%) last week. Trend remains up. Gold remains below its 20 and 50 day moving averages. Strength relative to the S&P 500 Index remains negative. Technical score remained at 1.0 out of 3.0. Short term momentum indicators are recovering from oversold levels.
….go HERE for 45 more charts on Interest Rates, Commodities, Stocks & Currencies
Special Free Services available through www.equityclock.com
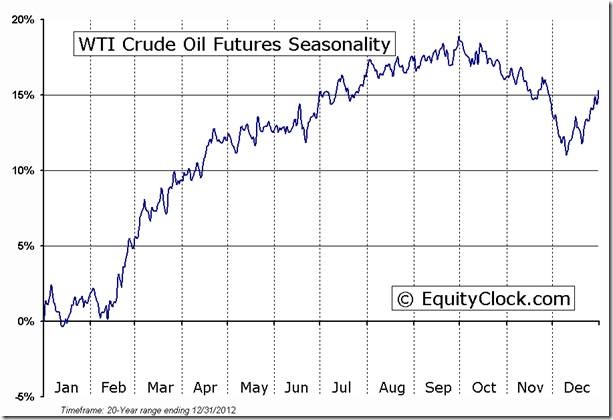
Equityclock.com is offering free access to a data base showing seasonal studies on individual stocks and sectors. The data base holds seasonality studies on over 1000 big and moderate cap securities and indices. Notice that most of the seasonality charts have been updated recently.
To login, simply go to http://www.equityclock.com/charts/
Following is an example:

Dear Mr. Bernanke,
Never mind all those foolish critics out there who said otherwise. They can criticize you all they want, but had they been in your shoes back then, they would have implemented the very same measures and policies you did. I’m sure of it.I hope this letter works its way into your inbox. After all, I used to be one of your staunchest supporters. You’ve been unfairly treated in the past. When the global financial system melted down in 2008-09, you took the right measures.
You had no choice but to pump trillions of dollars into the global economy. If you hadn’t, the world would have gone back to the dark ages.
But with your latest decision, I think you blew it big time. Here’s why:
First, you believe the U.S. economy is not yet strong enough to stand on its own two feet. But do you really think the money-printing-addicted U.S. economy is going to get better with still more opiates?
Is that the right medicine at this time? After all, if the U.S. economy is going to turn the corner, it’s going to do it with or without you.
And if it’s not going to turn the corner at this point, then all your hard work and all the money that you continue to print isn’t going to amount to a hill of beans.
 Second, you’re worried that Washington may soon run out of money. The debt-ceiling battle is about to ramp up again with a vengeance. There’s even a real chance the government will run out of funds and have to shut down.
I say if Washington can’t get its act together, then let it shut down. Let it run out of money.
It’s high time those pranksters in Congress took their jobs and responsibilities seriously.
It’s high time they cut their wasteful spending, slash their own salaries and pensions, lay off their own staff, turn off the air conditioning and dim the lights.
The rest of us are trying our hardest to run our businesses and our homes within our means. Isn’t it about time that our leaders in Washington do the same?
Third, you’re worried that bond traders got way ahead of themselves by anticipating higher interest rates. After all, since April, the yield on the U.S. 10-year Treasury has shot up from 1.6 percent to 2.8 percent. You think that’s too much, too soon.
But if it is too much too soon, so what? The free markets always correct themselves. If rates went up too far too soon, the market would correct it and rates would come back down on their own.
And if rates continued higher instead, then it would likely be because the U.S. economy is picking up, and growing. In that case, the economy would catch up with higher interest rates. Isn’t that a good thing?
So why not let the bond market do its own thing, adjust to reality, of its own accord?
Fourth, you’re also clearly worried that Europe can’t stand on its own two feet either. On that score, I agree with you. I know there’s a lot of talk out there that Europe has finally turned the corner.
I say baloney. Most of Europe is sliding deeper into a depression. European banks are still in tatters. Greece needs a new bailout. Portugal will need another one soon. Italy remains fragile, to put it lightly. And Spain is a mess.
But is Europe really our problem? Why do we have to try and fix Europe’s ill-conceived attempt at a single currency and monetary union, which is the root cause of its crisis?
A few years ago, yes, Europe needed help. But at this point, it’s up to Europe’s leaders to make the right moves. They need to implement a national deposit insurance program. They need to form a true central bank, not a figurehead central bank with the national central banks of each country still calling their own shots.
They need a single sovereign bond market. Not a fractured bond market made up of what amounts to municipal bonds of each country acting like a pseudo-sovereign euro bond.
By giving Europe’s leaders more time, all you’ve done is coddle them and given them the opportunity to continue to drag their feet on the much needed reforms they need to make. That is not going to help the situation.
Fifth, you’re worried that rising interest rates are negatively impacting emerging markets. Mr. Bernanke, I live in Asia. Interest rates are rising here because there are signs of inflation appearing everywhere. The minimum wage is going up all over Asia. Factories are humming along on overtime. Chinese growth is propelling all of Asia forward. Economic growth is about to explode to the upside again.
Rising rates are not negatively impacting Asia. Quite the contrary, they are a sign of growing economies. Of growing demand for money and credit. Isn’t that the way it should be? Isn’t that how healthy economies are supposed to work?
Now, I know a new Fed Chairperson will be appointed shortly. But that shouldn’t impact your thinking one iota.
You still have a couple of months to get the patient — the U.S. economy — out of bed and walking on its own two feet. It’s OK if it’s a little unsteady at first.
Do the right thing. Start weaning the economy off the drugs. Let the rest of the Federal Open Market Committee know that’s the right thing to do. I think — no, I know — you’ll be pleasantly surprised at the result.
Just look at the price of gold. It’s not flashing any panic signals. If deflation were as big a problem as you think it is, then gold would already be well below $1,000 an ounce. But it’s not.
And if inflation is expected to be a big problem, then gold would be much, much higher than it is.
Instead, gold is experiencing a bit of disinflation, a cooling off, which is a good thing. It’s still caught in a downtrend that probably won’t come to an end until it falls a bit more, below $1,150 … down to about $1,045.
And the decline that’s occurred in gold, its multi-hundred dollar plunge from its high at $1,921 in September 2011, has occurred despite all the money-printing you’ve done.
That’s telling you — in no uncertain terms — that perhaps inflation is not going to be the big problem that most people think.
And by the same token, the fact that gold is in a new long-term bull market and merely correcting its previous overbought condition — tells you that deflation is not a problem either.
So I repeat: Let the patient, the U.S. economy, get out of bed and walk around a bit. A breath of fresh air will do it wonders. Let it happen before it’s too late, and the patient ends up even worse off than it was before.
Yours respectfully,
Larry Edelson
Posted by Larry Edelson

-
I know Mike is a very solid investor and respect his opinions very much. So if he says pay attention to this or that - I will.
~ Dale G.
-
I've started managing my own investments so view Michael's site as a one-stop shop from which to get information and perspectives.
~ Dave E.
-
Michael offers easy reading, honest, common sense information that anyone can use in a practical manner.
~ der_al.
-
A sane voice in a scrambled investment world.
~ Ed R.
Inside Edge Pro Contributors

Greg Weldon

Josef Schachter

Tyler Bollhorn

Ryan Irvine

Paul Beattie

Martin Straith

Patrick Ceresna

Mark Leibovit

James Thorne

Victor Adair