
Timing & trends

TAPER-gate: The biggest news of the last week, and possibly the biggest economic news of the year, was the Fed’s decision not to scale back the rate of Quantitative Easing (Money-Printing, QE). The expectation was that they would lower it from $85 billion a month to $75 billion based on comments from Chairman Ben Bernanke back in May. Over the ensuing four months, interest rates have risen over one percent and stock markets have been on a roller-coaster ride as investors have attempted to read the tea leaves. However, only a very microscopic minority guessed that there would be no Tapering of QE. A lot of this reflects on the failure Fed’s communication policy. (Ironically, it is the presumptive nominee for the next Chairman, Janet Yellen, who is in charge of the Fed’s current communication policy!)
After TAPER-gate: Well, what now? The question of when the Fed will Taper will not be going away. Already, economists are handicapping the possibility of a Taper at the end of October or the middle of December. There are a few factors that strategists are looking at. First, will the U.S. unemployment rate fall enough? Ben Bernanke has kicked around a couple of figures about which he has hinted as being important to him (primarily 6.5% & 7.0% compared to the current rate of 7.2%). However, he has trouble with respect to abiding by the lines that he has drawn in the sand.
There is also the issue of a number of fiscal showdowns in the U.S. Congress. One is the Debt Ceiling debate. To a casual observer, this might appear to be a brawl over what looks like a mere procedural issue. However, about 70% of U.S. Federal spending is “automatic” and is not reviewed as long as the Debt Ceiling continues to rise every year. So, the Debt Ceiling debate is actually the main Federal Budget debate in the U.S.. Budgets are extremely important with respect to the health of the economy, so it would be irresponsible to downgrade the Debt Ceiling debate to a “Partisan Squabble.”
Secondly, there will be a lot of debate over the funding of Obamacare. Somehow, during the legislation of Obamacare, the narrative seemed to be that there would be no major additional cost, just a realignment as to how costs would be charged and administered. However, fees and taxes will have to go up to pay for it. That is going to consolidate a lot of political opposition. Obamacare sounds good when talking about the benefits. But, when voters begin to confront the costs, they get mad. And their political representatives hear about it.
Some are beginning to speculate that there may be a proposal where the funding of Obamacare is scaled back in exchange for agreeing to raise the Debt Ceiling. President Obama wants it all. But, will he be willing to compromise? If not, we could get a shutdown of the U.S. Federal government on October 17th (down to essential services only) which would hit the economy. In light of that, the Fed may not want to Taper at all until we are past these political showdowns regardless of how low the unemployment rate may fall in the interim.
While news of the political wrangling will keep the equity markets anchored, the incredible tailwind provided by continued QE may make this September-October stretch look a lot more tame than it has traditionally.
The opinions expressed in this report are the opinions of the author and readers should not assume they reflect the opinions or recommendations of Richardson GMP Limited or its affiliates. Assumptions, opinions and estimates constitute the author’s judgment as of the date of this material and are subject to change without notice. We do not warrant the completeness or accuracy of this material, and it should not be relied upon as such. Before acting on any recommendation, you should consider whether it is suitable for your particular circumstances and, if necessary, seek professional advice. Past performance is not indicative of future results.
Richardson GMP Limited, Member Canadian Investor Protection Fund.
Richardson is a trade-mark of James Richardson & Sons, Limited. GMP is a registered trade-mark of GMP Securities L.P. Both used under license by Richardson GMP Limited.

On the all-important earnings environment, today’s chart illustrates ‘as reported’ S&P 500 earnings growth (i.e. 12-month rate of change) since 1940. There are a couple of points of interest. For one, earnings growth has tended to peak in the 20 to 40% range and trough somewhere in the -10 to -20% range. At least that was the case up until this millennium. Since the dot-com crash (i.e. the 2001 – 2002 timeframe), earnings growth volatility has increased dramatically. In fact, the post-financial crisis spike to 793% is not even shown on today’s chart so as to allow the rest of the data to remain visible (i.e. not flattened out). It is worth noting that this historic post-financial crisis earnings growth spike is due in large part to the fact that earnings came in so low as a result of the financial crisis. Currently, earnings growth has just moved into positive territory but remains well below average.
Notes:
Where’s the Dow headed? The answer may surprise you. Find out right now with the exclusive & Barron’s recommended charts of Chart of the Day Plus.
Quote of the Day
“Anybody can cut prices, but it takes brains to make a better article.” – Philip D. Armour
Events of the Day
October 07, 2013 – Supreme Court session begins
Stocks of the Day
— Find out which stocks investors are focused on with the most active stocks today.
— Which stocks are making big money? Find out with the biggest stock gainers today.
— What are the largest companies? Find out with the largest companies by market cap.
— Which stocks are the biggest dividend payers? Find out with the highest dividend paying stocks.
— You can also quickly review the performance, dividend yield and market capitalization for each of the Dow Jones Industrial Average Companies as well as for each of the S&P 500 Companies.
Mailing List Info
Chart of the Day is FREE to anyone who subscribes.
To ensure email delivery of Chart of the Day, add mailinglist@chartoftheday.com to your whitelist.
Mailing List Info
Chart of the Day is FREE to anyone who subscribes.
To ensure email delivery of Chart of the Day, add mailinglist@chartoftheday.com to your whitelist.
Subscribe to – Chart of the Day

 Michael asks which has a bigger impact on our lives, Municipal or Senior levels of Government. Mike makes the case that Municipal has the greater impact, especially when it comes to taxes. Despite their declarations of support for Small Business Vancouver City Council used Tax Dollars to compete against local Bicycle Rental Businesses. Then they get upset when a Small Business lays people off because it goes out of business. Michael makes the case….
Gold-mining stocks are likely to outperform gold itself if the metal returns to a rising price environment, said fund managers and mining analysts attending the Denver Gold Forum.
Brent Woyat, Portfolio Manager
OceanForest Investment Partners
brent.woyat@raymondjames.ca
www.ofip.ca

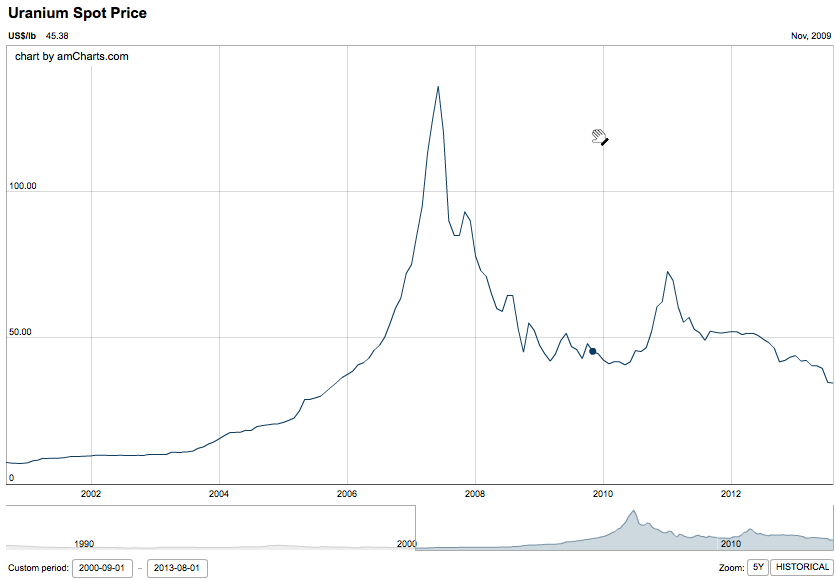
The energy content of uranium is 3 million times greater than Fossil Fuel. Placing this in perspective, the energy in three tons of coal can be found in around just one gram of uranium. That’s value that is hard to ignore.
From the chart below one certainly wouldn’t be buying Uranium at top prices. Additionally it is currently very unpopular since the Fukushima incident fitting that investment maxim to buy opposite to the crowd to make money. Which is not easy to do because we are programmed to listen to the people around us, or influenced by it. But it is the way to go.
Further as James Dines told Michael this weekend, “Fukushima occurred not because of the plant, it occurred because they were too stingy to put a high enough wall up in front of it to prevent against a tsunami. That’s what caused the trouble.”
Tom Vulcan takes a two part look at Uranium below – Ed
Uranium Prices May Be Depressed Now, But Long-Term Fundamentals Paint A Brighter Picture
Post-Fukushima, Nuclear Power Alive & Kicking, But Quickly Losing Market Share


-
I know Mike is a very solid investor and respect his opinions very much. So if he says pay attention to this or that - I will.
~ Dale G.
-
I've started managing my own investments so view Michael's site as a one-stop shop from which to get information and perspectives.
~ Dave E.
-
Michael offers easy reading, honest, common sense information that anyone can use in a practical manner.
~ der_al.
-
A sane voice in a scrambled investment world.
~ Ed R.
Inside Edge Pro Contributors

Greg Weldon

Josef Schachter

Tyler Bollhorn

Ryan Irvine

Paul Beattie

Martin Straith

Patrick Ceresna

Mark Leibovit

James Thorne

Victor Adair