
Timing & trends
Silver reached a 30 year high in April of 2011. Since then it has fallen nearly 70%. In any correction or bear market – call it what you want – we hear calls for lower prices as the market falls. Similarly, as a market rallies we hear supposedly well-reasoned arguments why prices should rise even higher.
Examples:
- Gold peaked over $850 in 1980. There were calls in 1980 for gold at $1,000. Currently we hear analysts calling for $900 gold.
- The NASDAQ peaked in year 2000 about 5,000. There were probably a few investors calling for 10,000.
- Do you remember the call for the Dow at 36,000?
- When silver was selling for nearly $50 in April 2011, which in retrospect was clearly a move too far and too fast, there were calls for $100 silver. (Note: $100 silver is coming – the “money printers” and deficit spending governments will make it happen.)
- It is easy to project the continuation of a trend. But how do we obtain more objective information? Use Ratios! Consider:
Silver compared to the S&P 500 index since 9-11. The graph clearly shows that silver prices streaked higher in 2010 and 2011 compared to the S&P. The chart also shows that silver is currently low compared to the S&P and that the linear trend indicates the ratio should triple in the next few years.

Silver compared to the S&P 500 index for 30 years. Clearly silver is inexpensive compared to the S&P – based on 30 years of data. Expect silver to rally.

Silver compared to gold prices for 30 years. When the ratio is low so are silver prices. But when silver rises, it usually moves much faster than gold so the ratio rises to the high end of the channel. Note the circled lows in the ratio in 1991, 2008, and 2015. Significant lows in silver prices occurred in 1991 and 2008. I suspect late 2014 – early 2015 will be seen, in retrospect, as a significant low in silver prices. (Repeat: $100 silver is coming.)

Silver compared to crude oil for 30 years. Even though crude oil prices have crashed in the past year, the ratio is still in the middle of its 30 year range. Silver is NOT expensive compared to crude oil.
CONCLUSIONS:
Based on the 30 year ratios to the S&P 500 index, gold, and crude oil, silver is currently inexpensive. The High-Frequency-Traders can push prices lower or higher quite easily so this analysis says little about what silver prices will do next week or next month, but it clearly says that in the long-term silver prices are low and likely to rise significantly in the next few years.
If you are stacking silver (or gold) then appreciate the long-term trends and the gift of lower prices that has been given to us by the central banks and HF Traders who wish to pretend that all is well in our global financial systems.
Gary Christenson
The Deviant Investor


Here are today’s videos and charts:
Silver Roller Coaster Video Analysis
Gold Target Acquired Video Analysis
GDX Rectangle Action Video Analysis
GDXJ Requires Serious Volume Video Analysis
Key Junior Stocks Video Analysis
There’s a lot of action taking place across the entire junior gold and silver stock sector. I feel I should include a second video for some of these key stocks. Here it is:
More Key Junior Stocks Video Analysis
Morris
Friday, May 1, 2015 Super Force Signals special offer for Money Talks Readers:
Send an email to trading@superforcesignals.com and I’ll send you 3 of my next Super Force Surge Signals free of charge, as I send them to paid subscribers. Thank you!
The SuperForce Proprietary SURGE index SIGNALS:
25 Surge Index Buy or 25 Surge Index Sell: Solid Power.
50 Surge Index Buy or 50 Surge Index Sell: Stronger Power.
75 Surge Index Buy or 75 Surge Index Sell: Maximum Power.
100 Surge Index Buy or 100 Surge Index Sell: “Over The Top” Power.
Stay alert for our surge signals, sent by email to subscribers, for both the daily charts on Super Force Signals at www.superforcesignals.com and for the 60 minute charts at www.superforce60.com
About Super Force Signals:
Our Surge Index Signals are created thru our proprietary blend of the highest quality technical analysis and many years of successful business building. We are two business owners with excellent synergy. We understand risk and reward. Our subscribers are generally successfully business owners, people like yourself with speculative funds, looking for serious management of your risk and reward in the market.
Frank Johnson: Executive Editor, Macro Risk Manager.
Morris Hubbartt: Chief Market Analyst, Trading Risk Specialist.
website: www.superforcesignals.com
email: trading@superforcesignals.com
email: trading@superforce60.com
SFS Web Services
1170 Bay Street, Suite #143
Toronto, Ontario, M5S 2B4
Canada
###
May 1, 2015
Morris Hubbartt

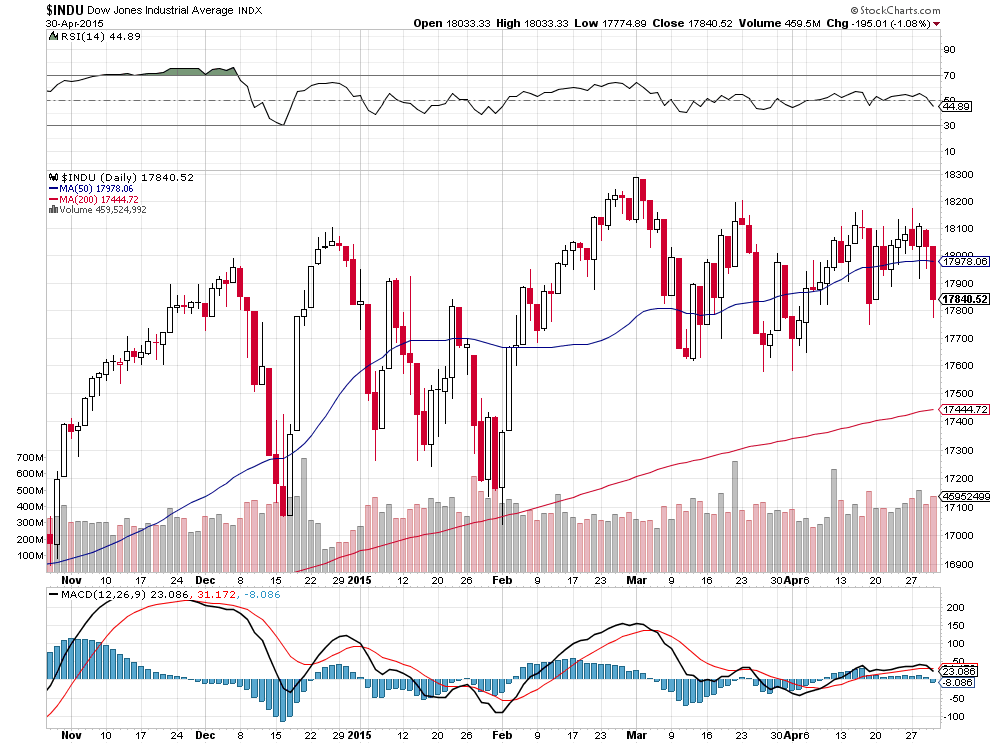
DOW – 195 on 1650 net declines
NASDAQ COMP – 62 on 1500 net declines
SHORT TERM TREND Bearish (change)
INTERMEDIATE TERM TREND Bullish
Editor’s note: This is an abbreviated update because of travel. I’ll give a complete update and make up the numbers on Friday’s update.
STOCKS:I thought the action today was pretty bad. Can’t blame it on the dollar which has been taken to the woodshed. .
Today the so called good 6 months ended. We are now entering unfavorable seasonality. More on that in Friday’s update.
I think that we are close to a short term rebound, but I suspect it will be a counter trend bounce.
GOLD: Gold collapsed for $28. The story was that a drop in initial claims would cause the Fed to raise rates earlier rather than later. I know one thing. This is a very skittish and choppy market. We’ll stay bullish for now since the yellow metal has not broken its lows of April 24, but we need to keep a close eye.
Intermediate term investors are long the SPY from 206.41. I think we will use a short term rebound to get out of this position.
System 7 traders sold the SSO at 131.68 for a gain of .09. We gave back a nice gain, but it’s better than a loss.
Todd Market Forecast for Thursday April 30, 2015
Available Mon- Friday after 6:00 P.M. Eastern, 3:00 Pacific.

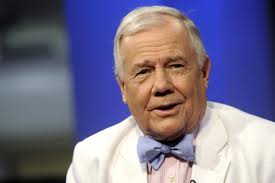 “Gold has its own mind,” Jim Rogers says. “Sometimes it moves with the dollar, sometimes it doesn’t.”
Rogers says he’s not so concerned with the daily fluctuations and adds he is still waiting on a buying opportunity.
Looking east, Rogers says he is bullish on the Chinese economy despite recent weaker economic data and continued easing in the country. “I’m bullish on the Chinese markets. My largest stock positions are in Asia – China, Japan, Russia,” he says. “I see more real estate bankruptcies in China, there’s a lot of debt buildup in China. But at the moment, I’m still there and I even bought more last week.”
Rogers also has a keen interest in the Russian stock market. Tune in now to get his thoughts on the Federal Reserve and why he thinks they may not even raise interest rates this year.
……view the 4 minute interview with Jim HERE

While oil and coal may be struggling, that’s not the case all across the energy sector.
Right now, the world’s two most populous nations are forging ahead with one specific form of power: uranium.
For many, it’s a forgotten or overlooked sector of the energy market, especially in the wake of Japan’s Fukushima disaster. But given the burgeoning demand for, and limited supply of, this crucial component of the energy mix, it’s time for a closer look at uranium. And one recent major deal is drawing serious attention… for good reason.
Demand Is Surging Worldwide
In mid-April Indian Prime Minister Narendra Modi paid a visit to Canada. While there, he signed a five-year 3,000 tonne deal to buy uranium in order to power his country’s nuclear reactors. It’s an agreement worth C$350 million dollars. Why is this significant? Narendra’s meeting was the first India-Canada governmental visit in 42 years. But more importantly, it was the first nuclear contract between these two nations in four decades.
And it may just be a foreshadowing of what’s to come.
Despite the terrible Japanese Fukushima disaster, globally there are hundreds of new reactors either under construction or in planning stages.
The United States is the largest consumer of uranium in the world, requiring more than 50 million pounds annually, yet producing only 4.7 million pounds domestically. China consumes 19 million pounds per year, and that’s expected to reach 73 million pounds by 2030.
China, too, only produces about 4 million pounds annually, while on track to build the most nuclear power capacity, nearly tripling by 2020, in an anxious bid to alleviate problems with air pollution. For its part, India’s in the midst of a major build out of nuclear power generation as well. The country’s installed capacity is now at 5,780 megawatts, but that’s set to nearly double in just the next four short years to 10,080 megawatts.
Why Prices Dropped and How We’ll Catch the Rebound
After Fukushima, uranium prices lost about 60%. But the four-year cyclical bear appears to have run its course.
As illustrated in the chart below, since bottoming near $28 in mid-2014, spot uranium prices have already gained nearly 40% to reach their current level around $38.50. It’s now looking increasingly like last summer’s $28 low is the bottom for the current cycle.
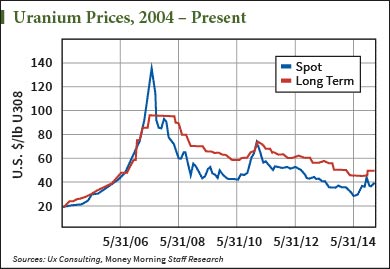
Analysts estimate that new production of uranium from conventional mining projects requires a price of $83/lb. About 56% of world mine supply is sourced from conventional mines. So the bar is pretty high, at more than double the current spot price.
As I explained above, the developing world is not only committed to nuclear, but aggressively expanding its share of the power generation mix. And that’s going to demand a lot of uranium.
Price Increases Look Inevitable
Worldwide annual consumption is forecast to leap from 155 million pounds to about 230 million pounds within nine years. India’s agreement is a wise step to secure the required fuel – roughly 7 million pounds of uranium concentrate into 2020.
Keep in mind that uranium provides clean, base load power at low cost to billions of people. And at current spot prices, many producers can’t turn a profit.
The implication here is higher prices are inevitable as demand starts to overwhelm supply before too long. There’s still time to get in, and help your portfolio go nuclear.

-
I know Mike is a very solid investor and respect his opinions very much. So if he says pay attention to this or that - I will.
~ Dale G.
-
I've started managing my own investments so view Michael's site as a one-stop shop from which to get information and perspectives.
~ Dave E.
-
Michael offers easy reading, honest, common sense information that anyone can use in a practical manner.
~ der_al.
-
A sane voice in a scrambled investment world.
~ Ed R.
Inside Edge Pro Contributors

Greg Weldon

Josef Schachter

Tyler Bollhorn

Ryan Irvine

Paul Beattie

Martin Straith

Patrick Ceresna

Mark Leibovit

James Thorne

Victor Adair