
Economic Outlook
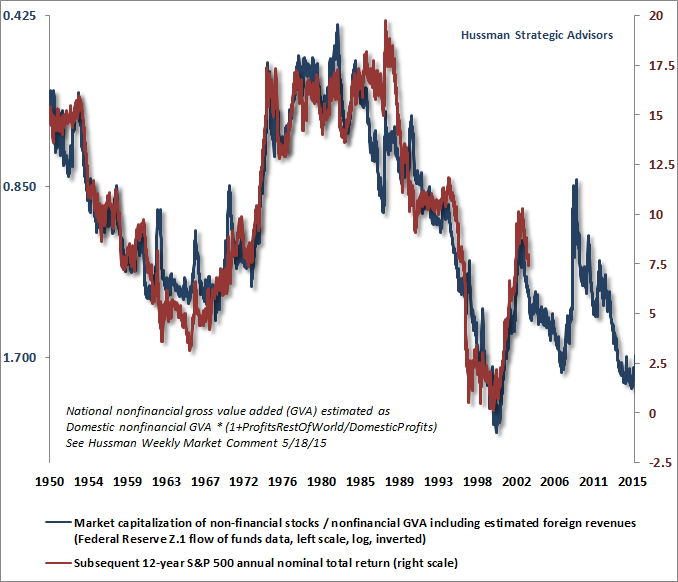
With the S&P 500 within about 8% of its highest level in history, with historically reliable valuation measures at obscene levels, implying near-zero 10-12 year S&P 500 nominal total returns; with an extended period of extreme overvalued, overbought, overbullish conditions replaced by deterioration in market internals that signal a clear shift toward risk-aversion among investors; with credit spreads on low-grade debt blowing out to multi-year highs; and with leading economic measures deteriorating rapidly, we continue to classify market conditions within the most hostile return/risk profile we identify – a classification that has been observed in only about 9% of history.
The primary feature driving our current market return/risk classification is that market internals and credit spreads have clearly deteriorated, following an extended period of extremely overvalued, overbought, overbullish conditions. Essentially, this is equivalent to saying that investors have shifted toward risk aversion in an environment where valuations are rich and risk premiums are extremely thin.While the market has experienced both short-term gains and losses under similar conditions, the most dominant outcomes are abrupt air-pockets, panics and crashes, with annualized losses in the S&P 500 under this 9% of history averaging about -33% at an annual rate. As shown below, this small subset of historical conditions captures a cumulative market loss of about 94%. The corollary is that the remaining 91% of market conditions capture roughly 16 times the overall total return of the passive index since 1940.
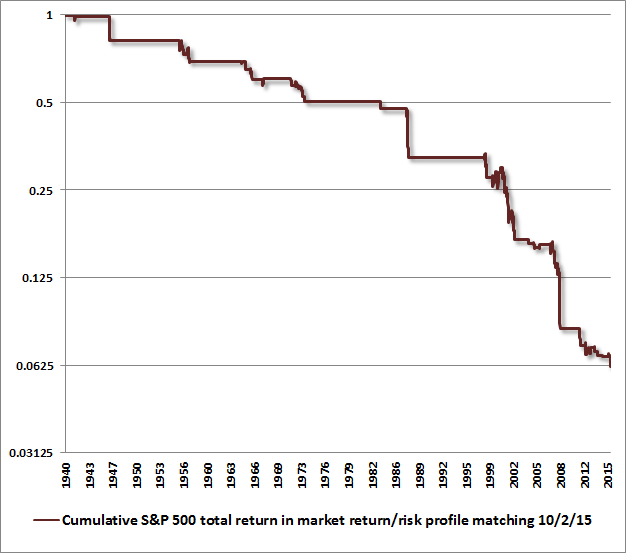
If market internals and credit spreads improve materially, the return/risk classification we identify will also change. Such an improvement would reduce the immediacy of our downside concerns, regardless of the level of overvaluation, and regardless of other economic data. While valuations drive long-term returns, the primary driver of market returns over shorter portions of the market cycle is the attitude of investors toward risk, as indicated by the uniformity or divergence of market internals. Those risk preferences determine when Fed easing tends to be favorable for stocks and when Fed easing provides no support for a collapsing market (see When An Easy Fed Doesn’t Help Stocks). Those investor risk preferences also determine when extreme overvaluation tends to be ignored by investors, and when it tends to produce vertical losses (See A Better Lesson Than “This Time is Different”). On that front, we’ll take our evidence as it comes.
Importantly, even fairly simple information from stock prices can have a profound impact on the recession probabilities implied by tepid economic data, as Bill Hester nicely points out in his latest research piece, When Market Trends Break, Even Borderline Data Is Recessionary (additional link at the end of this comment).
On Friday, the Bureau of Labor Statistics reported that non-farm payrolls for September grew by 142,000, versus a consensus that expected over 200,000 new jobs. At the same time, August job growth was revised lower from 173,000 to 136,000 jobs. All of this is very much in line with the deterioration that we’ve observed for months in leading measures of economic activity.
Keep in mind that labor is the most lagging of economic indicators. As I observed in February (see Market Action Suggests Abrupt Slowing in Global Economic Growth):
“The combination of widening credit spreads, deteriorating market internals, plunging commodity prices, and collapsing yields on Treasury debt continues to be most consistent with an abrupt slowing in global economic activity. Generally speaking, joint market action like this provides the earliest signal of potential economic strains, followed by the new orders and production components of regional purchasing managers indices and Fed surveys, followed by real sales, followed by real production, followed by real income, followed by new claims for unemployment, and confirmed much later by payroll employment.”
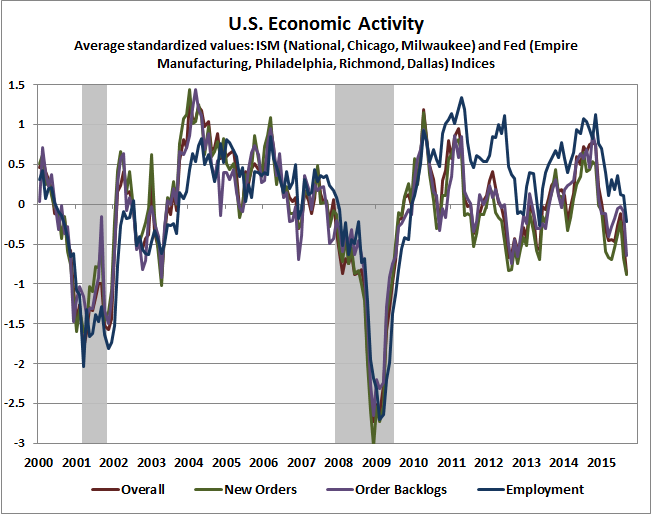
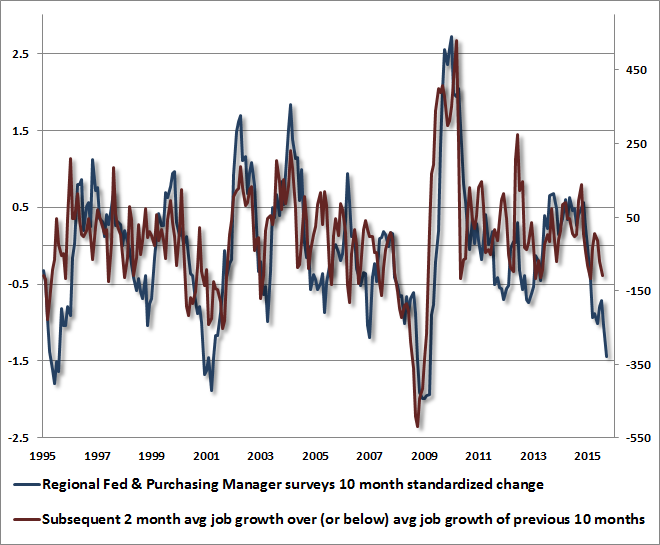
In our view, the recent deterioration in employment measures is likely to accelerate in the months ahead. The following chart presents our standard review of economic activity, drawn from a broad range of regional Federal Reserve and purchasing manager’s surveys. Recent levels have dropped to about the same level we saw at the beginning of the 2007-2009 recession. However, they haven’t significantly broken the lows we observed in 2012, so we should be careful not to draw too strong an inference from this data alone.
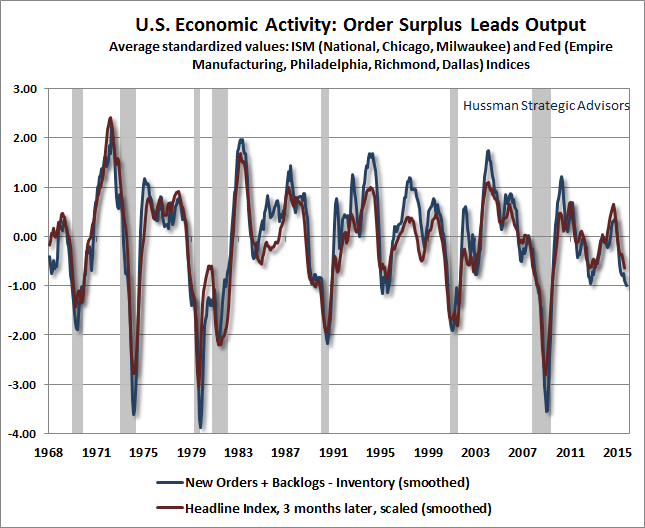
In terms of likely direction in the coming months, we can exploit the leading information available by looking at the production pipeline. What causes a business to increase its activity? Essentially new orders and order backlogs that can’t be filled out of existing inventory. As a result, we find that the “order surplus” signal we derive from regional economic surveys (new orders + order backlogs – inventories) typically leads the headline indices by about three months. That order surplus signal is still deteriorating.
We know that employment measures lag other economic measures quite a bit in absolute terms, but we also know that the momentum of job growth typically follows with a shorter lag. What we find here is that the 10-month change in our economic activity composite is significantly, though imperfectly, related to employment growth over the following two months, above or below the average level of job growth over the preceding 10 months. Specifically, over the past 10 months, non-farm payrolls have grown an average of about 211,000 jobs per month. Given the deterioration we’ve seen in broad regional surveys, we should not be surprised if average job growth falls short of that average by between 150,000 and 300,000 jobs per month. That is, the data is now consistent with the potential for zero or negative job growth over the coming months.
In longer term data since 1950 (with varying availability of the component data series), deterioration of the current magnitude has always been associated with a shortfall of at least 150,000 jobs from the prior 10-month average, but has not always been associated with recession. So again, on the recession question, we can’t draw too strong an inference from this data alone.
On the profits front, we’ve developed a number of approaches over the years to understand what drives cyclical fluctuations in profit margins (see for example Recognizing the Valuation Bubble in Equities and The Coming Retreat in Corporate Earnings). One of these is to examine the difference between the growth of output prices and the labor cost required to produce each unit of output. Despite some recent slowing, unit labor costs have grown at a significantly greater rate, in recent quarters, than output prices as measured by the GDP deflator. As shown below, we’ve observed downward pressure on corporate profits in recent quarters as a result.
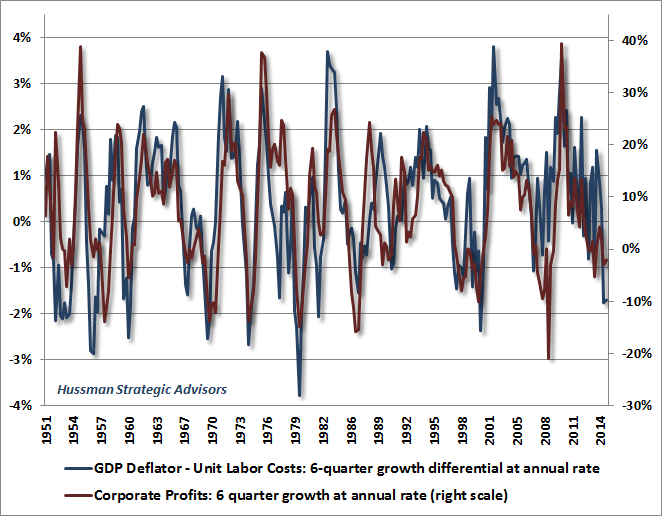
Combined with pressures we observe on profit margins, my impression is that investors may be surprised at the number of companies that attempt to offset earnings disappointments in the coming weeks by pairing those reports with cost-cutting, in the form of layoff announcements.
A Growing Risk of Recession
On the prospect of recession, I’m reasonably well-known as one of the only economists who correctly warned in real-time of oncoming recessions in October 2000 and again in November 2007 – both points where the consensus of economic forecasters indicated no expectation of oncoming trouble at all. Like Lakshman Achuthan of ECRI – the only other economist we know of who identified both recessions in a timely way – I also incorrectlyanticipated a recession in 2011-2012, which did not emerge in that instance. The signal from our Recession Warning Composite at that time was triggered by a shortfall in employment growth (alternate condition 4 below) that was subsequently revised away, so the last signal on this composite in the revised data appears during the global financial crisis. As for other conditions, the ISM Purchasing Managers Index was above 50 between August-December 2011, which is the only part of that span when the S&P 500 was below its level of 6-months earlier. Needless to say, we consider a great deal of additional economic evidence, but our reliance on subsequently revised payroll data, and the need to place stronger emphasis on market internals (which we imposed on our methods in mid-2014) was our Achilles’ heel in that instance.
Still, over a longer span, our simple Recession Warning Composite has proved to be an invaluable rule of thumb. As of last week, the one condition in our Recession Warning Composite that has not dropped into place is the ISM Purchasing Managers Index, which came in at 50.2 for September, but not below 50. I should note, however, that on the basis of a much broader set of regional and national Fed and purchasing managers surveys, the 50.2 number was a large outlier – a figure closer to 48 was implied by that other data. If stock market internals were favorable here, we would quickly dismiss the prospect of an oncoming recession, for the same reason we would defer our concerns about potentially vertical market losses (see A Most Important Distinction). Favorable market internals would also provide a much greater benefit of the doubt that Fed easing might encourage both fresh speculation and a short-term boost to economic activity. But as we’ve detailed – particularly since mid-2014 – all of those prospects actually hinge on whether individuals in the economy are risk-seeking or risk-averse, and poor market action presently signals risk-aversion. In that environment, Murphy’s Law tends to hold: whatever can go wrong probably will go wrong.
The following segment, from my November 12, 2007 comment Expecting A Recession, details the basic syndromeof conditions (none of which is particularly informative in and of itself) that comprise our Recession Warning Composite, which is strongly associated with U.S. economic downturns:
1: Widening credit spreads: An increase over the past 6 months in either the spread between commercial paper and 3-month Treasury yields, or between the Dow Corporate Bond Index yield and 10-year Treasury yields.
2: Moderate or flat yield curve: 10-year Treasury yield no more than 2.5% above 3-month Treasury yields (this doesn’t create a strong risk of recession in and of itself).
3: Falling stock prices: S&P 500 below its level of 6 months earlier. Again, this is not terribly unusual by itself, which is why people say that market declines have called 11 of the past 6 recessions, but falling stock prices are very important as part of the broader syndrome.
4: Weak ISM Purchasing Managers Index: PMI below 50.
We can further improve the accuracy and immediacy of the recession signal by allowing any PMI in the low 50’s, and requiring moderating employment as additional confirmation:
4 (alternate): Moderating ISM and employment growth: PMI below 54, coupled with either total nonfarm employment growth below 1.3% over the preceding year (this is a figure that Marty Zweig noted in a Barron’s piece years ago), or an unemployment rate up 0.4% or more from its 12-month low.
[Note – Applying this alternate criteria also relaxes the yield curve criterion (2) so that any difference of less than 3.1% between the 10-year Treasury yield and the 3-month Treasury bill yield is actually sufficient to complete the syndrome].
For quick accessibility, here’s a review of useful confirming indicators of oncoming recession, aside from the indicators noted above. These will be important to monitor in the months ahead, but some have significant reporting lags, so are more useful for confirmation than for advance warning.
A sudden widening in the “consumer confidence spread,” with the “future expectations” index falling more sharply than the “present situation” index (currently in place). In general, a drop in consumer confidence by more than 20 points below its 12-month average has accompanied the beginning of recessions;
Low or negative real interest rates, measured by the difference between the 3-month Treasury bill yield and the year-over-year rate of CPI inflation. Real short term rates have now declined to negative levels on this basis;
Falling factory capacity utilization from above 80% to below 80% has generally accompanied the beginning of recessions;
Slowing growth in employment and hours worked. The unemployment rate itself rarely turns sharply higher until well into recessions (and rarely turns down until well into economic recoveries). So while the unemployment rate is an indicator of economic health, it is not useful to wait for major increases in unemployment as the primary indicator of oncoming economic changes. As for employment-related data, slowing growth in employment and hours worked tend to accompany the beginning of recessions.
With a clear breakdown in market internals, and leading economic measures deteriorating, we should be aware of the growing potential for a recession, but there is no need to take a strong view on this. Given that observable market conditions already hold us to a defensive outlook in stocks, there’s nothing we would do differently from an investment standpoint by “calling” a recession in any event.
While leading measures and our Recession Warning Composite do not currently provide enough evidence to anticipate an oncoming recession with confidence, they do suggest much greater prospects for economic weakness than the Wall Street consensus suggests. The disappointing job figures were met with initial market weakness on Friday, but enthusiasm later in the day on expectations that the Federal Reserve will be unable to raise interest rates from zero. I actually very much agree that the Fed has missed that opportunity. As I noted last month, the strongest reason to normalize monetary policy was to reduce speculative risks, but the proper time to have done that was years ago. At this point, obscene equity valuations are already baked in the cake on valuation measures that are reliably correlated with actual subsequent stock market returns.
That said, I strongly disagree that investors should view weaker economic prospects as a good thing. Recall that the Federal Reserve eased through the entire duration of the 2000-2002 and 2007-2009 market plunges. In an environment of risk aversion (which we currently infer on the basis of clear breakdowns in market internals) and credit spreads blowing out to multi-year highs, Fed easing has typically done nothing to support stock prices (see When An Easy Fed Doesn’t Help Stocks).
While Wall Street speculators are increasingly calling for QE4, they should be careful what they wish for now that market internals are unfavorable. The initiation of QE4 would be likely only in the face of even deeper economic weakness. An about-face by the Fed driven by economic weakness would more likely – after a brief celebration – contribute to panic that the Fed had lost credibility and control. We believe the Fed already has neither.
That point is nothing new. As I detailed in August 2007, just before the global financial crisis and a 55% collapse in the S&P 500 (see Knowing What Ain’t True):
“On the subject of what investors know that ain’t true, it’s not clear that investors should really be cheering for an environment in which the Fed would be prompted to cut rates because of recession risk. Recall that the ’98 cuts were largely due to illiquidity problems from the LTCM crisis, not because of more general economic risks. In contrast, the FOMC successively cut the Fed Funds rate in attempts to avoid recession in 2000-2002 and 1981-1982. Those cuts certainly didn’t prevent deep market losses. Speculators hoping for a ‘Bernanke put’ to save their assets are likely to discover – too late – that the strike price is way out of the money.”
New from Bill Hester: When Market Trends Break, Even Borderline Data Is Recessionary
The foregoing comments represent the general investment analysis and economic views of the Advisor, and are provided solely for the purpose of information, instruction and discourse. Please see periodic remarks on the Fund Notes and Commentary page for discussion relating specifically to the Hussman Funds and the investment positions of the Funds.

| Mon. | Tue. | Wed. | Thu. | Fri. | Mon. | Evaluation | |
| Monetary conditions | 0 | 0 | 0 | 0 | 0 | 0 | 0 |
| 5 day RSI S&P 500 | 15 | 18 | 47 | 50 | 65 | 76 | – |
| 5 day RSI NASDAQ | 10 | 9 | 40 | 41 | 58 | 68 | 0 |
|
McCl-
lAN OSC.
|
-136 | -130 | -23 | -17 | +65 | +185 |
–
|
| Composite Gauge | 17 | 12 | 5 | 7 | 5 | 5 | – |
| Comp. Gauge, 5 day m.a. | 14.4 | 13.9 | 12.2 | 10.4 | 9.2 | 6.8 | – |
| CBOE Put Call Ratio | 1.43 | 1.36 | .84 | .95 | 1.09 | 1.00 |
+
|
| VIX | 27.63 | 26.83 | 24.50 | 22.55 | 20.87 | 19.54 | 0 |
| VIX % change | +17 | -3 | -9 | -8 | -7 | -7 | – |
| VIX % change 5 day m.a. | +6.8 | +4.0 | +2.4 | -0.6 | -2.0 | -6.8 | – |
| Adv – Dec 3 day m.a. | -1136 | -1045 | -480 | +336 | +979 | +1257 | – |
| Supply Demand 5 day m.a. | .39 | .40 | .52 | .53 | .67 | .85 | – |
| Trading Index (TRIN) | 1.43 | .64 | .42 | .83 | .54 | .48 |
0
|
|
S&P 500
|
1882 | 1884 | 1920 | 1924 | 1951 | 1987 | Plurality -7 |

 The popular belief that the U.S. economy has been steadily recovering has endured months of disappointing data without losing much of its appeal. A deep bench of excuses, ranging from the weather to the Chinese economy, has been called on to justify why the economy hasn’t built up any noticeable steam, and why the Fed has failed to move rates off zero, where they have been for seven years. But the downright dismal September jobs report that was released last Friday may prove to be the flashing red beacon that even the most skilled apologists can’t explain away. The report should make it abundantly clear that we are far closer to recession than recovery. But old notions die hard and, shockingly, most economists still believe that we have hit a temporary speed bump not a brick wall. But at some point healthy hope turns into dangerous delusion. We may have just turned that corner.
To order your copy of Peter Schiff’s latest book, The Real Crash (Fully Revised and Updated): America’s Coming Bankruptcy – How to Save Yourself and Your Country, click here.
For in-depth analysis of this and other investment topics, subscribe to Peter Schiff’s Global Investor newsletter. CLICK HERE for your free subscription.

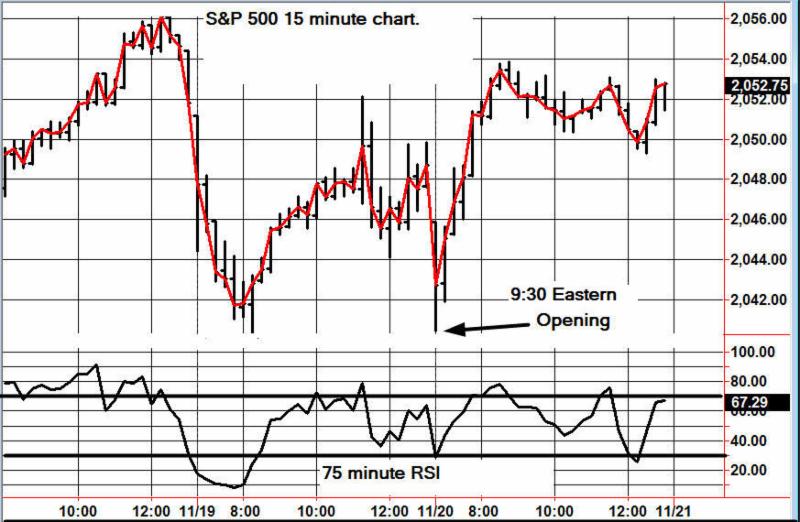
The Friday’s jobs report and the reaction by the market. The precious metals sector was threatening a breakdown and the failure of that to happen is bullish for the short term. We’ll see if this rebound is something that can last beyond this month. It could last for a few months.
Consider the monthly chart of the HUI, which closed at 115. It has been able to hold above 100 for the past few months. A monthly close above 115 or weekly close above 127 will greatly increase the likelihood of a move back to major resistance at 150. That is 30% upside from Friday’s close.

Here is a daily line chart for GDXJ, which includes the 400-day moving average, a great indicator for distinguishing the trend and bull/bear markets.
GDXJ closed Friday at $20.46. A week ago we noted an upside target of $22-$23. If GDXJ can takeout the trendline near $22, then it could potentially rally up to its 400-dma which figures to reach $26-$27 in a few months. The other scenario is this rally fizzles out around $22 in the weeks ahead.

In TDG #433, a 33 page update sent yesterday we noted some reasons why we are very skeptical that the metals have begun a new bull market.
One is there is no evidence of liquidation or capitulation in the metals. The net speculative position is simply the longs minus the shorts. If there are more shorts than commercials are net long and speculators are net short. That hasn’t happened in Gold since 2001.
The chart below plots the net position and the shorts and longs. Note that gross long position of 52% of open interest remains well above the 2007 low and above the early 2014 low. Gold plunged in the summer to a new low yet the spec longs did not capitulate. They cut their longs but not as much as you’d expect.

This same issue is even worse in Silver. Its current gross long position is 53% of open interest. The low this year was 46% with the 2013 low at 37%. So spec longs in Silver remain well above the 14-year low of 37%. In fact, spec longs in Silver are much closer to 3-year highs. Greg Weldon has also mentioned this in recent months. (Check his Twitter).
What we could see at a bottom is something like this. Spec longs plunge to new lows while spec shorts increase and make a new high. Maybe for Gold gross longs fall to 35% while gross shorts rise to 50%. The net position would be -15%. (Negative would mean the speculators are net short).
At the bottom there is dual buying power. Shorts have to cover and gross longs have a lot of room to increase because they already capitulated. This obviously does not need to take place at every market bottom but given the length and severity of the current bear market it’s more likely to happen than not.
In TDG #433 I also discussed the US$ index and the probability of another leg higher. Gold typically bottoms 3-5 months before the US$ peaks. Gold has done nothing since the US$ peaked 6+ months ago. The US$ index remains bullish technically, even if it drops in the near term. Also, if the US$ had put in a major peak in Q1 then why is Gold down since then? It’s because it was not a major peak.
We have to keep all these scenarios in our heads and assess the probabilities both for the short term (1-2 months) and beyond that (3-6 months).
-Jordan
Consider a subscription to our premium service as you will immediately receive all recent updates as well as recent company reports (a +50 page file) and our book, “The Coming Renewal of Gold’s Secular Bull Market”.
 Investors overestimate the importance of skill and underestimate the roll of random chance in investment returns. That’s the key finding of a study conducted by researchers at the University of Mannheim, in Germany. The study, entitled “Fooled by Randomness, Investor Perception of Fund Manager Skill” offers amazing insights into the nature of investing performance…. CLICK HERE to watch the video.
The Evidence-Based Investor Video series is a service provided by Paul Philip and the team at Financial Wealth Builders Securities


-
I know Mike is a very solid investor and respect his opinions very much. So if he says pay attention to this or that - I will.
~ Dale G.
-
I've started managing my own investments so view Michael's site as a one-stop shop from which to get information and perspectives.
~ Dave E.
-
Michael offers easy reading, honest, common sense information that anyone can use in a practical manner.
~ der_al.
-
A sane voice in a scrambled investment world.
~ Ed R.
Inside Edge Pro Contributors

Greg Weldon

Josef Schachter

Tyler Bollhorn

Ryan Irvine

Paul Beattie

Martin Straith

Patrick Ceresna

Mark Leibovit

James Thorne

Victor Adair