
Wealth Building Strategies
Being a contrarian investor makes sense to many market participants.
Buying stocks when they are weak and selling them when they are strong takes a good deal of intestinal fortitude but can pay good returns if done properly. What separates many from success is not having a good understanding of what it takes to be a profitable contrarian. Here are my thoughts.
Simply buying an asset because it has dropped in price is a losing game. There are usually very good reasons for why a stock falls in price and not understanding the cause and its effect on price can leave the bargain hunter penniless. I expect that self proclaimed contrarians have lost their shirt buying bargains in the Energy sector over the past two years. Buying a stock that is at 50% of its high price is not a bargain if it is destined to trade at 10% – or even zero.
In that is the first lesson of contrarian investing. You can not justify a purchase by saying that the company used to trade at a higher price and therefore must go back up there again. The high price may have been irrational or the current business may not be strong enough to justify that higher price again in the future. Ignore anyone who says “You should buy XYZ Energy, it used to trade at $100 and now it is only $50!”.
Many investors have an emotional attachment to the companies they buy. Perhaps they made money on them in the past, maybe they have spent countless hours studying the company’s business, for some it is the company they work for and rely on. So often, these investors’ judgment of the future is based on an emotionally clouded vision of the past.
This leads to my next rule for contrarian investing. Never use old information to make investment decisions. This is actually a great rule for all investing – information that is out in the public realm has already been priced in to the market and therefore has no value to your decision making process. The only information that has value are facts that are not widely known and therefore not yet priced in to the market. If you are going to use information, you must have an edge that the general investing public does not have.
Since most investors don’t have access to better information than the public, the opportunity that comes with being a contrarian has to be based on something other than information. This leads me to the factor which provides the greatest opportunity in the market – emotion.
We have all heard how the market moves on fear and greed but I think few people know how to take advantage of it. First, we must define in market terms what fear and greed are.
Fear is what causes people to accept an irrationally low price for a stock. It is mostly the fear that the stock is going to go lower than it already has, bringing the panicked share owner to their knees and dumping in desperation.
Greed is what causes investors to chase a stock higher, up to prices that have no basis in the fundamental value of the company. In many ways, greed is just another form of fear – the fear of missing out. As stocks move higher, investors think about what could have been if only they had bought in the past and what could be if the stock continues on its upward trajectory. Greed causes bubbles.
Fear and greed are easy to spot if you are looking at a chart of the price history of a stock or market (or anything that can have its price history charted). They are both characterized by parabolic trends. Draw a straight line across the bottoms of a price chart in an upward trend and a straight line across the tops for a price chart in a downward trend. The parabolic trends occur when price runs away from the trend line, either far above the upward trend line or far below the downward trend line.
This leads to the first opportunity for the contrarian investor. Buy stocks that have fallen down and away from their downward trend line because it is likely that they will come back up to the trend line as panic selling wears off. Sell stocks that run up and away from the upward trend line because it is likely that price will come back down to the upward trend line when emotional buying wears off.
Here is a 3 year weekly chart of the Canadian Energy Sector ETF which shows four time when emotion took prices away from the linear trend line:
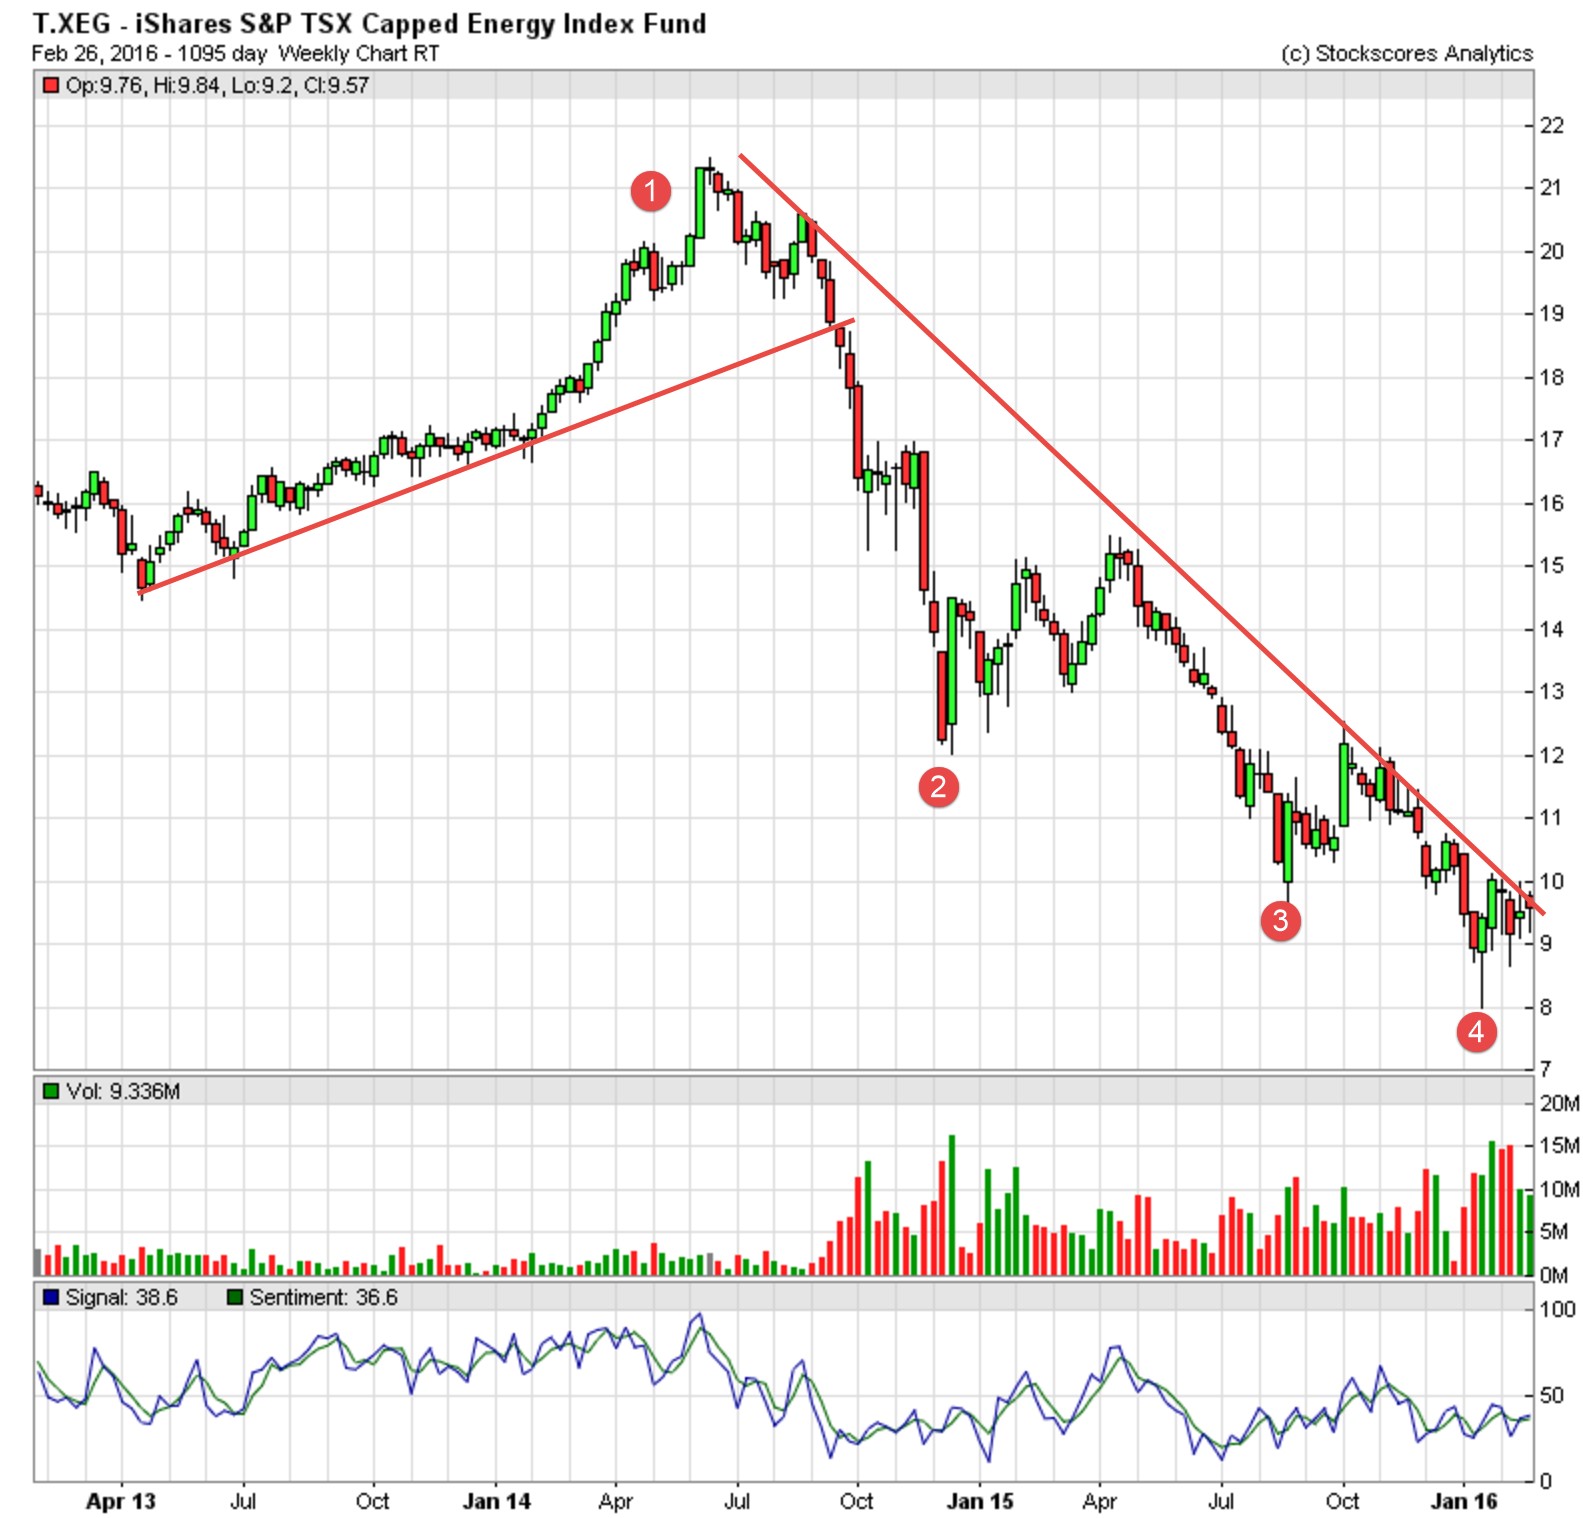
At Point #1, price went parabolic to the upside providing for a good time to sell when most investors were overly optimistic about Energy stocks. Points #2, #3 and #4 came when the price trend went parabolic to the downside before a quick snap back up to the downward trend line.
Trading these emotional extremes can give the contrarian good trading opportunities. You will see these on long term charts like the one I show above but also on very short term charts that more active traders can take advantage over as little as hours or a few days.
While emotion can give you quick profits as the market works its way back to rationality, the greatest opportunity comes when the trend changes. It is usually the most well informed investors who recognize the shift in fundamentals first and they leave a trail for us to follow.
As I have written many times before, there is a simple pattern for most trend line breaks. For down trend reversals, you must have a break of a downward trend from rising bottom. For up trend reversals, you need to see a break of the upward trend from a falling top.
Go back to the chart of Canadian Energy above and you will see the formation of the falling top at the start of September 2014 and a break of the upward trend line later that month. The sentiment in the Canadian market for Energy stocks was still positive but the chart was telling us that there were problems coming. A good contrarian timed the market with a sell on the group then.
“When will it be time to buy Canadian Energy again?” is one of the most common questions I get these days. You now have the simple tools to be a contrarian buyer of these stocks just by looking at the chart of T.XEG or which ever Energy stock you are interested in. Right now, price is below the trend line so it is not time to buy. That could change as soon as next week, or it might take much longer. All you have to do to answer the question yourself is watch for a break of the red line in the chart above and make sure the break comes after the formation of a rising bottom.
There are two ways to be a successful contrarian. First, take advantage of emotion by taking trades that go against the trend when price runs away from the trend line. That means buying when price falls rapidly away from a downward trend line and then starts to move up. On the sell side, take the trade when price runs in a parabolic curve up and away from the trend line.
The second way to be a contrarian is to take trades when trends reverse with the simple break of trend from a rising bottom (buy) or falling top (sell).
Neither of these methods work every time so you must always practice good risk management. If the market gives you a signal that turns out to be wrong, take the small loss and wait for the next signal. Trading as a contrarian is like every other kind of trading – it just a numbers game where you aim to make more when you are right than what you lose when you are wrong.

The Canadian market broke its long term downward trend this week which means there are stocks starting to reverse the ugly cycle that they have been in for some time. This week, I ran the Stockscores Simple Canada market scan, seeking out charts that are turning around after a long period of weakness. Here are two worth considering:
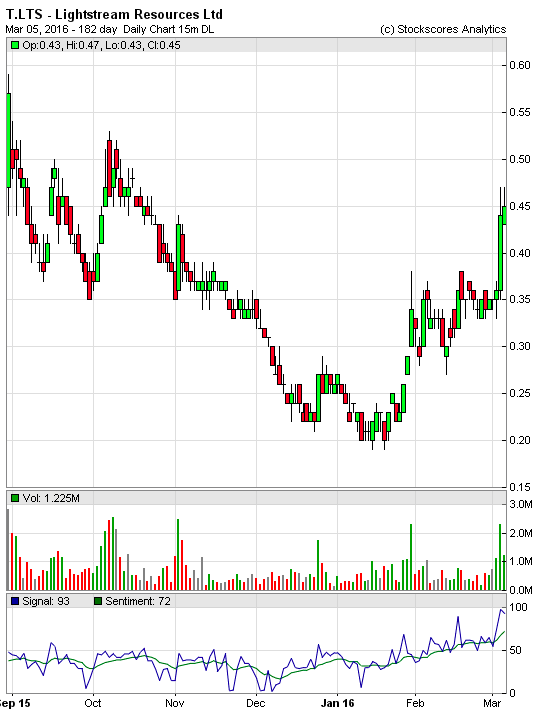
1. T.LTS
T.LTS broke up from a rising bottom this week after breaking its downward trend, moving up through resistance with stronger than normal volume. Good potential as long as the commodity bounce continues. Support at $0.33.
With the markets bouncing around and headlines in the financial media designed to cause concerns, I thought it might be worthwhile to provide a broader context to the current environment and how that environment impacts your portfolios. As always, I will refrain from trying to outsmart the market by predicting its short term direction because the market will always conspire to make such prognosticators look foolish. That said, I do wish to provide a framework of understanding.
The most important consideration to keep in mind is that your portfolio is mathematically designed to dampen exactly the kind of volatility that the market is exhibiting now. This is done by our group constructing your portfolio with negative correlation. In other words, we use positions which move up or down based upon different economic inputs, such as interest rates and commodity prices. Each and every position in your portfolio is carefully selected because we feel it will be profitable, but each position (or groups of positions) will react slightly differently to one another over any shorter term economic environment. For instance, despite the correction in equity prices generally, the world’s largest gold miner, Barrick Gold, has risen over 130% since last September.
The key take-away is that your portfolio is not the market.
It has been constructed to deliver the greatest possible rate of return for your given level of risk based upon the proven and Nobel Prize winning mathematical concept of Modern Portfolio Theory. So strong is this process, and our proprietary interpretation of it, that each client model portfolio was profitable in 2015, ranging from +3.25% to +7.85% (net-to-client) despite the fact that virtually every indices in North America and globally was negative over the year.
But what of the market as a whole and the prospects for the current year? It is important to understand that despite the fact that your portfolios hardly were impacted, from the fall of 2014 until the recent bottom of the market on January 20th, the TSX fell an astounding -27%. This collapse more or less imitated the 70% collapse in oil prices over much of the same timeframe.
It is a difficult number to get your head around; just imagine if we had a 27% correction in real estate prices here in Vancouver or in Toronto. But that couldn’t happen could it, because real estate prices in Vancouver never go down, do they? I suggest you watch The Big Short, or at least watch this BNN interview:
http://www.bnn.ca/Video/player.aspx?vid=818699
But I digress. In fact the TSX is now more than 12% below where it was back in 2007 before the financial crisis, some 9 years ago.
Similarly, the Dow Jones in the U.S. has fallen some 15% from its peak in 2015. Global markets have corrected more than 23% from their peak in 2015.
What this suggests is that the equity markets contain much less risk than they did previously and clearly have more potential upside. The question of course, is ‘when will they achieve that upside potential’?
Those that are fearful and therefore are selling equities in this environment point toward a shaky U.S. economy and China growing at a lower rate than it has in previous years. Let’s review the current economic topography.
While we always need to be careful because market corrections and talk of recession can sometimes become a self-fulling prophesy, the reality is that the U.S. is in a real, although anemic, recovery. It is extremely unusual to have a sustained major market correction without a recession proceeding it. This would suggest that the current U.S. equity market has perhaps already seen its lows. As an example, the giant JP Morgan Chase is trading at just 9.4 times its earnings and throwing off a dividend of over 3%.
China’s rate of growth is slowing and its demand for commodities is falling, but this has been happening for almost 5 years and should not come as a surprise. Keep in mind that while the Chinese economy is the second largest economy by size in the world, it is not the second most important. The reason is because they are not yet global consumers. They are not buying goods manufactured in North America or Europe, at least not in large enough quantities to be impactful. A lower growth rate in China should have little effect outside of a slowing demand for commodities, which as mentioned, is something fully baked into future financial expectations. While their volatile stock market is down –50% since last year, again this should have little direct impact on the global economy for the same reasons. Eventually the domestic economy in China will indeed have more of a global impact, but this will not happen until China converts from an export dominated economy to one sustained internally by its consumers.
The TSX here in Canada has tracked the collapse in oil prices over the last 18 months. However, energy prices have stabilized to a degree and technical charting suggests that they may indeed have already bottomed. This bodes well for the TSX, where many of the companies listed on our market fell based solely upon their association to Canada and the TSX. Many companies we own such as Bank of Montreal and Manulife Financial are now trading at 10 times or less next year’s earnings yet have dividend yields over 4%. This would suggest that these companies are attractive at the current prices. Evidently international markets agree as the TSX has been the top performing major index in the world since January 1st of this year.
Nothing, of course, is certain and volatility over the next few months no doubt will continue (please see Ethan Dang’s column), but the fact remains that the current market is much less expensive than it was 18 months ago and by most metrics, inexpensive in general. The best part of this scenario is that despite the correction in equity prices over the past 18 months, your portfolio was hardly impacted (please see the most recent performance numbers in the performance tab on this email), and each model portfolio is well positioned for the eventual recovery.
Have a great week!
Neil
Indecisive Market Direction
by Ethan Dang, CFA, MBA
This year continues to display uncertainty and indecisiveness for global equity markets as investors grapple with slowing global growth against the conviction of global central banks to support equity markets through expanded monetary stimulus. The latest example is the Bank of Japan’s move to implement negative interest rates on January 29th in order to encourage its citizens to spend and its banks to increase lending. Equity markets remained volatile in February. Volatility may be ideal for day traders, but can be emotionally draining for long-term investors. In this type of environment, it is very important to stick to the plan and focus on risk management and diversification.
Consistently Working In Our Clients’ Best Interest
The opinions expressed in this report are the opinions of the author and readers should not assume they reflect the opinions or recommendations of Richardson GMP Limited or its affiliates. Assumptions, opinions and estimates constitute the author’s judgment as of the date of this material and are subject to change without notice. We do not warrant the completeness or accuracy of this material, and it should not be relied upon as such. Before acting on any recommendation, you should consider whether it is suitable
for your particular circumstances and, if necessary, seek professional advice. Past performance is not indicative of future results. The comments contained herein are general in nature and are not intended to be, nor should be construed to be, legal or tax advice to any particular individual. Accordingly, individuals should consult their own legal or tax advisors for advice with respect to the tax consequences to them, having regard to their own particular circumstances. Richardson GMP Limited is a member of Canadian Investor Protection Fund. Richardson is a trade-mark of James Richardson & Sons Limited. GMP is a registered trade-mark of GMP Securities L.P. Both used under license by Richardson GMP Limited.

Mark Leibovit: What the Smartest People Are Doing
When the financial system crashes either by its own weight or perhaps by actions of Russia, China or Islamic terrorism, think about what assets you want to own – a bank account? – a brokerage account? What if you are locked out? I’m holding my gold and adding all the way down. I would also suggest keeping a generous amount of cash, food, and firearms under the mattress as insurance. That is what the smartest people I know are doing.
Jim Rogers Warns Its Time To Be Prepared
Eventually the market is just going to say to these central bankers, ‘enough is enough – we don’t want your garbage paper anymore.’
Then we’re going to have the real crisis.
 Kiss the Euro Goodbye …
It’s the grand experiments of harebrained politicians that are always the root cause of discontent. They endlessly tinker with the likes of you and me, with the economy, with things they don’t have a clue about …
Until the whole house of cards comes crashing down.
Two weeks ago, regarding the miners we wrote:
If it (GDXJ) surpasses its 80-week moving average then its next target is $27-$28. Meanwhile, GDX is holding above previous resistance at $18. Its next strong resistance targets are $21 and $22.
Earlier today GDX and GDXJ came within pennies of $21 and $29 respectively while Gold touched $1280 before reversing. While Gold and gold stocks could continue a bit higher, their rebound may have ended Friday morning.
A weekly candle chart of GDXJ and GDX is below. The miners over the past six weeks have formed six white candles and taken out their 80-week moving averages, which contained the strongest rallies during the bear market. However, the miners formed a nasty reversal on Friday after touching resistance earlier in the day. The miners could, at the least, test their 80-week moving averages which are now support.

GDXJ, GDX Weekly Candles
The recent rebound was similar to that from the October 2008 lows. Then, GDX rebounded 69% (from low tick to high tick) in five weeks while over the past six weeks GDX surged 68%. Then, GDX corrected 20%. GDX also corrected 29% during that rebound. In recent weeks GDX has not corrected more than 10%. It would not be unreasonable for GDX to correct 20% or even 25% from Friday’s high.
Meanwhile, Gold reversed course after reaching a confluence of resistance which includes the 40-month moving average. There remains a small chance that Gold could test $1300/oz before correcting. Gold has support at $1240/oz and $1200/oz.
The bearish reversal at resistance coupled with history makes a strong argument that gold stocks could correct recent gains in the days and weeks ahead. A 20% decline would be normal and reasonable given the context. For those of us waiting for a correction, it could be coming. The month of March may provide the best buying opportunity in the miners since December 2015.

-
I know Mike is a very solid investor and respect his opinions very much. So if he says pay attention to this or that - I will.
~ Dale G.
-
I've started managing my own investments so view Michael's site as a one-stop shop from which to get information and perspectives.
~ Dave E.
-
Michael offers easy reading, honest, common sense information that anyone can use in a practical manner.
~ der_al.
-
A sane voice in a scrambled investment world.
~ Ed R.
Inside Edge Pro Contributors

Greg Weldon

Josef Schachter

Tyler Bollhorn

Ryan Irvine

Paul Beattie

Martin Straith

Patrick Ceresna

Mark Leibovit

James Thorne

Victor Adair