
Currency
Australian Dollar Danger!
SYDNEY, Aug 24 (Reuters) – …Fuelled by Chinese-led demand for its coal, iron ore and other resources, Australia’s economy was one of the few in the developed world to sail through the global financial crisis without sliding into recession.
But questions over whether the decade-long bull run in commodities has ended have become louder in recent weeks as data shows China heading for the slowest pace of annual growth in more than a decade, driving down the prices of copper, iron ore and other raw materials.
We have been very bearish on the Australian dollar. The reason is a simple one. It is the belief that as China goes, so goes the Australian economy.
The rationale is clear: the Australian mining sector is the driving force for GDP growth in Australia. Continued prosperity in the mining sector is a direct function of demand for commodities from China. We believe Chinese growth is falling fast, much faster than official statistics indicate. If this is true, the Australian economy has peaked in this cycle and soon the Australian dollar will feel the pain of this deceleration in growth.
From Professor Michael Pettis, finance professor at Peking University [our emphasis]:
China’s official GDP growth rate has fallen sharply – … Beijing announced that GDP growth for the second quarter of 2012 was a lower-than-expected 7.6% year on year, the lowest level since 2009 and well below the 8.1% generated in the first quarter. This implies of course that quarterly growth is substantially below 7.6%. Industrial production was also much lower than expected, at 9.5% year on year. In fact China’s real GDP growth may have been even lower than the official numbers. This is certainly what electricity consumption numbers, which have been flat, imply, and there have been rumors all year of businesses being advised by local governments to exaggerate their revenue growth numbers in order to provide a better picture of the economy.
Some analysts believe China’s growth was flat for the second quarter. But China never lets its official numbers get in the way of a good story. As you can see in the chart below, exports are tumbling across all regions. We expect this to continue. Not only because of a deepening recession shaping up in the Eurozone – the largest customer for China – but because of a secular change in consumer demand globally.
It has been about four years since the credit crunch crisis, and the US consumer is still deleveraging, i.e. paying down debt despite the fact the US government is creating more debt in a desperate attempt to maintain growth.
Though we don’t have the number for European consumers, but given how badly their economies are performing, you can expect this pattern to be similar across Europe. In fact, we suspect it could be worse as unemployment across the Eurozone is now at an all-time high and rising. So, it is quite plausible to believe the trend in China’s GDP growth will continue to fall…
…especially when you consider that Chinese manufacturing is now shrinking based on the latest Purchasing Managers Index numbers (below 50 represents contraction). Though US PMI is still expanding slightly, PMI numbers are falling for all three of the globes major growth and demand drivers:
China’s Model is flawed for the Shape of Global Economy
The reason a secular decline in global consumption is so dangerous for China is because its entire model is predicated on a sustained rise in external demand. No longer can the world absorb China’s trade surplus. [According to Professor Pettis, China’s trade surplus by 2007 as a share of global GDP “had become the highest recorded in 100 years, perhaps ever, and the rest of world found it increasingly difficult to absorb it.]
China has made massive internal infrastructure investments over the years. And this internal investment ramped up dramatically after crisis of 2008 in an effort to sustain growth. Instead, it has created huge levels of excess production capacity across many of its key industries leading to a surge in debt and bad loans not yet realized.
China’s business conditions continue to deteriorate. Cement, coal and steel prices are still falling. Overcapacity is severe in most industries. Local governments pressure loss-making enterprises to continue production to sustain local GDP. Hence, commodity prices are falling below total costs. Soon the prices may fall below variable costs.
There is another testing point ahead. If local governments want to sustain production levels, they have to arrange bank loans to support loss-making production. The central government has loosened up liquidity control. Bank lending conditions have been eased. Approvals for corporate bonds have been accelerated. It is possible that production levels would be sustained into the fourth quarter despite falling commodity prices. Of course, the financial system will suffer bad assets from propping up loss-making production.
Andy Xie, Caixin Online
The natural transition for China would be more dependence on internal consumer demand, since external demand it falling. But it is not that simple.
Keep in mind that massive internal investment is effectively a transfer of wealth from the household sector of the economy (China has lowest percentage of consumer demand relative to GDP than any country in history). This is done by artificially lowering deposit rates, and forcing consumers to keep money inside the country. This is a standard developing country model. But it is extreme in China.
The winners in such a system, known as financial repression, are the net borrowers. In China this is local governments, state owned enterprises, and real estate developers. The losers are consumers. This should help explain why consumption penetration is so low.
The reason this model is now becoming untenable is because external demand is not creating the wealth necessary to keep household income growth rising. It is why we are seeing increasing levels of unrest throughout China. But the powers-that-be, who have benefitted mightily from this growth model, have a vested interest to keep things as they are. Just keep lowering interest rates and providing us more credit, we will keep building…
But credit allocation to the already powerful players means income inequality is soaring in China. Those with political power do well, those without it do badly. More from Andy Xie [our emphasis]:
Addressing income inequality has become fashionable. There is speculation that the government will unleash a plan for improving income and wealth inequality. Unfortunately, the discussions so far are misleading at best and could incite social conflicts. Rapidly rising income inequality in China is not a result of market competition. It cannot be compared to what occurred in mature market economies at all. The rising inequality is due to asset bubbles and gray income. Both are due to rapidly rising money supply that has increased government’s role in the economy and fueled asset bubbles.
The concentration of monetary resources in the state sector has led to surging gray income. It is the other important factor in income inequality. It translates monetary growth into inflation. The cost of inflation has been spread among the general population whose fruits from labor have been devalued against rising prices. One could argue that China’s rising inequality is a policy result.
Speculative gains and gray income are a form of inflation tax on the people. They are sustained by rapid monetary growth. Hence, China’s rising inequality is a policy choice, not a consequence of market competition.
The discussions over inequality are misconstrued as rich vs. poor, as in other countries. This is totally wrong. It should be about asset bubbles, excessive monetary growth, the excessively big government role in the economy and the resulting surging gray income. There is a widely circulated view that Chinese people hate the rich. This is totally wrong, too. It is not about who is rich, but about how one becomes rich. Chinese people suspect that most riches in China are ill gotten. Unfortunately, this view is true. With widespread excess capacity, few entrepreneurs can get rich through normal market competition.
Thus, attempts for real reform in the Chinese model will be met with strong resistance from the most powerful within the country.
There are three likely outcomes here:
- A hard landing as all this wasteful spending is finally marked to market as export growth continues to deteriorate. But another jolt of credit to the system will prolong this final outcome; and only make it worse. So it is possible we see growth rebound slightly on more credit near-term.
- A lost decade situation similar to Japan’s bubble pop back in 1989. Growth and income fade’s together as policymakers and the powerful players refuse to unleash the household sector.
- A rebalancing and transition to more domestic-driven demand. This would require freeing up interest rates, letting the currency rise, and opening the capital account to allow consumers to invest outside the country. This would mean lower GDP growth for sure, but rising household income is more important to the average Chinese citizen. They would be quite happy with that tradeoff, and it would insure rising social stability.
If the US economy and European economy—China’s customers—do not recover soon, we expect a hard landing will be the path for the Chinese economy. We are not optimistic that China will be able to overcome powerful internal interests in order to follow the best path, option #3.
So, either way, we see China’s growth continuing to decelerate. It’ current growth model is dead in the water and will have to change either the easy way or the hard way. Therefore, this deceleration or crash in growth will hit the Australian economy hard. It is why we continue to believe the Australian dollar is trading at an extraordinary premium to reality.
Note: This article was originally sent to Jack and JR’s subscribers of the World Currency Trader which covers currency ETF and currency ETF Options trading ideas. It is a publication of Weiss Research and edited by Jack and JR Crooks. If you would like more information on this publication you can contact Jack and JR at info@blackswantrading.com


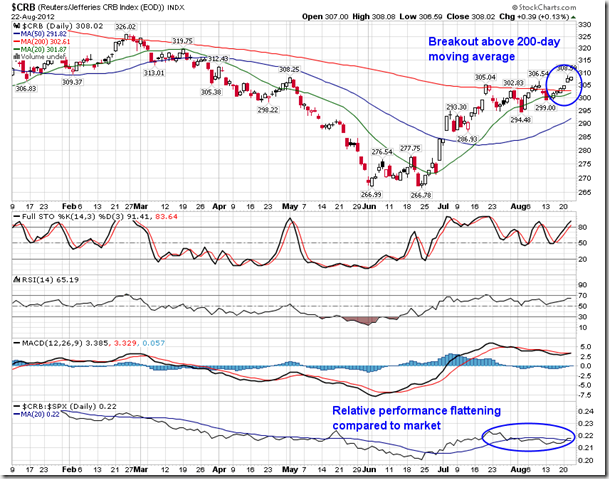
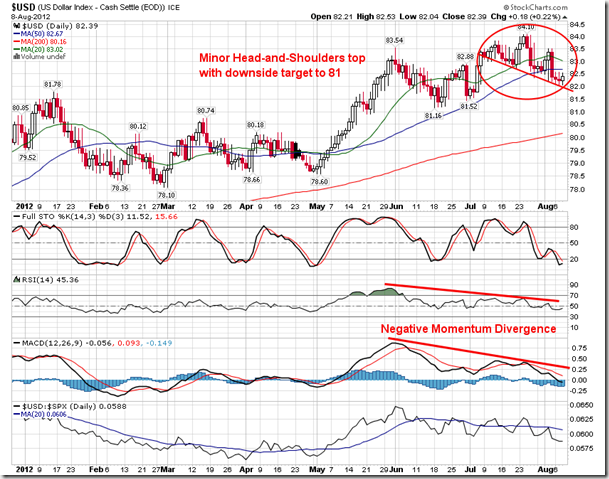
“With the Fed’s suggestion of further monetary easing, commodities rallied, breaking firmly above the 200-day moving average, according to the CRB Commodity Index. And while commodities rallied, the US Dollar Index plunged, coming close to achieving the target suggested by the short-term head-and-shoulders top of 81. This bearish setup for the US Dollar was pointed out on this site at the beginning of the week, however, thoughts were that the move would play out over a matter of weeks rather than days. With the US Dollar nearing that downside target, the long-term rising trend-line could soon be tested, potentially offering a hindrance to this commodity rally. Despite the significant dollar decline over the past two sessions, equity markets have failed to move higher, hinting of equity market exhaustion at current overbought levels. The US Dollar Index remains seasonally negative through September before stabilizing into October and November”.

…..for more of Jon Vailoux’s analysis of the Markets go HERE
Equity Clock is a division of the Tech Talk Financial Network, a market analysis company that provides technical, fundamental and seasonality analysis on a daily basis via TimingTheMarkets.com and EquityClock.com. Equity Clock’s mission is to identify periods of reoccurring strength among individual equities in the market using methodologies presented by some of the top analysts in the industry, including that of Don Vialoux, author of TimingTheMarkets.com.
Feel free to use any of the content or seasonality studies (charts, timelines, or otherwise) presented as long as a link-back to this site at EquityClock.com is provided.
For further information on indicators used in reports presented on this site, please visit our reference page.
Overview
The United States government has five interrelated motivations for destroying the value of the dollar:
1. Creating money out of thin air on a massive basis is all that stands between the current state of hidden depression, and overt depression with unemployment levels in excess of those seen in the US Great Depression of the 1930s.
2. It is the most effective way to meet not just current crushing debt levels, but to deal with the rapidly approaching massive generational crisis of paying for Boomer retirement promises.
3. It creates a lucratively profitable $500 billion a year hidden tax for the benefit of the US government which is not understood by voters or debated in elections.
4. It is the weapon of choice being used to wage currency war and reboot US economic growth; and
5. It is an essential component of political survival and enhanced power for incumbent politicians.
In this article we will take a holistic approach to how individual short term, medium and long term pressures all come together to leave the government with effectively no choice but to create a substantial rate of inflation that will steadily destroy the value of the dollar.
If you have savings, if you rely on a pension, if you are a retiree or Boomer with retirement accounts – any one of these five fundamental motivations is by itself a grave peril to your future standard of living. However, it is only when we put all five together and see how the motivations reinforce each other, that we can understand what the government has been and intends to continue doing, and then begin the search for personal solutions.
….read more HERE
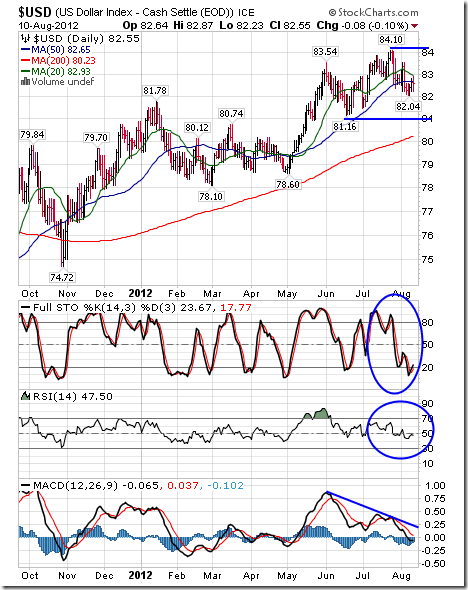
The U.S. Dollar Index added 0.17 (0.21%) last week. Intermediate trend is up. Support is at 81.16 and resistance is at 84.10. The Dollar remains above its 200 day moving average and below its 20 and 50 day moving averages. Short term momentum indicators are trending down.
Ed Note: Don’s Monday Site is well worth visiting HERE
Economic News This Week
July Producer Prices to be released on Tuesday at 8:30 AM EDT is expected to increase 0.2% versus a gain of 0.1% in June. Core PPI is expected to increase 0.2% versus a gain of 0.2% in June.
July Retail Sales to be released on Tuesday at 8:30 AM EDT are expected to increase 0.3% versus a drop of 0.5% in June. Ex autos, July Retail Sales are expected to improve 0.4% versus a decline of 0.4% in June.
The August Empire State Manufacturing Index to be released on Wednesday at 8:30 AM EDT is expected to slip to 7.2 from 7.4 in July.
July Consumer Prices to be released on Wednesday at 8:30 AM EDT are expected to increase 0.2% versus no change in June.
July Industrial Production to be released on Wednesday at 9:15 AM EDT is expected to increase 0.5% versus a gain of 0.4% in June. July Capacity Utilization is expected to increase to 79.2 from 78.9 in June.
July Housing Starts to be released on Thursday at 8:30 AM EDT are expected to slip to 752,000 from 760,000 in June.
August Philadelphia Fed to be released on Thursday at 10:00 AM EDT is expected to improve to -4.0 from -12.9 in July.
August Michigan Consumer Sentiment to be released on Friday at 9:55 AM EDT is expected to slip to 72.2 from 72.3 in July.
July Leading Indicators to be released on Friday at 10:00 AM EDT are expected to increase 0.2% versus a 0.3% decline in June.
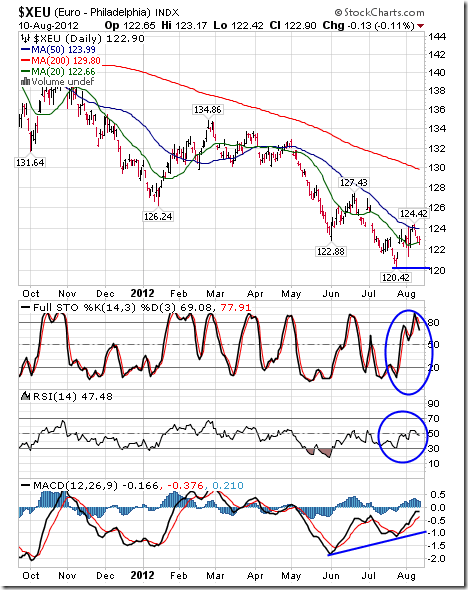
The Euro fell 0.87 (0.70%) last week. Intermediate trend is down. Support is at 120.42. The Euro remains below its 50 and 200 day moving averages and above is 20 day moving average. Short term momentum indicators are trending higher.
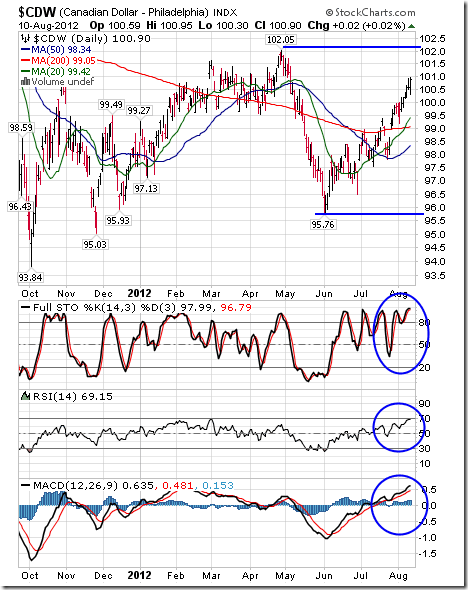
The Canadian Dollar added 1.03 cents U.S. (1.03%) last week. Intermediate trend is neutral. Support is at 95.76 and resistance is at 102.05. The Canuck Buck remains above its 20, 50 and 200 day moving averages. Short term momentum indicators are overbought, but have yet to show signs of peaking.
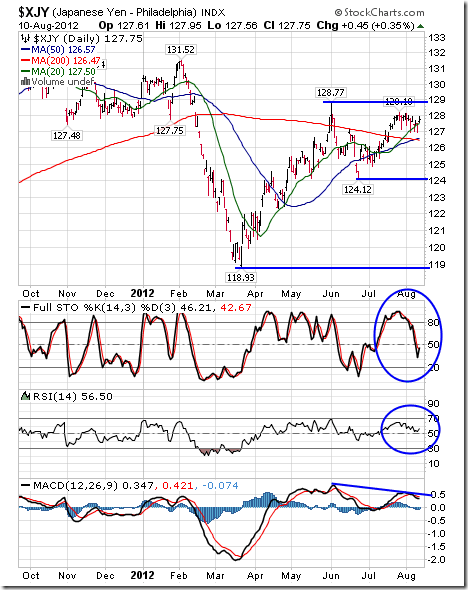
The Japanese Yen added 0.45 (0.35%) last week. Intermediate trend is down. Support is at 124.12 and resistance is at 128.77. The Yen remains above its 20, 50 and 200 day moving averages. Short term momentum indicators are trending down.
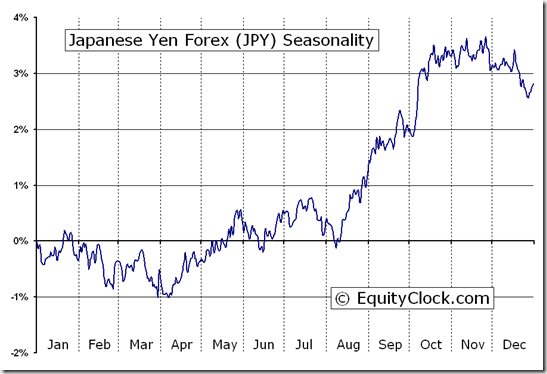
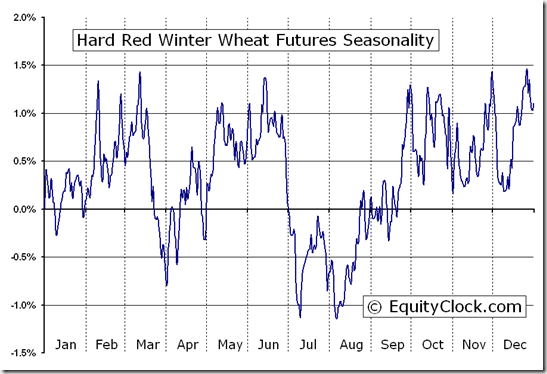
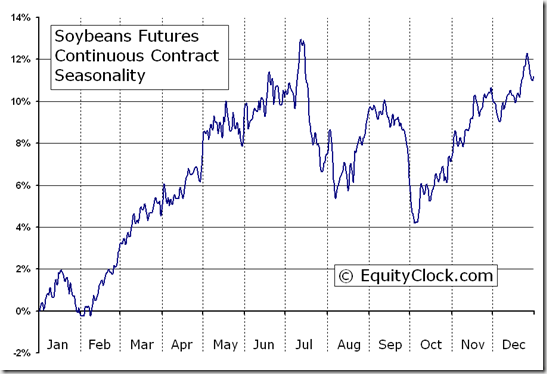
Seasonality refers to particular time frames when stocks/sectors/indices are subjected to and influenced by recurring tendencies that produce patterns that are apparent in the investment valuation. Tendencies can range from weather events (temperature in winter vs. summer, probability of inclement conditions, etc.) to calendar events (quarterly reporting expectations, announcements, etc.). The key is that the tendency is recurring and provides a sustainable probability of performing in a manner consistent to previous results.
Identified below are the periods of seasonal strength for each market segment, as identified by Brooke Thackray. Each bar will indicate a buy and sell date based upon the optimal holding period for each market sector/index.

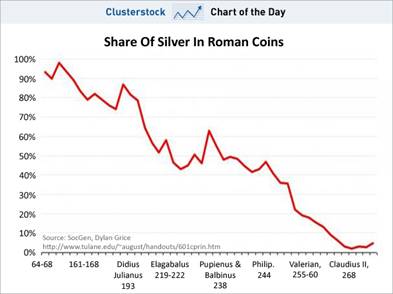
“Debasement was limited at first to one’s own territory. It was then found that one could do better by taking bad coins across the border of neighboring municipalities and exchanging them for good with ignorant common people, bringing back the good coins and debasing them again. More and more mints were established. Debasement accelerated in hyper-fashion until a halt was called after the subsidiary coins became practically worthless, and children played with them in the street, much as recounted in Leo Tolstoy’s short story, Ivan the Fool.” – Charles P. Kindleberger – Manias, Panics, and Crashes
The Holy Roman Empire debased their currency in the early 1600s the old fashioned way, by replacing good coins with bad coins. Any similarities with the U.S. issuing pennies that cost 2.4 cents to produce and nickels that cost 11 cents to produce is purely coincidental. I wonder what the ancient Greeks would think of our Olympic gold medals that contain 1.34% gold. The authorities have become much more sophisticated in the last one hundred years. Digital dollars are so much easier to debase. The hundred year central banker scientifically manufactured bust relentlessly plods towards its ultimate conclusion – the dollar reaching its intrinsic value of zero.
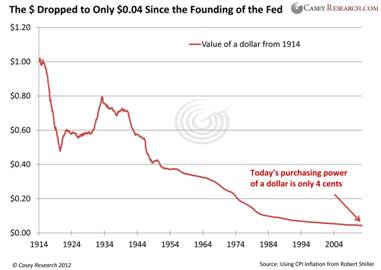
“It is well enough that people of the nation do not understand our banking and monetary system, for if they did, I believe there would be a revolution before tomorrow morning.” – Henry Ford
Henry Ford made this statement decades before the debasement of our currency entered overdrive. The facts reflected in the chart above should have provoked a revolution, but the ruling class has done a magnificent job of ensuring the mathematical ignorance of the masses through government education, mass media propaganda, and statistical manipulation of inflation data to obscure the truth. Mainstream economists have successfully convinced the average American that inflation is good for their lives and deflation is dangerous to their wellbeing. There are economists like Kindleberger, Shiller and Roubini who have brilliantly documented and predicted various bubbles, despite being scorned a ridiculed by the captured mouthpieces for the oligarchs. But even these fine men have a flaw in their thinking. They can see speculative manias spurred by irrational beliefs and delusional thinking, but are blind to the evil manipulations of bankers, politicians, and corporate titans. They believe that humans with Ivy League educations can outsmart markets and through the fine tuning of interest rates, manipulation of the money supply and provision of liquidity through a lender of last resort, can control the financial system and avoid panics.
……read much more HERE

-
I know Mike is a very solid investor and respect his opinions very much. So if he says pay attention to this or that - I will.
~ Dale G.
-
I've started managing my own investments so view Michael's site as a one-stop shop from which to get information and perspectives.
~ Dave E.
-
Michael offers easy reading, honest, common sense information that anyone can use in a practical manner.
~ der_al.
-
A sane voice in a scrambled investment world.
~ Ed R.
Inside Edge Pro Contributors

Greg Weldon

Josef Schachter

Tyler Bollhorn

Ryan Irvine

Paul Beattie

Martin Straith

Patrick Ceresna

Mark Leibovit

James Thorne

Victor Adair