
Asset protection
 The global financial system is now getting out of control. While the clowns on the financial networks continue to regurgitate the same bullish propaganda, “that everything will be fine”, quite the opposite is the case. The system is so broken and the leverage propping it up is so extreme, the result will be the largest financial and economic calamity the world has ever seen.
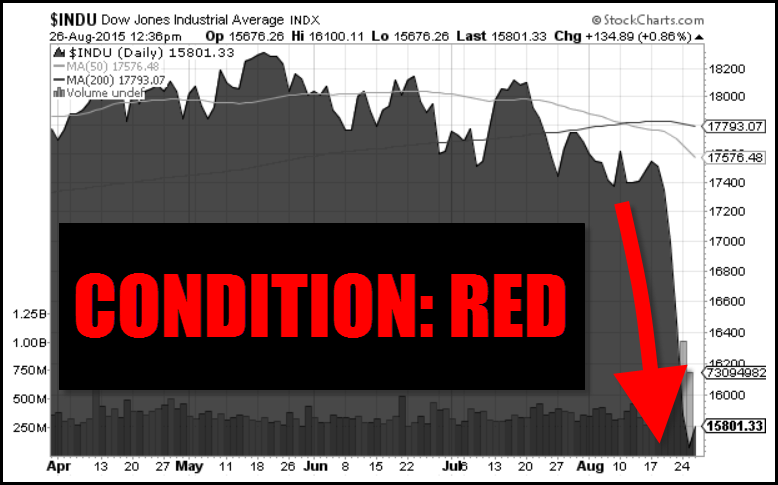
To get an idea just how broken the system has become, here is the Dow Jones chart of Monday’s trading activity from Zerohedge’s article Behold: Insanity:

After the Asian markets received a financial enema Sunday night as the Hang Seng fell more than 1,200 points and the Nikkei nearly 950 points (at their lows), the Dow Jones experienced one of the strangest trading days ever. Of course, the Dow Jones suffered large single-day losses before, but never the sort of volatility as it experienced this Monday, August 24th.
I would imagine this type of volatility can be explained by the HFT – High Frequency Traders that have now taken over the majority of trading in the markets. This type of stock market insanity wouldn’t have taken place 10 years ago as the system still had a great deal of retail traders. Thus, human retail trading activity would move slower and take more time in mulling over information.
The Dow Jones moved over 4,500 points (up & down) on Monday. This should be a warning to investors that serious dislocations in the market are coming.
Beginning Stages Of A Run On The Retail Precious Metal Market??
Ever since the middle of June when Greece threatened to leave the European Union, sales of gold and silver bullion exploded. Investors purchased a record 176,000 oz of Gold Eagles in July. This was the highest monthly sales figures in several years.
Even though the rate of Gold Eagle sales declined in August compared to July, they picked up significantly over the past few days surpassing 30,000+ oz to a total of 68,500 oz for the month.
While sales of Gold Eagles have been the strongest in several years, Silver Eagle sales continue to beat all records. Not only are sales of Silver Eagles 12% higher at 31.5 million oz (Moz) compared to 28.2 Moz during the same period last year, total sales for June, July and August are a staggering 14.5 Moz. If the U.S. Mint continued to sell Silver Eagles at the same rate over the past three months, total sales would reach an annual 58 Moz.
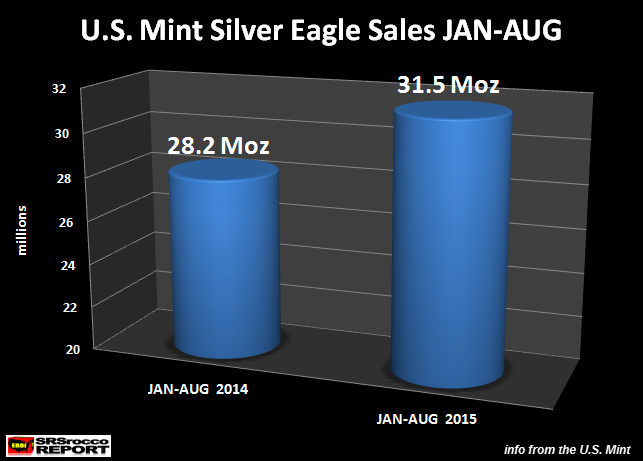
We also must remember, there is still another U.S. Mint update on August 31st. Most of the time, the U.S. Mint updates its sales figures on Monday, but this week they waited until Tuesday. If they update their sales figures on Monday, we could see total sales for August at 4.8-5 Moz.
I contacted a few dealers to see what was going on in the retail end of the market. Here was their reply:
Indian Silver Imports in 2015 May Easily Surpass 9,000 Metric Tons
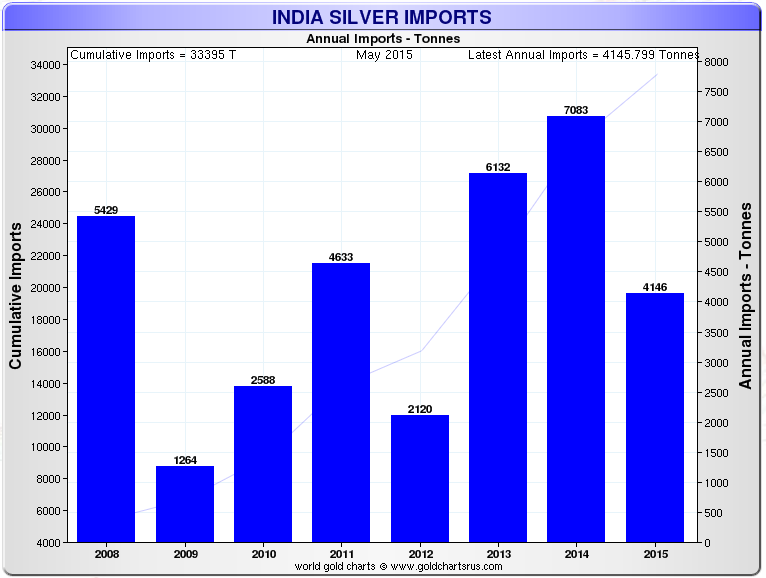
According to the data put out by Sharelynx.com, total Indian silver imports from Jan to May reached a staggering 4,146 metric tons (134 Moz):
According to ETF Securities May 2015 Precious Metals Monthly Report:
Demand from India continues to impress. From 2005 through 2013 India silver imports averaged just under 100 million (mn) ounces per year. In 2014, on the back of substantial restrictions put on gold use and the sharp drop in the silver price, India silver imports jumped to 230 mn ounces. With the election of Mr. Modi and some easing of the gold restrictions, silver use in India was generally expected to decline in 2015. But this has not been the case, as of the end of May. The latest data through April show India silver imports running about 30% above the 2014 record pace, on track for about 300 mn ounces of imports in 2015. India imports alone are on pace to consume about 1/3 of total global silver supply available in 2015. The rapid pace of India imports is likely to subside but indications of strong demand for silver are clear.
Two important points from the ETF Securities analysis on Indian silver demand:
1) Annual silver imports averaged less than 100 Moz from 2005-2013. This increased significantly in 2014 (230 Moz) and 2015 (300-320 Moz). Basically, Indian silver imports in 2015 are on track to be three times their 2005-2013 rate.
2) Most analysts forecasted a decline of Indian silver use due to new election of Mr. Modi and his easing of gold restrictions in 2015. However, the opposite is the case and Indian silver imports Jan-May are 62% higher than the same period last year.
Investors need to realize this huge increase of Indian silver imports is just another sign that ALL IS NOT WELL in the system. If things get out of control with the broader stock markets in September-October, Indian silver demand could actually push their total imports to 10,000 metric tons (320 Moz).
Don’t Be Fooled By The Dow Jones Dead Cat Bounce
Today the Dow Jones closed up 619 points. I would imagine the nitwits on CNBC are smacking each other on the back stating, “A Victory is Near.” How can the Dow Jones be up 619 points, while oil is down in the $38 range and most commodities are in the red?? Shouldn’t stocks be indicative of the health of the overall economy? LOL… not anymore.
This is nothing more than the typical Dead Cat Bounce. Why? Markets never go down in a straight line and I imagine the Dow Jones needed to take a breather after suffering a total 1,842 point loss since the declines started last Wednesday. If there are any folks out there who are still playing a game of “CHICKEN” by trying to time the markets, you may be in for a rude awakening.
The Degree Of Stupidity In The Financial Media Is Off The Charts
Recently, John Mauldin (a regular guest on King World News) put out one of the most ludicrous articles on energy that I have seen in quite some time. Now, of course I’ve read some lousy ones by the MSM, but Mauldin is an analyst with a foot in the alternative media camp… which makes it even worse.
His article, Riding The Energy Wave To The Future was so awful, it invoked a reply from energy perma-bear James Howard Kunstler: As Fracking Implodes, The Clowns Deny Reality. Even though I enjoyed Kunstler’s reply by posting it on my site, I wanted to include a rebuttal from one of the best energy analysts that I follow.
I sent Mauldin’s article to Art Berman who has his own energy blog called ArtBerman.com. I suggest those interesting in knowing what’s really going on in the energy industry, to check out his blog. Art replied to Mauldin’s nonsense with the following:
John Mauldin Defends Faith, Fails Economics 101
Mauldin says he is an economist and yet there is no economic data in his monologue. It is fascinating that production efficiency has become the new justification for the continued inefficient use of energy. For him, growing production volume equals commercial success.
He worships at the alter of technology but fails to grasp its cost and its limits. He blindly accepts the self-promoting proclamations of oil company executives without testing whether their claims are supported by economic facts.
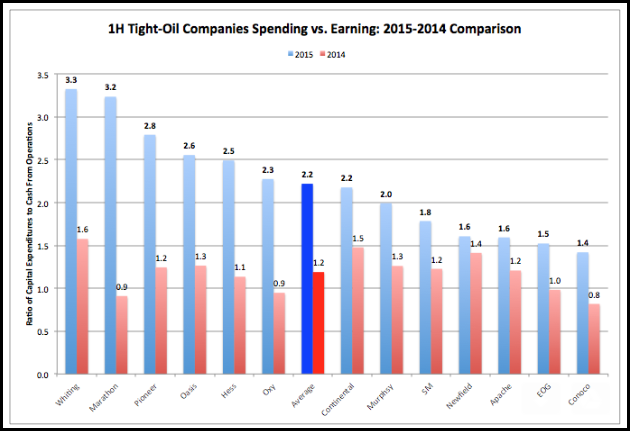
For example, he cites EOG’s claim that they are more profitable at low oil prices than they were a few years ago at high oil prices. All that is necessary is to compare EOG’s cash flow now vs. a year ago to see that is a false statement.
Source: Company 10-Qs and Google Finance.
Although EOG is one of the best of a bad lot when it comes to tight oil producers (and I own EOG stock), they were cash-flow neutral in 1H 2014 when oil prices averaged $101/barrel and they were cash-flow negative in 1H 2015 when oil prices averaged $53/barrel, spending $1.50 for every $1 they earn from operations.
EOG’s statement that he takes as true is easy to test and it proves to be false. But he is too much of a true believer or too lazy to run the simple test using Google Finance and taking less than 5 minutes.
Most of the claims of continued profits at lower oil prices are based on incorrect reserve assumption and the exclusion of significant costs of doing business like G&A and interest expense.
I recently completed an evaluation of key company average well reserves in the Bone Spring play in the Permian basin. My reserve estimates based on solid history matches suggest an average well EUR of 205 kboe using the top 6 operators in the play. Simmons & Company International published a report on break-even prices last week that uses 676 kboe per well. A more than 3-fold exaggeration in reserves will get you more favorable economics every day of the week, and they acknowledge no G&A, interest expense, geologic and geophysical costs, etc.
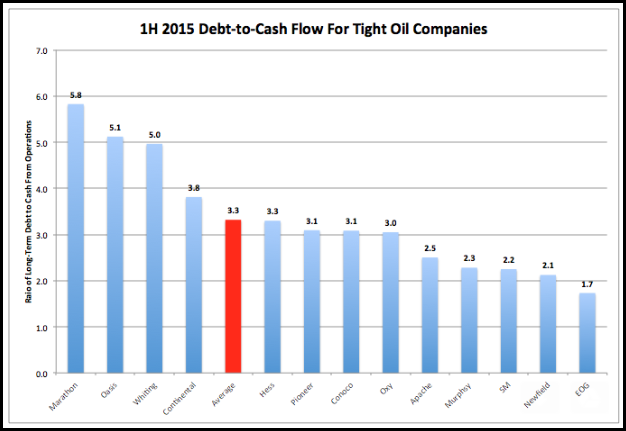
The 1H 2015 tight oil debt-to-cash from operations ratio is chilling.
Source: Company 10-Qs and Google Finance.
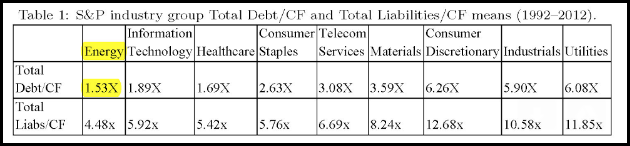
If the companies are truly making a profit at low oil prices why are they all above any reasonable debt covenant threshold (the 20-year E&P average is 1.53).
Source: Bank of Finland Research Discussion Papers 11-2014.
Please see the second half of my blog from Wednesday on 1H financial results: http://www.artberman.com/world-oil-supply-decreased-demand-increased-in-july-eia/
These are a few of my thoughts and observations about Mauldin’s piece.
Art does a great job cutting through all the BS, by stating some simple facts. I am surprised that Mauldin believes the garbage he wrote in that article. This is an ongoing phenomenon in the financial media.
This U.S. Shale Oil Industry is in serious trouble. Watch for serious declines in U.S. oil production over the next 6-12 months. As I stated several times, I believe U.S. oil production will fall 33% by 2020 and 60-70% by 2025. The KING DOLLAR gets its strength from controlling global energy markets. When U.S. oil production declines to less than 5 million barrels a day, and oil exporters will no longer take worthless Dollars for oil…. Americans will be in a world of hurt.
This is precisely the reason to own physical gold and silver. The U.S. and Global Markets are now entering CONDITION RED. Best to have your precious metal insurance while you can still get them.
Please check back for new articles and updates at the SRSrocco Report. You can also follow us at Twitter

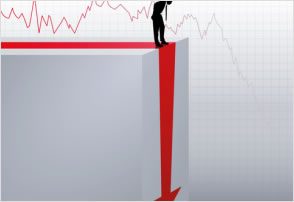
Is this is just a Market Correction and time to buy at a discount….. or the beginning of a Great Financial Catastrophe where everyone will lose money.
The first article argues this is nothing more than a Market Crash similar to those in 1987, 2000, 2007. That it is not the time to dump well researched positions, that it is indeed a time to get ready to invest more capital (if you have it).
The temporary impact of the corrections listed above on long-term holdings can be seen in this chart below:
The second article argues this is the beginning of a Great Bear Market and “that 2007-8 was just a mild rehearsal of what we soon are going to experience“. That “this autumn to be the beginning of the end of the 100 year old failed experiment of manipulation and repression of the financial system by bankers and central banks.”
In other words, a long bear market is just beginning. A societal and market bear market that will dwarf anthing seen since the 1930’s.
To read the first argument, that this is just a correction, read Mauldin Economics – A Correction Fireside Chat
To read the second argument, that it is about to get as bad as it ever gets, read Egon Von Greyerz’s – The Great Financial Catastrophe

 The crisis of the global financial markets, that so many have been fearing, looks as though it has arrived.
The importance of the Chinese devaluing their Yuan is effectively starting the process of “de-pegging” its’ relationship to the U.S. Dollar. The change in policy is likely to have unintended consequences which are leading to new problems in todays’ currency wars; especially, as the Federal Reserve lacks the initiative to start increasing their own rates. Chinas’ pre-emptive currency strike complicates the process of the Federal Reserves’ long range policies in which the US Dollar would have been strengthened. The Federal Reserve has paused and believes that this is not the right time to raise rates. Two weeks ago, the global equity markets came to the same conclusion as the global markets plunged, as equity prices accelerated.
The devaluation of the Yuan would normally be viewed as positive for Chinese businesses that will attract a greater marke t share of the world trade, due to the value of a lower currency. Instead, the Chinese market plummeted last week. Their indecision to hold off raising its rate increase would usually have a bullish effect in the U.S. stock markets, but instead they fell to their lowest level of this year. Fridays’ carnage alone being a 530 point decline in the DJIA. The Dow Jones Industrial Average is now down 10% from its’ high of May 19th, 2015 at 18, 351.
Fed Chair Janet Yellen is currently paralyzed and is lacking the leadership and decision making ability of what the next steps should be. I mentioned this in my column dated August 20th, 2015. This is a preview of what to expect in mid-September, rather than the “irrational exuberance” associated with panic and hysteria. We are approaching the 7-year bear market-cycle and the months of September and October typically are the starting months for such trend changes. At that time, markets are destined to remain volatile, with opportunities for both up and down periods which I share in my Global Financial Reset trades within my core newsletter.
The Chinese devaluation of the yuan has sparked the beginning of a continued currency war, in which, many nations desire a cheaper currency in order to aid them with their exports. The US dollar is already considered overpriced. This places the Fed in a dilemma. If they raise short-term rates, for the first time in six years, the dollar will become more overpriced than ever before. Exports will suffer.
India, Russia and Thailand are now preparing for a new currency war. The rest of the world is now scrambling so that they are not the last nations standing to devalue their currencies. The Federal Reserves’ lack of leadership, by increasing interest rates, will cause other countries to devalue their currencies even further.
In terms of equity markets and geopolitical events, the next few weeks are critical.
In my forecast, last week, I stated that the Federal Reserve could not raise interest rates. My views remain fully intact and align with my analysis that the FED has already sparked a “currency crisis”. The financial carnage which we witnessed last Thursday and Friday, was truly global in its scope. On a percentage basis, Chinese stocks crashed even more than the U.S. stocks did. Japanese stocks also crashed, as well as stock markets all over Europe and the emerging market currencies were impacted globally, which is causing an “asset bubble” to explode exponentially.
Our monetary expansion policy has been based on “Quantitative Easing”. Our current resulting deflationary spiral has sucked the global economy into it a dark vortex. Wall Street is going under due to the fact that this time, the Fed is utterly powerless to reverse this trend again.
Our entire economy is currently based on the concept of a “Ponzi Scheme”. It has been built on the expectations that should never have been assumed. The idea that we can create real economic growth and distributed wealth using temporary artificial fixes is absurd.
I do not believe that this crisis will be over by the end of 2015. This is just the start of the crisis. Events will continue to unravel as we move into 2016 and beyond. This existing crisis will continue to last for years and it is going to be very painful beyond what most people can imagine.
Any attempts by the FEDs to raise interest rates, at this time, will further exacerbate the existing economic global disaster.
If my next economic update I will share with you some sobering information one what US equities have experienced in the past 10 months and what it means for traders and investors.
Chris Vermeulen – www.TheGoldAndOilGuy.com – Special Offer

 …. Plus One Of The Greatest Opportunities in History
In HistoryWorldwide chaos in global markets continues as China’s stock market meltdown resumes and the PPT intervenes, and this came on the heels of some truly historic trading action in the Dow, so today a 50-year market veteran spoke with King World News about the global chaos, the Plunge Protection Team intervention, plus one of the greatest opportunities in history.
 Are you prepared for further turmoil?
The global deflationary wave we have been tracking since last fall is picking up steam. This is the natural and unavoidable aftereffect of a global liquidity bubble brought to you courtesy of the world’s main central banks. What goes up must come down — and that’s especially true for the world’s many poorly-constructed financial bubbles, built out of nothing more than gauzy narratives and inflated with hopium.
What this means is that the traditional summer lull in financial markets has turned August into an unusually active and interesting month. August, it appears, is the new October.
Markets are quite possibly in crash mode right now, although events are unfolding so quickly – currency spikes, equity sell offs, emerging market routs and dislocations, and commodity declines – that it’s hard to tell for sure. However, that’s usually the case right before and during big market declines.
Before you read any further, you probably should be made aware that, at Peak Prosperity, our market outlook has been one of extreme caution for several years. We never bought into so-called “recovery” because much of it was purely statistical in nature, and had to rely on heavily distorted and tortured ‘statistics’ to be believed. Okay, lies is probably a more accurate term in many cases.
Further, most of the gains in financial assets engineered by the central banks were false and destined to burst because they were based on bubble psychology, not actual returns.
Which bubbles you ask? There are almost too many to track. But here are the main ones:
- Corporate bond bubble
- Corporate earnings bubble
- Junk bond bubble
- Sovereign debt bubble
- Equity bubbles in various markets (US, China) and sectors (Tech, Biotech, Energy)
- Real estate bubbles, especially in the commodity exporting countries
- Central bank credibility bubble (perhaps the largest and most dangerous of them all)
What’s the one thing that binds all of these bubbles together? Central bank money printing.
Passing The Baton
Operating in collusion, the world’s major central banks passed the liquidity baton back and forth between them, first from the US to Japan, then from Japan to Europe, then back to the US, then over to Europe again where it now resides. Seemingly endless rounds of QE that didn’t always do what they were supposed to do, and plenty of things they were not intended to do.
The purpose of printing up trillions and trillions of dollars (supposedly) was to create economic growth, drive down unemployment, and stoke moderate inflation. On those fronts, the results have been dismal, horrible, and ineffective, respectively.
However, the results weren’t all dismal. Big banks reaped windfall profits while heaping record bonuses on themselves for being at the front of the Fed’s feeding trough. The über-wealthy enjoyed the largest increase in wealth gains in recorded history, and governments were able to borrow more and more money at cheaper and cheaper rates allowing them to deficit spend at extreme levels.
But all of that partying at the top is going to have huge costs for ‘the little people’ when the bill comes due. And it always comes due. Money printing is fake wealth; it causes bubbles, and when bubbles burst there’s only one question that has to be answered: Who’s going to eat the losses?
The poor populace of Greece is just now discovering that it collectively is responsible for paying for the mistakes of a small number of French and German banks, aided by the collusion of Goldman Sachs, in hiding the true state of Greek debt-to-GDP using sophisticated off-balance sheet derivative shenanigans. As a direct result, the people of Greece are in the process of losing their airports, ports, and electrical distribution and phone networks to ‘private investors’ — mainly foreigners harvesting the last cash-generating assets the Greeks have left to their names.
Broken Markets
As we’ve detailed repeatedly, our “markets” no longer resemble markets. They are so distorted, both by central bank policy and technologically-driven cheating, that they no longer really qualify as legitimate markets. Therefore we’ve taken to putting double quote marks around the word “market” often when we use it. That’s how bad they’ve become.
Where normal markets are a place for legitimate price discovery, todays “markets” are a place where computers battle each other over scraps in the blink of an eye, ‘investors’ hinge their decisions based on what the Fed might or might not do next, and rationalizations are trotted out by the media for why inexplicable market price movements make sense.
Instead, we view the “markets” as increasingly the playgrounds of, by and for the gigantic market-controlling firms whose technology and market information have created one of the most lopsided playing fields in our lifetimes.
Signs of these distortions abound. One completely odd chart is this one, showing that the average trading range of the Dow (ytd) was the lowest in history as of last week (before this week’s market turmoil hit). And that was despite Greece, China, QE, Japan, oil’s slump, Ukraine, Syria, Iran and all of the other ample market-disturbing news:
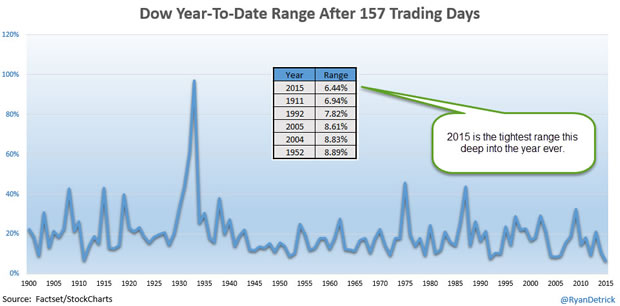
Source: Zero Hedge
Based on the above chart, you’d think that 2015 up through mid-August was the most serene year of the last 120 years. Of course, it’s been anything but serene.
The explanation for this locked-in trading range is a combination of ultra-low trading volume and the rise of the machines. There have been times recently when practically 100% of market volume was just machines playing against each other…no actual investors (i.e, humans) were involved.
As long as there was ample liquidity, then the machines were content to just play ping pong with the “market”. Which they did, crossing the S&P 500 over the 2,100 line 13 times before the recent sell-off took hold.
But that’s not the most concerning part about having broken markets. The most concerning thing centers on the fact that things that should never, ever happen in true markets are happening in todays “markets” all the time.
One measure of this is how many standard deviations (std dev) an event is away from the mean. For example, if the price of a financial asset moves an average of 1% per year, with a std dev of 0.25 %, then it would be slightly unusual for it to 2%, or 3%. However it would be highly unusual if it moved as much as 6% or 7%.
Statistics tells us that something that 3 std dev movements are very unlikely, having only a 0.1% chance of happening. By the time we get to 6 std devs, the chance is so small that what we’re measuring should only happen about once every 1.3 billion years. At 7 std dev, the chance jumps up to once every 3 billion years.
Why take it to such a ridiculous level? Because those sorts of events are happening all the time in our “markets” now. And that should be deeply concerning to everyone, as it was to Jamie Dimon, CEO of JP Morgan:
‘Once-in-3-Billion-Year’ Jump in Bonds Was a Warning Shot, Dimon Says
Apr 8, 2015
JPMorgan Chase & Co. head Jamie Dimon said last year’s volatility in U.S. Treasuries is a “warning shot” to investors and that the next financial crisis could be exacerbated by a shortage of the securities.
The Oct. 15 gyration, when Treasury yields fluctuated by almost 0.4 percentage point, was an “unprecedented move” that would have serious consequences in a stressed environment, Dimon, the New York-based bank’s chairman and chief executive officer, said in a letter Wednesday to shareholders. Treasuries are supposed to be among the most stable securities.
Dimon, 59, cited the incident as he waded into a debate about whether bank regulations implemented after the 2008 financial crisis exacerbate price declines by limiting the ability of Wall Street banks to make markets. It’s just a matter of time until some political, economic or market event triggers another financial crisis, he said, without predicting one is imminent.
The Treasuries move was “an event that is supposed to happen only once in every 3 billion years or so,” Dimon wrote. A future crisis could be worsened because there “is a greatly reduced supply of Treasuries to go around.”
Source: Bloomberg
While Mr. Dimon used the event to suggest that bank regulations were somehow to blame, that explanation is self-serving and disingenuous. He’d use any excuse to try and blame bank regulations; that’s his job, I guess.
Instead what happened was that our “market” structure is so distorted by computer trading algorithms, with volume so heavily distorted by their lighting-fast reflexes, that one of those ‘once in 3-billion years events’ resulted.
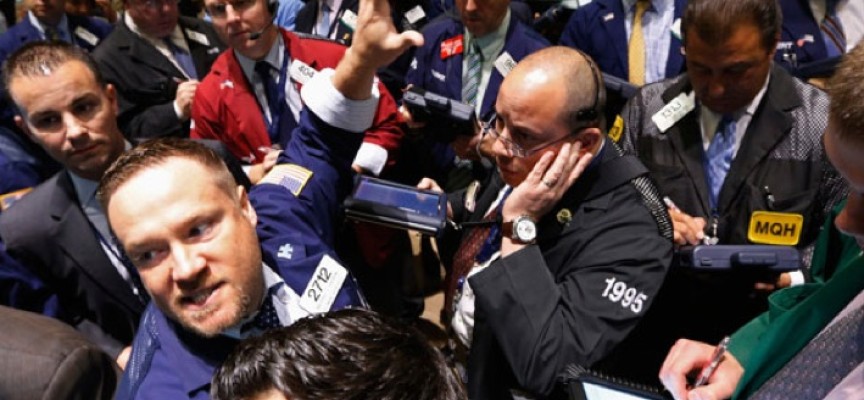
This simply wouldn’t have happened if humans were still the ones doing the trading, but they aren’t. All the colored jackets have been hung up at the CME, and human market makers on the floor of the NYSE are rapidly slipping away into the sunset as algorithms now run the show.
The good news about computers is that they allow our trading to be faster and cheaper, presumably with better price discovery. The bad news is that nobody really understands how the whole connected universe of them interact and that, from time to time, they go nuts.
As Mr. Dimon hinted, they have the chance of taking the next financial downturn and converting it into a certified financial meltdown
How common are these ‘billion year events’?
They happen all the time now. Here’s a short list:
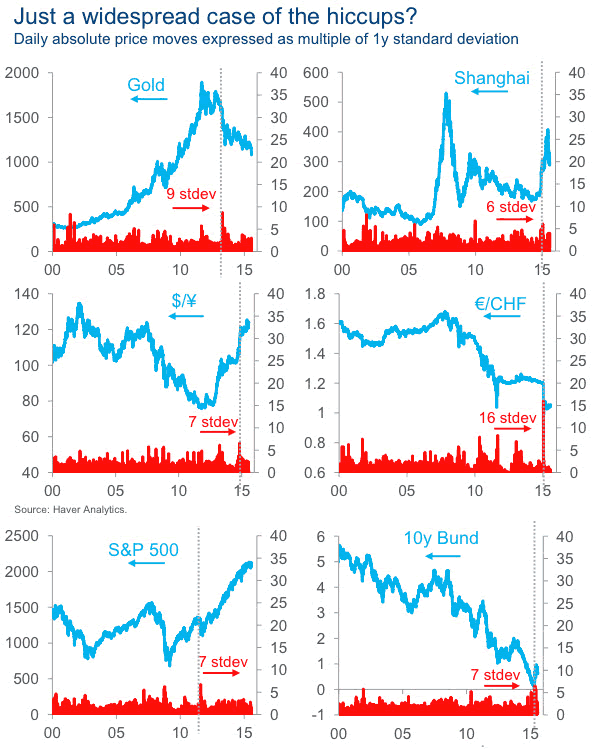
Source: Zero Hedge
All of this leads us to conclude that the chance of a very serious, market-busting accident is not only possible, but that the probability approaches 100% over even relatively short time horizons.
The deflation we’ve been warning about is now at the door. And one of our big concerns is that we’ve got “markets” instead of markets, which means that something could break our financial system as we know and love it.
From The Outside In
One of our main operating models at Peak Prosperity is that when trouble starts it always begins at the edges and moves from the outside in.
This is true whether you are looking at people in a society (food banks see a spike in demand well before expensive houses decline in price), stocks in a sector (the weakest companies decline first), bonds (junk debt yields spike first), or across the globe where weaker countries get in trouble first.
What we’re seeing today is an especially fast moving set of ‘outside in’ indicators that are cropping up so fast it’s difficult to keep track of them all. Here are the biggest ones.
Currency Declines
The recent declines in emerging market (EM) currencies is a huge red flag. This combined chart of EM foreign exchange shows the escalating declines of late.
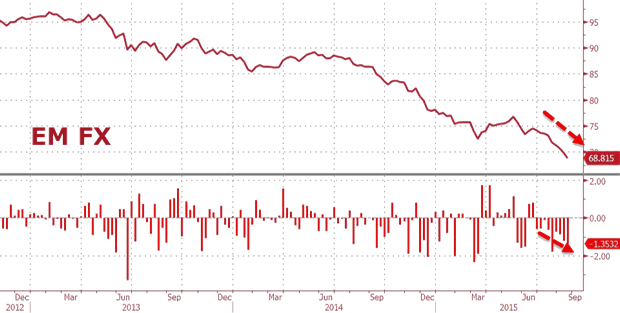
Source: Zero Hedge
Since last Monday, here’s the ugly truth:
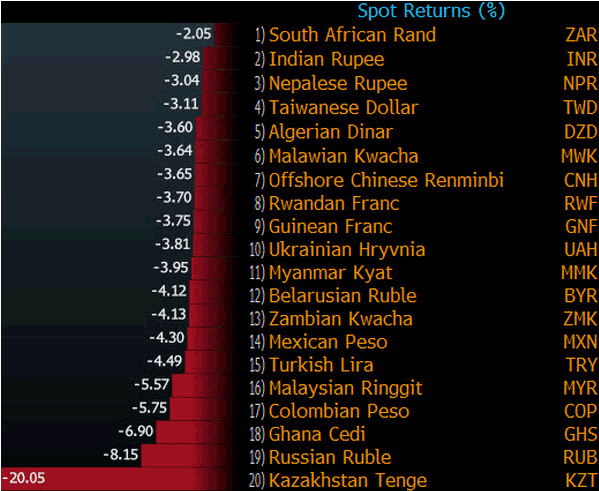
Many of these countries have been using precious foreign reserves to try and stem the rapid declines of their currencies, but I fear they will all run out of ammo before the carnage is over.
What’s happening here is the reverse part of the liquidity flood that the western central banks unleashed. The virtuous part of this cycle sees investors borrow money cheaply in Europe, the US or Japan, and then park in in EM countries, usually by buying sovereign bonds, or investing in local companies (especially those making a bundle off of the commodity boom that was happening).
So on the virtuous side, a major currency was borrowed, and then used to buy whatever local EM currency was involved (which drove up the value of that currency), and then local assets were bought which either drove up the stock market or drove down bond yields (which move as in inverse to price).
The virtuous part of the cycle is loved by local businesses and politicians. Everything works great. The currency is stable to rising, bond yields are falling, stocks are rising, and everyone is generally happy.
However when the worm turns, and it always does, the back side of this cycle, the vicious part, really hurts and that’s what we’re now seeing.
The investors decide that enough is enough, and so they sell the local bonds and equities they bought, driving both down in price (so falling stock markets and rising yields), and then sell the local currency in exchange for dollars or yen or euros, whichever were borrowed in the first place.
And thus we see falling EM currencies.
To put this in context, many of the above listed currencies are now trading at levels either not seen since the Asian currency crisis of 1997, or at levels never before seen at all. The poor Mexican peso is one of the involved currencies, which has fallen by 12% just this year, and almost made it to 17 to the dollar early this morning (16.9950). Battering the peso is also the low price of oil which is absolutely on track to destroy the Mexican federal budget next year.
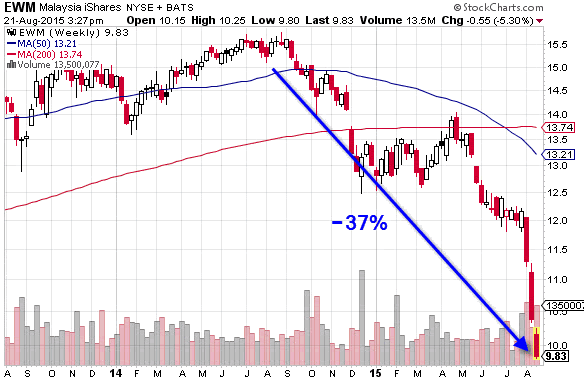
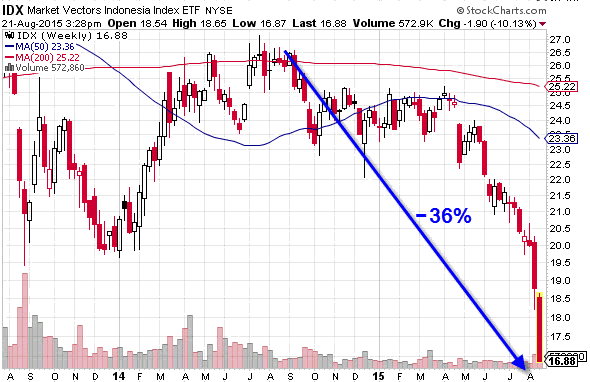
Stock Market Declines
In concert with the currency unwinds we are seeing deep distress in the peripheral stock markets. There are now more than 20 that are in ‘bear country’ meaning they’ve suffered declines of 20% or more from their peaks.
Here are a few select ones, with Brazil being in the worst shape:
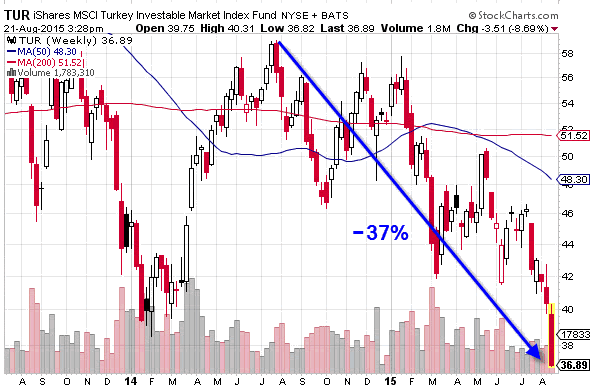
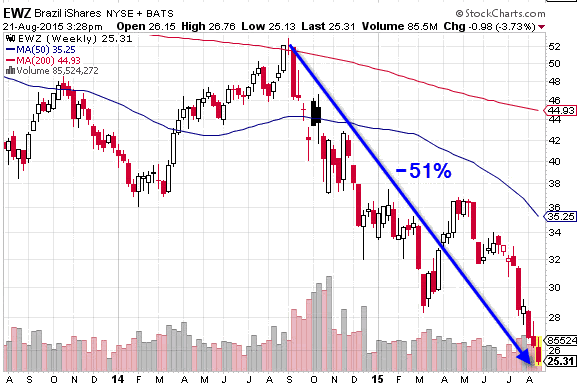
All of these signs reinforce the idea that the great central back liquidity tsunami has reversed course and is about to create a lot of damage and suck a lot of debris out to sea.
The Commodity Rout
A lot of EM countries are commodity exporters. They sell their minerals trees and rocks to the rest of the world, by which we mean to China first and foremost.
Commodities are not just doing badly in terms of price, they are absolutely being crushed, now down some 50% over the past four years.
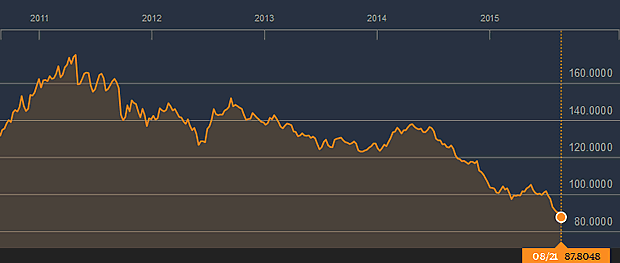
Source: Bloomberg
Commodities tells a number of things besides the extent of EM economic happiness or pain – they tells us whether the world economy is growing or shrinking. Right now they are saying “shrinking” which is confirmed by all of the recent Chinese import, export and manufacturing data, along with the dismal results coming out of Japan (in recession), Europe and the US.
Conclusion Part I
As we’ve been warning for a long time, you cannot print your way to prosperity, you can only delay the inevitable by trading time for elevation. Now, instead of finding ourselves saddled with $155 trillion of global debt as we did in 2008, we’re entering this next crisis with $200 trillion on the books and interest rates already stuck at zero. We are 30 feet up the ladder instead of 10 and it’s a long way down.
What tools do the central banks really have left to fight the forces of deflation which are now romping across the financial landscape from the outside in?
If the computers hiccup and give us some institution smashing or market busting 8 sigma move what will the authorities do? Shut down the markets? It’s a possibility, and one for which you should be prepared.
Where are we headed with all this? Hopefully not the way of Venezuela which is now so embroiled in a hyperinflationary disaster that stores are stripped clean of basic supplies, social unrest grows, and creative street vendors are now selling empanadas wrapped in 2 bolivar notes because they are, literally, far cheaper than napkins. Cleaner? Maybe not so much. I wouldn’t want to eat off of currency.

Source: Reddit
But make no mistake, the eventual outcome to all this is captured brilliantly in this quote by Ludwig Von Mises, the Austrian economist:
There is no means of avoiding the final collapse of a boom brought about by credit expansion. The alternative is only whether the crisis should come sooner as the result of a voluntary abandonment of further credit expansion, or later as a final and total catastrophe of the currency system involved.
The credit expansion happened between 1980 and 2008, there was a warning shot which was soundly ignored by ignorant central bankers, and now we have more, not less, debt with which to contend.
Venezuela has already entered the ‘total catastrophe’ stage for its currency, but Japan will follow along, as will everyone eventually who lives in a country that finds itself unable to voluntarily abandon the sweet relief of booms enabled by credit creation.
In Part 2: Prepare Now! we discuss how time is now running short to make adequate preparations in the event the long-overdue market correction arrives in force. Which one should you focus on most?
Click here to read Part 2 of this report (free executive summary, enrollment required for full access)

-
I know Mike is a very solid investor and respect his opinions very much. So if he says pay attention to this or that - I will.
~ Dale G.
-
I've started managing my own investments so view Michael's site as a one-stop shop from which to get information and perspectives.
~ Dave E.
-
Michael offers easy reading, honest, common sense information that anyone can use in a practical manner.
~ der_al.
-
A sane voice in a scrambled investment world.
~ Ed R.
Inside Edge Pro Contributors

Greg Weldon

Josef Schachter

Tyler Bollhorn

Ryan Irvine

Paul Beattie

Martin Straith

Patrick Ceresna

Mark Leibovit

James Thorne

Victor Adair