
Daily Updates
We have about six weeks of real trading left for 2011. Things will slow down as each day passes in December. (My office will close from December 10 to January 3). While the U.S. stock market is ever-so-slightly up for the year, I do anticipate significant tax-loss selling in most markets (although I suspect a fair amount has already taken place in the junior resource market during the last big downdraft).
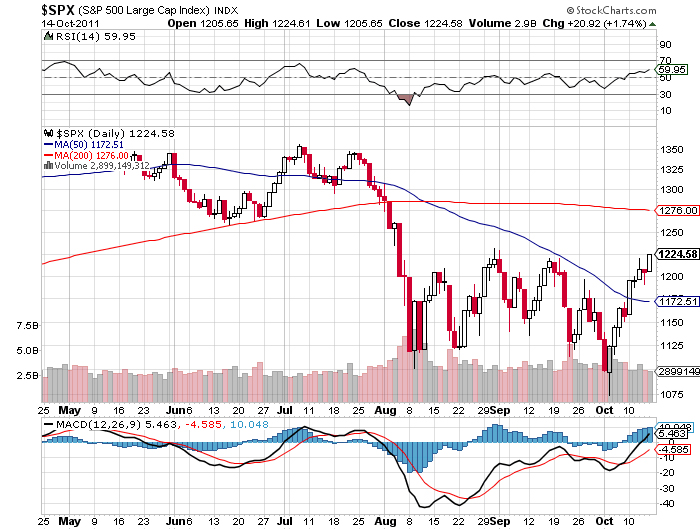
U.S. Stock Market – I and a zillion others spoke about 1120 being a key support level for the S&P 500 back in late September. I had noted that while I wasn’t highly anticipating it, the fact that the market didn’t break below it for more than a day or so suggested we could see a meaningful countertrend rally (and why I didn’t want to short the market yet again).
….read more on Precious Metals, US Bonds, US Dollar, Oil & Natural Gas HERE
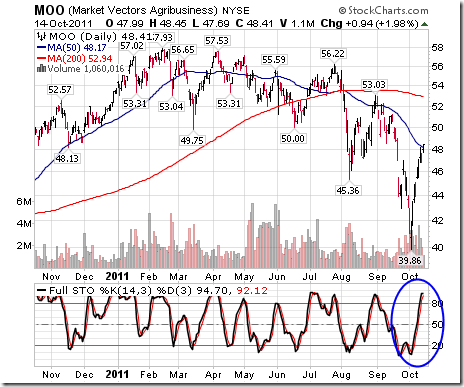
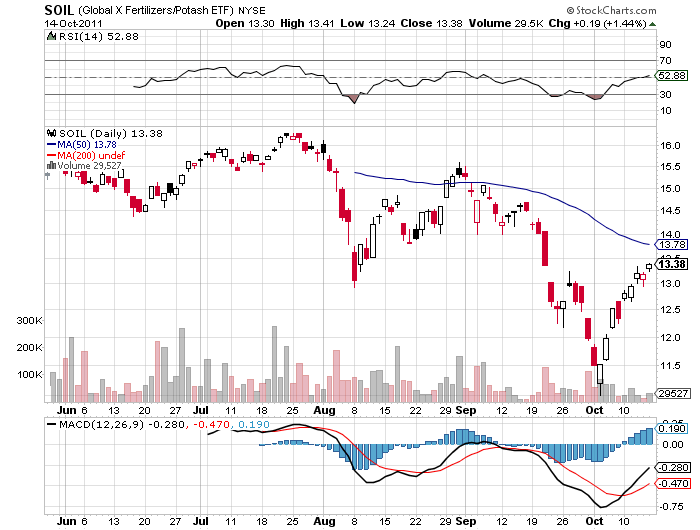
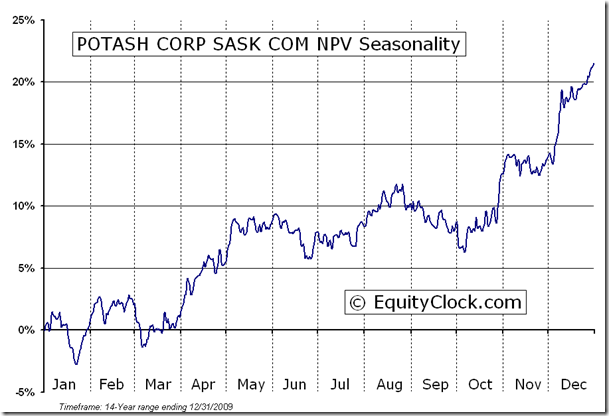
The Agriculture ETF gained $4.13 (9.33%) last week. The fertilizer ETF gained $1.04 (8.43%). Short term momentum indicators are trending higher. ‘Tis the season for the sector and the subsector to move higher!

The Bottom Line
The Bottom Line
Technical, fundamental and seasonal influences point to another volatile period for equity markets around the world this week. Economically sensitive sectors are following their seasonal patterns. However, most currently are short term overbought after huge moves since October 4th Preferred strategy is to accumulate economically sensitive equities and related ETFs on short term weakness, particularly if they benefit from favourable seasonal influences.
(Ed Note: This article will be updated later today with Don’s comments to Michael Campbell this weekend on Money Talks when the transcript comes in.)
Brooke Thackray, is Don’s subadvisor for the Horizons AlphaPro Seasonal Rotation ETF HAC.TO which is up 23% since inception 19/11/2009 and 12% in the past 12 months to 14/10/2011. You can sign up for Brooke Thackray’s Free Monthly Thackray Market Letter HERE
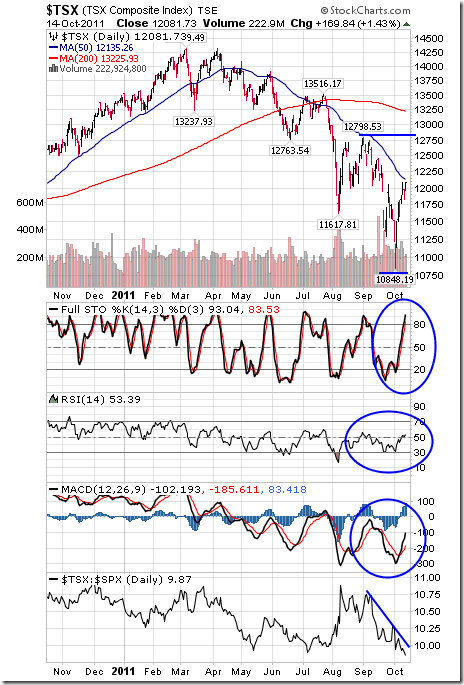
The TSX Composite Index gained 493.37 points (4.26%) last week on declining volume. Intermediate trend is down. Support is at 10,848.19. Resistance is at 12,798.53. The Index trades below its 50 and 200 day moving averages. Short term momentum indicators are trending higher. Stochastics already are overbought, but have yet to show signs of peaking. Strength relative to the S&P 500 Index remains negative.
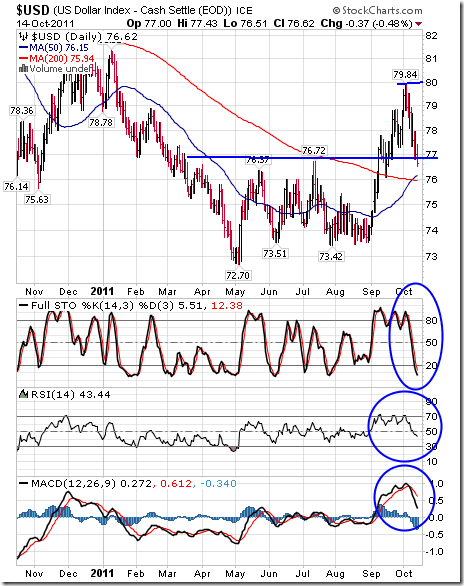
The U.S.Dollar Index fell 2.11 last week. The Index dropped to the top of a previous trading range where support is expected to emerge. Its 50 and 200 day moving averages near 76.00 also are likely support levels. Short term momentum indicators are trending down. Stochastics already are oversold, but have yet to show signs of bottoming.
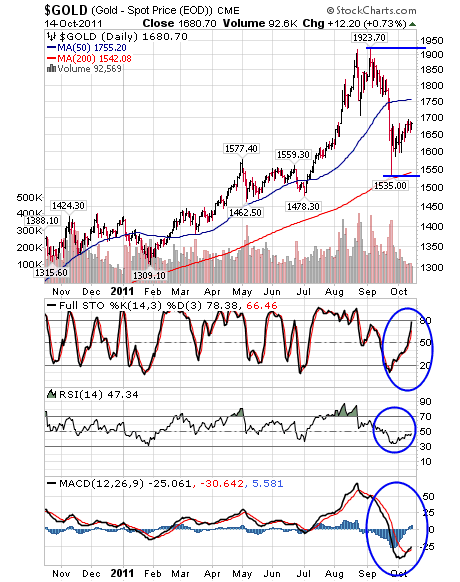
Gold gained another $38.20 U.S. per ounce (2.35%) last week on weakness in the U.S.Dollar. Short term momentum indicators continue to trend higher. Stochastics already are overbought, but have yet to show signs of peaking. Support is at 1,535.00. Resistance is at its all-time high at 1,923.70. Seasonal influences turn positive once again near the end of October
Don’s Monday Report has 45+ charts analysed plus he addresses Macro Issues, Third Quarter Earnings Reports, Economic news that could help the markets, Technical signs in the Long Bond Market, Seasonal Influences for a wide variety of sectors, the Vix dropping below key support and Short Term Momentum Indicators. Just go to Don’s Timingthemarket.ca and scroll down.
Don Vialoux and his co-subadvisors Brooke Thackray & Jon Vialoux run the Seasonal Rotation ETF HAC.TO
Don Vialoux
Don Vialoux has 37 years of experience in the Investment Industry. He is a past president of the Canadian Society of Technical Analysts (www.csta.org) and a former technical analyst at RBC Investments. Don earned his Chartered Market Technician (CMT) designation from the Market Technician Association in 1995. His CMT paper entitled “Seasonality in Canadian Equity Markets” was published in the Spring-Summer 1996 edition of the MTA Journal. Don also has extensive experience with Exchange Traded Funds (also know as Index Participation Units) as well as conservative option strategies. In 1990 he wrote a report that was released in the International Federation of Technical Analyst Journal entitled “Profiting from a Combination of Technical and Fundamental Analysis”. The report introduced ” The Eight Phases of the Stock Market Cycle”, an investment concept that continues to identify profitable entry and exit points for North American equity markets. He is currently a member of the Toronto Society of Fundamental Analyst’s Derivatives Committee. Now he is the author of a daily letter on equity markets available free on the internet. The reports can be accessed daily right here at www.dvtechtalk.com.
Intermediate and junior oil service stocks have been pummelled by as much as 50% or more in three short months—even as all fundamental data showed a booming sector—both now and into Q4.
Canadian analysts say the market is either discounting a much larger correction in activity for 2012 or this is a great buying opportunity for investors.
National Bank summed up what the analyst group think with these two paragraphs:
“If hydrocarbon prices rebound to 2011’s average levels, the fundamentals for service companies will remain intact and 2012’s activity levels will likely be record-setting; therefore, these prices may currently represent a once-in-a-decade entry opportunity.
On the other hand, if the market is correct, service companies’ 2012 EBITDA will be approximately 25%-50% lower than analysts’ current estimates, and this would represent the second biggest pullback ever since 2009’s 38% decline.”
Rig counts in both Canada and the US are peaking at 4-5 year highs, and haven’t fallen yet. The number of wells being drilled in Canada in Q3 soared higher than anyone expected, trying to make up for a very wet Q2 that prevented thousands of wells from being drilled. Wells drilled in August and September were the most since 2006.
The number of operating days jumped 39% in Q3 over Q2, due to more intensive horizontal drilling, which is now over 60% of all wells drilled. As a result, service rig activity is high and rising. Deep horizontal drilling rigs are basically at maximum capacity now, which the industry normally doesn’t see until winter.
So while the business was on fire in Q3, the stocks were getting doused with water. That’s what has analysts – and investors – befuddled.
Valuations were lowered so hard and fast that four Canadian firms issued reports early last week saying the sell-off in service stocks was overdone, and valuations had improved enough to where they thought investors should be buying—at least a bit.
And investors were listening. Canadian fracking stocks were up 15% or more in the shortened (Canadian) Thanksgiving week, on great volume.
Said RBC Dominion, Canada’s largest brokerage firm:
“Our coverage universe on average is now discounting 2012 results that are ~18% below our current estimates, based on a return to historical trough valuation multiples.”
“While activity levels for 2012 will become clearer once E&P budgets begin to be announced, starting with Q3/11 results, we view the discount for certain companies as particularly pessimistic in the current oil price environment.”
Of course, the market isn’t discounting the current oil price environment—it’s discounting much lower oil prices, like the $65-$70 oil that oil producers’ stocks were pricing in last week and corresponding major drop in capital spending that goes along with that.
I attended an oil and gas conference recently in which one of the presenting CEOs was asked—at what oil price do you cut spending? He really did not want to answer, but it finally came out–$80/barrel. So that’s why this current price level is important to hold for services companies.
The four analyst reports I read suggested stocks were now pricing in a reduction in 2012 activity that ranged from 18%-30%–which usually means a 35%-50% decline in share prices. That is already priced into the services stocks and then some, creating this buying opportunity, they say. (FYI, frackers have more leverage to producers’ spending levels than drillers, which gives their stocks bigger swings; they’re more volatile stocks.)
Analysts outlined several factors that they think could make this downturn in the oil services cycle different than before.
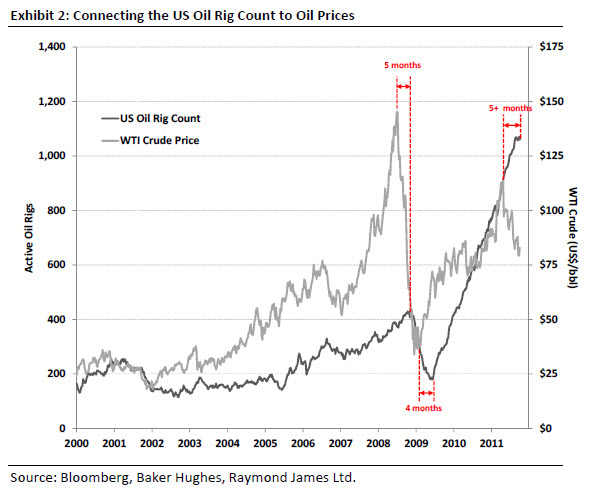
One factor is…well…it has been different before. Raymond James, a brokerage firm on both sides of the 49th parallel, says that between June 2009 and September 2010, the oil services stocks lost 38% of their share value—while the rig count kept going steadily higher, without even pausing.
That is the only time the market priced in a downturn in activity, and it didn’t happen. Raymond James pointed out that the rig count in both Canada and the US has now plateaued, “almost as if it’s trying to decide if the hitherto sound fundamentals or the forward-looking bearish technicals will win the day.”
The US onshore rig count stopped going up in August, and the Canada followed suit in mid-September. But they haven’t fallen, and Raymond James says it’s highly unusual for oil to go down 5 months like it has and not see a corresponding drop in rig count. It’s definitely a chin-rubber.
Another point is that for the first time ever, North American rigs are drilling mostly for oil, not gas. Previous cycles have all been predicated on the continental natural gas cycle—which is generally more volatile than the global oil market. Really. 😉
Even the natural gas rig count in the US is up for the year right now, despite very low prices and a bearish outlook.
Why? I would suggest it’s because gas rigs are now drilling for Natural Gas Liquids (NGLs) like ethane, propane, butane and condensate—and they can afford to sell the regular, dry natural gas at a low price. NGLs receive world pricing, and a lot of US produced NGLs end up in Latin America now.
The point is that the underlying commodity cycle for the services sector is different in North America now.
Toronto-based Cormark Securities mentioned several other items in their report:
- More long term contracts for drillers and frackers (or “pressure pumpers”)—the drilling fleet is 25% under contract, while pressure pumpers are enjoying >60% of capacity contracted in the US and ~50% in Canada
- Large joint ventures with National Oil Companies (NOCs) and other International Oil Companies (IOCs) have given US & Cdn E&P companies $21 billion to spend since early 2010 (they listed 21 different deals)
- Land sales. The industry has spent $3.4 billion on new land leases, with most of it in areas that already have excellent infrastructure, meaning access is easy to get in and the oil/gas is easy to get out (I would add that for Canada, if the newly tested Duvernay formation gets deemed commercial in Q1 2012, the entire services sector in the Great White North will continue to laugh all the way to the bank.)
Will this downturn cycle really be different for Canadian and US service companies? It has happened once before. Or are energy stocks – both the producers and the service companies – foretelling of lower oil prices and reduced spending in 2012?
RBC says investors should stick with the deep drillers; the trend is to deeper, longer horizontal wells. Cormark says go with the defensive large cap names with good liquidity. National Bank says go with geographic diversification and technological sophistication.
No matter the choice, investors will need to be nimble in this market.
– Keith Schaefer
Publisher, the Oil & Gas Investments Bulletin
To contact Keith on editorial issues, email him at: editor @ oilandgas-investments (dot com). Due to volume of email, Keith cannot guaranteed that he can answer each question individually.
For answers to common problems, such as changing your password or logging on, please refer to our Frequently Asked Questions page.
For all other issues, such as if you are a subscribed member and are having problems logging in or billing, please send an email to customerservice@oilandgas-investments.com beforephoning the customer support line.
The customer service email address is monitored 7 days a week while the phone line is only monitored during business hours, Monday to Friday.
Customer Service phone number: 1-877-844-8606

We often hear investors talk about buying undervalued stocks, but what does that mean and are we in a situation today where we can take advantage of low prices?
The typical definition of an undervalued stock is one that is trading at a historically low price to earnings multiple. A company that earns $1 a share and trades at 10 times earnings will trade at $10 a share. If that company tends to trade around 10 times earnings over a five year period but is currently trading at 8 times earnings, the value investor will say that it is undervalued. The expectation is that its price will eventually rise back up to its historical average.
The problem with this approach is that it opposes the idea that the stock market is efficient. What if the company’s products are not selling as well as they have over the past five years or what if the company’s rate of growth has slowed because of a weak economy? There may be very good fundamental justification for the lower price to earnings multiple.
Therefore, if investors are going to seek out stocks that are “cheap” we need to make sure that the market has made some sort of mistake in valuing them. We need to exploit breakdowns in market efficiency.
There are two primary assumptions of market efficiency that can be the source of a breakdown. First, we assume that investors have access to the same information. Second, we assume that investors act rationally.
What if our example company, trading at 8 times earnings, is a Biotechnology firm and the company discovers an important cure for a pervasive disease? If most investors do not know about this discovery, the stock will continue to trade around its current price. However, for the investor who has this new and not yet public information, the stock is undervalued. Once the market learns about the company’s new drug and its market potential, the stock should rise to price in the expected increase in earnings.
In this case, the stock is only undervalued to the investor who has better information than most investors. For an investor with a great deal of expertise in an industry and a willingness to invest the time and resources necessary to uncovering private information, this strategy for exploiting a break down in market efficiency is a good one. However, for most investors, this approach is not realistic.
This takes us to the second way that market efficiency can break down. Identifying times when the market is not acting rationally because of emotion can lead to market beating returns. Historically, anyone buying a market gripped by fear or selling a market in the clutches of greed has led to extraordinary profits. In the last three years, we have seen a lot of substantial price moves that have come out of the emotion of the market.
Since the end of April, we have had a market trading with a good deal of fear and uncertainty. Investors are unsure about the state of the global economy and have an even greater degree of uncertainty about debt issues in Europe, primarily in Greece, Portugal, Italy, Ireland and Spain. The fear is that bankruptcy by any of these countries could lead to a meltdown of the global financial system. That fear and uncertainty is why the market has been a yo-yo of price volatility.
Fear causes a market to trade for less than it is worth so we can say that this market, in general, is undervalued. The data supports this as company earnings have been improving over the past three years but prices have failed to rally. The average earnings multiple for stocks is lower than average.
The question we must answer is whether stocks are trading at lower earnings multiple because of an expectation that future earnings will be less or because investors are scared and uncertain about the future causing them to want to pay less for stocks.
There is evidence that fear is widespread in the stock market right now. The VIX index, a measure of implied option volatility and often referred to as the fear index, has been trending higher since early August. You can see a chart for this by looking at the VIX ETF, VXX.
The market for US Treasury Bonds recently hit new highs and has been trending upward since early August. You can see a chart for this by looking at the ETF, TLT.
Finally, despite the US Federal Reserve’s effort to devalue the US Dollar by printing more of them, the US Dollar has been very strong relative to other currencies over the late summer. Money has been seeking safety in the US Dollar.
Unless you believe in a financial apocalypse, these trends in the VIX, Treasury Bonds and the US Dollar are irrational and are instead motivated by fear. That means there is an opportunity to buy stocks that are undervalued.
Therefore, we should be looking to buy stocks that have suffered significant sell offs because of fear. However, trying to catch a falling knife is a dangerous game, so it is important that we time it right.
There are signs that the market is beginning to come out of its fear induced fog. The VIX has retraced significantly over the past two weeks as has the US Dollar and US Treasuries. Meanwhile, money has started to come back to stocks; the US stock market has made some very good gains over the same time period.
The Canadian market has lagged the US recovery but has risen enough to now threaten its long term downward trend line. A break of this line of emotional resistance would be a good sign that we have made bottom and are starting a period of price recovery. The chart of the TSX 60 ETF, T.XIU is an important one to consider if you are looking to come back to Canadian stocks, watch for a break of its downward trend line.
If you consider the seasonal tendencies of the market, now is the time to start buying stocks. The market tends to do be strong from October until the end of April and weak from May until the end of September.
The problem for most investors is that they feel the fear that pervades the market and find it emotionally difficult to buy stocks. If you are like most normal people, you will shun stocks at times like this and only return after they have gone up enough to feel a renewed sense of confidence. Unfortunately, the opportunity for market beating profits will have passed by the time investors are feeling confident again. The time to make the trade is when it feels difficult to do so.
Trying to pick a bottom in the market is a difficult thing to do. We have to expect that we may time it wrong and we have to be willing to take a loss if we come in too early. It is important to move in to the market slowly and build positions as the market confirms the bottom.
There are a lot of signs that the market has bottomed, making this a good time to start buying stocks again. While I think the market will be higher in the months ahead, I am not certain that prices won’t be lower than where they are right now. As long as the market does not move to new lows, I think it is a good time to buy pull backs as the market works on its recovery.


The Sentiment Stockscore is starting to rise on T.BBD.B as the stock builds a rising bottom. I will like the chart even more if it can close above $4.20 now that it has formed that first higher bottom from the low. Support at around $3.40.

T.BNK has performed well over the past two weeks and recently broke a downward trend line. The stock looks good here but risk management will be better if the stock pulls back and then breaks from a rising bottom. Support at $3.
T.TCM is trying to break its downward trend line, a move up through $8 would be a positive showing for the chart. If the stock can do that, put support at $7 on a trend reversal.
Good volume on a break through its downward trend line on Friday, an aggressive trader could enter here with support at $3 while a more conservative trade puts support at the low of the year, $2.40.
Disclaimer
This is not an investment advisory, and should not be used to make investment decisions. Information in Stockscores Perspectives is often opinionated and should be considered for information purposes only. No stock exchange anywhere has approved or disapproved of the information contained herein. There is no express or implied solicitation to buy or sell securities. The writers and editors of Perspectives may have positions in the stocks discussed above and may trade in the stocks mentioned. Don’t consider buying or selling any stock without conducting your own due diligence.
Market Buzz – Inflation and Interest Rates – Impact on Stock Market Returns and Income Investing
We often receive numerous questions about the direction of interest rates and how higher or lower rates might impact an investor’s portfolio. Most investors understand that the economy has enjoyed an extended period of low interest rates and also understand that rates move up and down in cycles. The fact is that there is a very strong relationship between interest rates and stock market returns, but before we discuss this relationship, we have to make sure our readers understand two basic economic concepts – inflation and monetary policy. Canada’s central bankers (Bank of Canada) measure inflation on a monthly basis in order to keep core inflation within a band of 1 to 3% per year. They work to achieve this through their control of the overnight rate, which is the interest rate at which banks loan each other money for a period of one day. When the economy is roaring and the labour market is tight, we typically see wages for workers increase and this (along with other factors) has the effect of increasing prices for consumer products and services – otherwise referred to as inflation. If the Bank of Canada determines that inflation is moving past the midpoint of the their target band, they use their tools to increase the overnight interest rate, which in turn lowers the banking sector’s access to capital, reduces the short-term money supply in the economy and hopefully puts a break on inflation – this is referred to as monetary policy. Think of the Bank of Canada’s use of monetary policy in terms of the way a rider will use their reins to control a horse. When the horse (economy) starts to charge forward too quickly, the rider (Bank of Canada) will pull back on the reins (increase interest rates) in order to slow it down.
Most investors mistakenly associate all interest rates with those under the central banks direct influence. The reality is that there is an interest rate on dozens of different types of bonds over dozens of maturities (three months to 30 years) and the central bank has minimal influence over most of them. When individuals and institutions purchase bonds they can select from a range of maturities ranging from less than one year to up to 30 years. Prevailing interest rates (bond yields), which are determined by supply and demand (not directly by central bank decisions), determine the cash payments that these investors will receive from owning the bonds. Higher interest rates therefore typically translate into a better reason to own bonds (relative to stocks). Currently, the average yield for five to ten year Government of Canada bonds is about 2% per year. That same investor can go to the utilities, banking, or telecom sectors and generate a similar (or higher) dividend yield that also provides them with the potential for dividend growth and capital gains. Of course, that investor will also incur higher risk.
So to answer the question…rising interest rates compete with the stock market by making bonds more attractive for new investors. However, it is not the central bank rate that investors need to focus their attention on, but more so on bond market yields and particularly yields in five to ten year bonds. Some investors will attempt to time interest rates and shift in and out of the stock market to take advantage of the cyclical changes. The problem with this strategy is that interest rates are extremely difficult, or even impossible, to forecast accurately over time. In addition, major changes in bond rates typically do not happen overnight, as cycles can take months or years to complete. This can result in investors trying to time the market for profit, but missing the correct entry points by very large time margins. As well, although the link between bond rates and stock market returns is adverse, income stocks still possess qualities that bonds cannot replicate – namely dividend growth and share price appreciation.
Looniversity – Authorized vs. Outstanding Shares
Authorized shares are the maximum number of shares that a corporation is legally permitted to issue under its articles of incorporation. This figure is usually listed in the capital accounts section of the balance sheet.
This number can be changed only by a vote of all the shareholders. Management will typically keep the number of authorized shares higher than those actually issued. This allows the company to sell more shares if it needs to raise additional funds.
Also known as “authorized stock” or “authorized capital stock.”
Outstanding shares are naturally the best to own as they are, after all, “outstanding”. All kidding aside, outstanding shares refers to the number of shares that are currently owned by investors. This includes restricted shares (shares owned by the company’s officers and insiders) and shares held by the public. Shares that the company has repurchased are not considered outstanding stock.
This number is more important than the authorized shares or float. It is used in the calculation of many metrics, including market capitalization and EPS.
Put it to Us?
Q. A friend of mine who recently bought stock in a company was complaining about its “liquidity”. What does liquidity refer to in reference to investing?
–
Lindsay Montador; Halifax, Nova Scotia
A. A. Liquidity and or ‘marketability’ refers to whether you can sell or redeem your investment quickly at or near the current market price.
Term deposits are an example of an illiquid investment, since you generally can’t withdraw your money before the end of the term without paying a significant penalty.
Many other investments, such as mutual funds or listed securities (stocks), in relative terms, are very liquid because they can be quickly sold or redeemed on short notice and at low cost.
In your friend’s specific case, she may have been referring to a stock which does not trade a great deal on a daily basis. This can happen, particularly in the small-cap arena. If this is the case, then a patient approach is often key. Set your price and be prepared to wait a couple days or trading hours to get it.
KeyStone’s Latest Reports Section
- Near-Term SELL – Remove Risk, Crystallize 156% Gains (Flash Update)
- Cash Rich Communications Software Company Significantly Beats Q3 Estimates, Holds Approx. 40% of Market Cap in Cash, Acquisitions Provide Growth – Maintain Rating (Focus BUY) (Flash Update)
- IP Company’s Q1 Fiscal 2012 EPS Meets Expectations, Management Makes Potentially Transformational Acquisition in the Face of Unsolicited Takeover Bid, Shares Now Up Over 159% – Maintain Rating (Flash Update)
- SELL Two China-Based Canadian Listed Stocks – Quick Update on Current Ratings (Flash Update)
- Profitable Micro-Cap Mobile Satellite Company With Zero Debt, 70% of Market Cap in Cash, Consistent Cash Generation from Core Product with Growth Potential – Initiate Coverage with BUY (New Buy Report)
Disclaimer | ©2011 KeyStone Financial Publishing Corp.
Regards,
Jenny McConnell,
Administrative Assistant/Office Manager
-
I know Mike is a very solid investor and respect his opinions very much. So if he says pay attention to this or that - I will.
~ Dale G.
-
I've started managing my own investments so view Michael's site as a one-stop shop from which to get information and perspectives.
~ Dave E.
-
Michael offers easy reading, honest, common sense information that anyone can use in a practical manner.
~ der_al.
-
A sane voice in a scrambled investment world.
~ Ed R.
Inside Edge Pro Contributors

Greg Weldon

Josef Schachter

Tyler Bollhorn

Ryan Irvine

Paul Beattie

Martin Straith

Patrick Ceresna

Mark Leibovit

James Thorne

Victor Adair