
Daily Updates
Everybody loves the Street!
Quote: “The Capitalists will sell us the rope with which we will hang them.” – Vladimir Lenin
It used to be we only had bulls, bears, bucket shops, manipulators (aka specialists), syndicates (aka manipulators), sheep, wolves, tipsters, and an assorted array of those fond of members (again, sorry for the redundancy), the self-righteous, idealists, kids who hate school and Cramer (very scary I know). Wow! In short, everyone loves the Street now.
Why is this important? It is important for a lot of different reasons, I guess, depending on where you sit or stand.
Believe in Oil & Uranium
Steve Palmer, chief executive of Toronto investment firm AlphaNorth Asset Management, scans the market for inefficiencies. And it pays off in the long term. While comparable market benchmarks are down as much as 46%, his small-cap fund has returned nearly 200% since its launch in 2007. In this exclusive interview with The Energy Report,Palmer explains why his long-term vision makes him a continued believer in oil and uranium.
The Energy Report: About 30% of the AlphaNorth Partners Fund, which consists mostly of Canadian securities, was invested in tech stocks, with similar percentages in metals and energy the last time we spoke in May. What’s the asset mix now?
Steve Palmer: Technology stocks comprise about 32%, metals 26% and energy 27%.
TER: Although the fund was down about 6.5% in August, it is up 23% for the year through August. It was down about 15% in September, but it’s still positive on the year. What edge does AlphaNorth have that allows you to make gains in an economic climate that’s as negative as this one?
SP: It’s very difficult to make money when markets drop more than 10% in a month. We don’t pretend to be able to make money in those kinds of months like we experienced recently and in the fall of 2008. However, since inception of the fund in December 2007, the fund has returned approximately 190% despite declines in the Canadian indices.
The Canadian indices that I use as benchmarks are both negative. The S&P/TSX Venture Index, which is the closest benchmark to what we do, is down 46% over that timeframe and the S&P/TSE Composite is down 5%. Despite the poor markets, we’re still able to generate substantial returns over a long-term timeframe.
TER: What is your primary strategy for generating profits?
SP: Good stock picking. We’ve had some good calls on specific stocks. We’ve been able to sell them at the right time. We use technical analysis to help do that. We do some hedging in the Partners Fund at certain times when we think the market is vulnerable to a correction. That has helped cushion the downside and contribute to positive returns when the short positions work out.
TER: In the coming quarters, do you see yourself leaning more towards one of those sectors that you mentioned earlier, perhaps at the expense of another?
SP: No, not particularly. Given the correction, all of those sectors have been beaten down pretty good. There are a lot of bargains across the board now.
TER: Let’s take a closer look at the energy portion of the AlphaNorth Partners Fund. What’s the mix in terms of oil and gas, uranium, renewable and coal?
SP: It’s mainly oil-focused. Coal would be the next most significant component and then iron ore and uranium.
TER: Uranium’s off the radar for many investors given the events resulting from the tsunami in Japan earlier this year. Are you still a believer in uranium?
SP: Yes, I’m still a believer. Long term, the supply/demand should result in higher prices. China’s still moving forward with building many new nuclear plants. There’s a huge demand for power in many parts of the world. Uranium is, in many cases, the most practical way to add power. It’s unfortunate what happened in Japan. It’s created a negative investor sentiment in the short term, but the fundamentals are expected to be strong over the long term.
TER: Many uranium projects being developed need $50 uranium just to break even. The spot price for uranium is just above that now. Do you believe Chinese demand alone can bring uranium prices up enough to make smaller development projects sustainable?
SP: Chinese demand will account for probably more than half of total new demand over the next 10 or 20 years. We’ve been working through stockpiles from nuclear weapons, but that’s pretty much depleted now. We do need new supply, but there are not many new uranium projects coming on.
TER: China’s Sichuan Hanlong Group is in takeover talks with Bannerman Resources Ltd. (BAN:TSX; BMN:ASX), which owns two uranium development projects in Namibia. Uranium titan Cameco Corp. (CCO:TSX; CCJ:NYSE) is in the midst of a hostile bid for Hathor Exploration Ltd. (HAT:TSX.V), which has a high-grade uranium project in the Athabasca Basin. These are clearly cases of larger companies preying on smaller uranium companies beset by low share prices. Could it be time to take positions in uranium companies with near-term development projects?
SP: It just demonstrates that larger companies need to increase production and economic uranium deposits are very difficult to find. They are more difficult to find than many other commodities. The good projects are going to be in high demand.
TER: What are some uranium stories in the fund?
SP: Athabasca Uranium Inc. (UAX:TSX.V; ATURF:OTCQX) is one.
TER: It’s not all that far from Hathor. It’s about to begin a drilling program in the next few weeks. What are you expecting from that?
SP: I’m not expecting anything, but I’m hoping for good results. It’s in the right neighborhood and there’s obviously a lot of high-grade uranium and some very profitable mines close by. The company has a very small valuation; they have reasonable odds of success. I’m just hoping that the drills are kind.
TER: Do you have any holdings in Australia?
SP: We have a stake in Mega Uranium Ltd. (MGA:TSX) in one of our other funds.
TER: What do you like about that story?
SP: It’s cheap. It has defined deposit in Australia, which is a good jurisdiction. It’s not just a one-project company.
TER: Some of those projects are in locations that need some political will in order to begin mining. Do you see that happening?
SP: Yes. I think there’s a decent chance that it will change. You need some political will in many areas for uranium. It’s not something that people typically welcome. The permitting process can be quite long regardless of where you are.
TER: What are some oil and gas stories that are undervalued right now?
SP: Canadian Overseas Petroleum Ltd. (XOP:TSX.V) has assets in the North Sea, which is a good jurisdiction. Management has drilled wells there before and been quite successful. They have multiple locations to drill. It has lots of cash to complete the job. If you risked their drill targets, you still get a net asset value (NAV) over $1 a share. It’s currently trading at $0.32.
I just saw some research yesterday from an analyst that has a risked NAV of $1.20. Assuming all of their drilling is successful, the potential NAV would be roughly $3.50. That’s unlikely to occur because they are not going to be 100% successful. The end result will be somewhere in between those two numbers.
TER: Is there another intriguing name?
SP: Primary Petroleum Corp. (PIE:TSX.V) is very cheap and it has a lot of potential. Primary is an emerging play in Montana for the Bakken. It’s a shale play that extends into Montana from Alberta. Several larger U.S. companies seem to be having some good success there. Rosetta Resources Inc. (ROSE:NASDAQ) and Newfield Exploration Corp. (NFX:NYSE) have been having a lot of success drilling in Montana. Primary has about 300,000 acres, which is quite large for a small company. It also recently signed a letter of intent with a U.S. major to farm in on the majority of their acreage where the partner will fund the exploration. Primary will have no requirement to spend any of its cash and it will benefit from the expertise and experience of its partner.
TER: What’s your outlook for the energy sector?
SP: Energy is one of the commodities I favor. It’s a resource that’s gone once you use it, so you constantly have to keep finding more. The demand continues to grow.
TER: Thanks.
Steven Palmer, CFA, serves as president, CEO and a director of AlphaNorth Asset Management since founding the firm in 2007. AlphaNorth currently manages a long-biased, small-cap hedge fund. As VP of Canadian equities at one of the world’s largest financial institutions, he managed assets of approximately $350M. He also previously managed a small-cap pooled fund, achieving returns ranked #1 by Morningstar Canada. He has a BA in economics from the University of Western Ontario.
Want to read more exclusive Energy Report interviews like this? Sign up for our free e-newsletter, and you’ll learn when new articles have been published. To see a list of recent interviews with industry analysts and commentators, visit our Exclusive Interviews page.
DISCLOSURE:
1) Brian Sylvester of The Energy Report conducted this interview. He personally and/or his family own shares of the following companies mentioned in this interview: None.
2) The following companies mentioned in the interview are sponsors of The Energy Report: Athabasca Uranium Inc., Mega Uranium Ltd. and Bannerman Resources Ltd.
3) Steve Palmer: I personally and/or my family and/or AlphaNorth may own shares of the following companies mentioned in this interview: None. I personally and/or my family am paid by the following companies mentioned in this interview: None.
via Stratfor (for Crisis Timing read D-Day in Europe)
Climax Crisis Catastrophe or Crunch – Certainly There’s BIG Trouble Looming
Martin Armstrong has been called on by the Joint Economic Council of Congress to testify on economic issues, as well as the Brady Commission, where he was invited to share his views on the 1987 market crash (which he predicted using his computer models far in advance of the crash). Martin Armstrong has often been quoted by news organizations such as the New York Times, Wall Street Journal and Bloomberg. He has also appeared on CNBC and other financial broadcasts sharing his views. Martin has devoted his time to analyzing financial markets, studying the history of business cycles, market crashes and world monetary systems.
In September, 1999, Martin was accused of securities fraud stemming from wild and unfounded allegations related to his business in Japan. After spending nearly seven years in civil contempt without a criminal trial Martin resolved his legal case with the US government in August 2006, but was not released from federal prison until March 2011. There are many more details about Martin’s legal case, and over time Martin’s web site will provide more information for your reference.
While in confinement, Martin Armstrong continued researching the world economy and typing reports on an old-fashioned typewriter with no access to a computer, Internet or email.
Martin Armstrong is now released under home confinement, where he plans to continue his research and publications.
- About Martin Armstrong (June, 2011)
- Martin Armstrong Answers Frequently Asked Questions: They didn’t understand Hedging vs Speculating? (Martin Armstrong, 07/01/11)
- Martin Armstrong Answers Frequently Asked Questions: The $400 Million Vanishing Act (Martin Armstrong, June 2011)
- Martin Armstrong Answers Frequently Asked Questions regarding his case (June, 2011)
Thank you for visiting Armstrong Economics dot com and reading Martin Armstrong’s economic writings.
ArmstrongEconomics.com
The US monetary system — and by extension, that of much of the developed world — may very well be on the verge of collapse. Falling back on metaphor, while the world’s many financial experts and economists sit around arguing about the direction of the ship of state, most are missing the point that the ship has already hit an iceberg and is taking on water fast.
Yet if you were to raise your hand to ask 99% of the financial intelligentsia whether we might be on the verge of a failure of the dollar-based world monetary system, the response would be thinly veiled derision. Because, as we all know, such a thing is unimaginable!
Think again.
Honestly describing the current monetary system of the United States in just a few words, you could do far worse than stating that it is “money from nothing, cash ex nihilo.”
That’s because for the last 40 years — since Nixon canceled the dollar’s gold convertibility in 1971 — the global monetary system has been based on nothing more tangible than politicians’ promises not to print too much.
Unconstrained, the politicians used the gift of being able to create money out of nothing to launch a parade of politically popular programs, each employing fresh brigades of bureaucrats, with no regard to affordability.
Former VP Cheney, who fashions himself a fiscal conservative, let the mask drop when, in 2002, he stated that “Reagan proved deficits don’t matter.”
Those words were echoed just a few weeks ago, when both former Fed Chairman Alan Greenspan and Obama economic advisor Larry Summers, in separate interviews, said almost the same, paraphrased as, “There is no chance of the US defaulting on its bonds, not when our government can borrow dollars and print new dollars to meet any future obligations.”
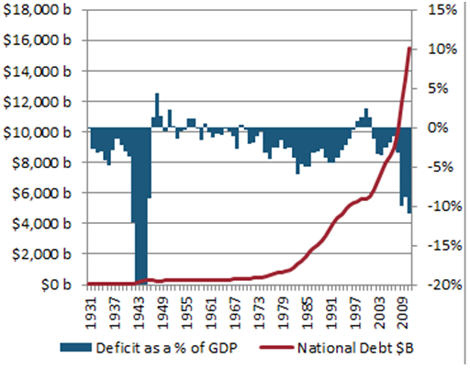
Of course, Greenspan and Summers were referring to an overt default — of just not paying — and not to a covert default engineered by inflation. Unfortunately, like virtually all of the power elite, both miss the point that the mountain of debt that has been heaped up since 1971 is fast reaching the point of collapsing like a too-big tailings pile and taking the monetary system down with it.
Importantly, the debt shown in this chart whistles past the government’s unfunded liabilities, in particular for the Social Security and Medicare systems. Adding those would quintuple the US government’s acknowledged obligations — to over $60 trillion.
Given the role the US dollar plays as the world’s de facto reserve currency — with all major commodities priced in dollars, and dollars forming the bulk of reserves held by foreign central banks — the dismal shape of the US monetary system spells trouble for the global monetary system.
Making matters worse, following the lead of the United States, governments around the world long ago adopted similar fiat monetary systems. You can see the deficit contagion in this next chart. It is worth noting that the dire condition of the United States now leaves it in the same muddy wallow as Europe’s desperate PIIGS.
 \
\
In a recent article in The Telegraph, Ambrose Evans-Pritchard referenced a paper out of the BIS that paints the picture using appropriately stark terms.
Stephen Cecchetti and his team at the Bank for International Settlements have written the definitive paper rebutting the pied pipers of ever-escalating credit.
“The debt problems facing advanced economies are even worse than we thought.”
The basic facts are that combined debt in the rich club has risen from 165pc of GDP thirty years ago to 310pc today, led by Japan at 456pc and Portugal at 363pc.
“Debt is rising to points that are above anything we have seen, except during major wars. Public debt ratios are currently on an explosive path in a number of countries. These countries will need to implement drastic policy changes. Stabilization might not be enough.”
Viewing the situation from another perspective, we turn to the work of Carmen Reinhart and Ken Rogoff, who studied the factors contributing to 29 past sovereign defaults. They found that default or debt restructuring occurred, on average, when external debt reached 73% of gross national product (GNP) and 239% of exports. Using the Reinhart/Rogoff findings, Casey Research Chief Economist Bud Conrad prepared the following chart showing that the US government is already far along on the path to bankruptcy.
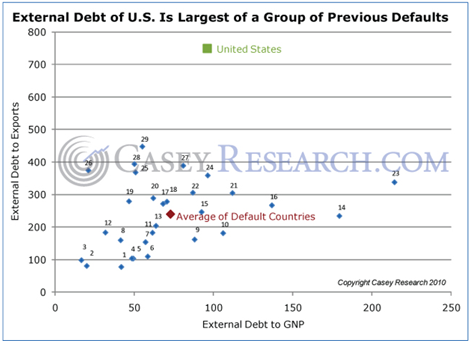
It’s hard to argue against the contention that the situation is, to be polite, precarious. Given that the obligations of the US government, as well as most of the world’s other large economies, are now impossible to repay and that their reserves are just IOUs backed by nothing, the stage is set for a highly disruptive but entirely necessary do-over of the fiat monetary system.
“Preposterous!” say the lords of finance and masters of all.
Is it?
Of course, these very same mavens completely missed the looming housing crash and the depth and duration of the subsequent crisis — a crisis that is still far from over. In other words, listen to them at your peril, because in our view it’s essential in calibrating your financial affairs to understand that, if history is any guide, we are now well down the road to a collapse in the monetary system.
Regards,
David Galland,
for The Daily Reckoning
Michael Campbell: With all the gyrations, confusion and negative bias up until very recently Don, was that just part your buy when it snows and sell when it goes strategy?
Don Vialoux: It certainly was and given the whole idea is that you buy when it snows there actually is a forecast for snow in Northern Ontario today. Tells you that now is the time of year to reconsider getting back into the market. In fact we had a very important inflection point in both US and Canadian equity markets on October the 4th that was the start of the period of seasonal strengths for this year and that implies that now is good time to be in a equity markets with some qualifications.
Michael: Lets get those qualifications out right now.
Don: Since October the 4th we have seen the TSE composite index go up 11. 4%. We see the NASDAQ composite index go up 16.0% and those moves are all within less than two weeks. An amazing recovery for equity markets, we were oversold on October the 4th and now quickly we have become overbought short term. The qualification is we should be buyers of Canadian and US equities and ETFs on any kind of weakness between now and the traditional entry period of October 28th.
Michael: Buy dips?
Don: Very much so. To put in perspective looking at the percentage of stocks of the S&P 500 that were above the 50 day moving average. Two weeks ago 20% of S&P 500 stocks were above their 50 day moving average, as of last night it’s 80%! That’s very clearly an overbought level implying that we should look for a bit of correction between now and the next couple of weeks.
We are just entering the big third quarter earnings report periodand theser earnings reports are not going to be nice. They are going to be significantly lower in many cases than many analyst’s had expected. These earnings reports could cause a dip in the market.
Once the earnings reports are out of the way, its off to races to the upside until at least January 2012.
Michael: Your methodology is seasonality ,which is looking at tendencies in different seasons of the year as the indicator for getting in or out of the market. Is it really that simple?
Don: It really is that simple. There are certain sectors in markets that move higher at certain times of the year based on annual recurring events. I mentioned October 28th based on historical data over the last 60 years is on average a day that you want to move into equity markets in North America. Then you have to fine tune that date each year using technical analysis, looking for momentum indicators that tell you if the markets are oversold right around that time. It’s usually October 28th plus or minus about three weeks and we actually got an oversold market on October the 4th here in 2011. Momentum indicators had turned positive so we started to re-enter the market in our Horizons AlphaPro Seasonal Rotation ETF at that time.
Michael: What key factors this year told you that the turning point would be to October 4th instead of the average of October 28th?
Don: It is so important to be very disciplined to take this approach. We looked for momentum indicators to be oversold right around this time of year. The particular momentum indicators we look at are stochastics, specifically when they are below 20% and moving towards exceeding that level. We look for the RSI, the Relative Strength Index being 30% and moving higher above that level. We are also looking at moving average convergence, an oversold level thats giving you a positive crossover. Now these things don’t always happen exactly, but generally speaking they do happen at major bottoms in the market and we had a number of those signals actually occur shortly after October the 4th.
Michael: Do you have a checklist and as they are checked off its starts to tell you the direction has changed?
Don: It’s so important that you combine the technical’s, the fundamentals, annual recurring events and seasonality. When they all come together that’s when you do a trade.
Traditionally equity markets move higher between now and around the first or second of January and that has a lot to do with how people are perceiving markets at this time of year. We’re getting into the Christmas period, people are in happier mood thinking about Christmas, buying gifts, consumer electronic goods (like the huge lineups for iPhone 4S‘s) and markets want to go higher on all this good news. It’s also the fourth quarter earnings report period and companies just love to give you good news with those fourth quarter results since they’re just prior to release of their annual result. Bottom line is a positive period of anticipation going into early January of each year.
Michael: How would your seasonal, technical and cyclical indicators be affected if a big piece of fundamental news occurred, for example if Greece fell off the edge of a cliff right in the middle of a predicted seasonal turn?
Don: There is no question that macro events do have an impact on markets and we’ve had a lot of macro events during the last three or four weeks. What it’s done is created a huge amount of volatility in the equity markets, much higher than average. As long as these macro events continue, as we expect they will over the next few weeks, there will be continued very high volatility in the equity markets.
Michael: In early August you were looking for lows in gold stocks somewhere in the August, September time frame. What do you see now?
Don: The sectors, which do very well between now and the end of the year, tend to be technology, consumer discretionary, industrials and agriculture. Gold and silver are very fascinating. Normally gold and silver start moving higher right around the beginning of July, as they did this year, hen they tend to strengthen right through until the third week of September. Normally after that they go into a brief correction into the month of October, but this year is the seasonality peaked out sooner than expected. It actually peaked out around the second week in September, instead of near the end of the September. So we had a technical sell signals on gold, silver and precious metals stocks at that point in time so we took some really nice profits in our fund. But this is also telling me something else. It means that the period of seasonal weakness which you normally get into month of October is not happening this year. The seasonality has all been pushed forward or backwards by approximately one month, and we actually had some technical buy signals on both gold and silver as well as precious metal equities during the last two weeks.
Since 2003 the classic time to buy gold is when it touches it’s 200 day moving average, and it got all the way down to that level( $1,535) two weeks ago. It was a classic opportunity to buy gold at that time. If you look now gold it is at $1,681, that’s a huge move and it happened very quickly. Clearly for gold the next period of seasonal strength goes from now right through until the end of February so we have lots of room and lots ofd time on the upside for both gold and for silver. Also silver normally outperforms gold during this October to February period so I suggest you may want to focus on the silver sector as opposed to gold.
Michael: How has your Horizons AlphaPro Seasonal Rotation ETF performed this year?
Don: We are up to 25% since we launched this fund 22 months ago, and the net asset value of the fund hit an all time high yesterday. Our seasonal fund is showing better than average returns in the markets and it’s also showing less volatility than most other funds as well.
Michael: What sectors/industries besides silver and gold are you looking to buy on dips right now?
Don: We’ve actually gone back into the agriculture sector during the last ten days or so. Here is the story; agriculture normally does very well from the beginning of July right through until the end of the year, but the real sweet spot for agriculture is actually from the beginning of October right through until the end of December. A lot of that has to do with grain prices. This time of year grain prices start moving higher like agriculture generally from the beginning of October right through until the end of December. If you want to get a feel for what’s happening there is a ETF which actually tracks the top three grains, the symbol is JJG. That particular ETF bottomed about ten days ago (October 5th) and started moving higher. That’s a classic tipping indication of what’s going too happen with the agriculture stocks in general. They have already had a pretty huge move in the last ten days again so that’s the opportunity too buy the sector, if you can, on weakness, on dips over the next few weeks.
The key is to be on top of these things at all times. A classic example, the agriculture ETF that people look at in Canada is the symbol is COW, and the US it’s MOO. MOO during the last ten days is up 21.5% from it’s low on October the 4th. That’s a huge move so do you want to buy at these prices? Probably not, but you could get up to a 50% correction in MOO that would provide another opportunity to get into the sector. One of the things to watch when you’re going into these seasonal trades? You don’t only want to be in a sector which is has good seasonality, you also want to be into sectors which are outperforming the market. As long as the sector is outperforming the market you stick with the seasonal trade.
Michael: Can you explain the simple technical rule of thumb, the 50% rule?
Don: Yes something which one of your guests previously, Dennis Gartman mentions quiet frequently. Often a security will go back to what he calls the box. The box is a retracement of between 40% and 60% of a previous move. Lets say a stock goes from $10 to $20, or a $10 move. If you get a correction of 40% of that $10 move fyou will see the price at $16 or the top of the box. If you get a 50% correction of that $10 move it will be $15 or you will be in the box. That’s the time to buy it.
Michael: Is there any tech or consumer tech that you are looking at in this period?
Don: Yes we like technology in general because this is a time when people are buying consumer electronic goods for Christmas. We also do something else, we not only buy the technology sector in general but we look at sectors in the technology sector that are outperforming. One of those outperforming subsectors is the semiconductor sector which is out performing technology. So we made the choice of buying into the semiconductor as well as the technology sector.
Michael: When you were investing in the technology sector are you looking for an exchange traded fund or are you picking specific stocks?
Don: Great question, first of all we look at the sector, and then we look at the subsector, it could be semiconductors, it could be internet, it could be software. Then we choose only the subsector which is outperforming. Then we look at the individual stocks that are part of that subsector and we invest into the individual securities. The key is to watch the performance of these securities over time, for example as soon as an individual security starts to underperform the subsector, it’s gone. As soon as the subsector underperforms the sector its gone. The key is to always be in securities or sector that’s outperforming the market.
Michael: What is your outlook on oil?
Don: Historically oil doesn’t do that well at this time of the year. Historically, the best time to be in the oil stocks and the energy stocks in general is from the end of January right through until May. It doesn’t necessarily mean that the sector will not do well, it just means that it probably will underperform the markets between now and January. So, we don’t have a focus on the energy sector at this time.
Michael: With all these titanic events going on in Europe, China, Canada and the USA, what is the currency play in all of this?
Don: C urrencies don’t have an impact on our fund because we hedge everything. We are not experts on currencies and don’t even try to be. Why take a chance? It’s been interesting to watch how currencies have been acting. The Canadian dollar actually has very strong seasonality and you can sometimes incorporate this into your investment strategy. Historically, the Canadian dollar is strongest from March to May of each year and it is weakest from October to December each year. Right now is a weak period of time for the Canadian dollar and I think the Canadian dollar hit a very important low about 10 days ago and recently has been recovering. It’s come all the way back to an important resistance level which implies that the recent bounce we’ve seen over the last 10 days is probably not going to go much further.
Michael: It’s uch a fascinating way you work through things and people can get more on that with www.timingthemarket.ca and also Don and his son Jon’s EquityClock.com. Don has been a regular guest on Money Talks, also key note speaker at Money Talks World Outlook Conference with his fascinating interpretation of markets, the clarity of his methodology and his discipline.
Fascinating as usual Don, I appreciate your finding time to speak with us this weekend.
Don Vialoux
Equity Clock is a division of the Tech Talk Financial Network, a market analysis company that provides technical, fundamental and seasonality analysis on a daily basis via TimingTheMarkets.com and EquityClock.com. Equity Clock’s mission is to identify periods of reoccurring strength among individual equities in the market using methodologies presented by some of the top analysts in the industry, including that of Don Vialoux, author of TimingTheMarkets.com.
Don has 37 years of experience in the Investment Industry. He is a past president of the Canadian Society of Technical Analysts (www.csta.org) and a former technical analyst at RBC Investments. Don earned his Chartered Market Technician (CMT) designation from the Market Technician Association in 1995. His CMT paper entitled “Seasonality in Canadian Equity Markets” was published in the Spring-Summer 1996 edition of the MTA Journal. Don also has extensive experience with Exchange Traded Funds (also know as Index Participation Units) as well as conservative option strategies. In 1990 he wrote a report that was released in the International Federation of Technical Analyst Journal entitled “Profiting from a Combination of Technical and Fundamental Analysis”. The report introduced ” The Eight Phases of the Stock Market Cycle”, an investment concept that continues to identify profitable entry and exit points for North American equity markets. He is currently a member of the Toronto Society of Fundamental Analyst’s Derivatives Committee. Now he is the author of a daily letter on equity markets available free on the internet. The reports can be accessed daily right here at www.dvtechtalk.com.
-
I know Mike is a very solid investor and respect his opinions very much. So if he says pay attention to this or that - I will.
~ Dale G.
-
I've started managing my own investments so view Michael's site as a one-stop shop from which to get information and perspectives.
~ Dave E.
-
Michael offers easy reading, honest, common sense information that anyone can use in a practical manner.
~ der_al.
-
A sane voice in a scrambled investment world.
~ Ed R.
Inside Edge Pro Contributors

Greg Weldon

Josef Schachter

Tyler Bollhorn

Ryan Irvine

Paul Beattie

Martin Straith

Patrick Ceresna

Mark Leibovit

James Thorne

Victor Adair